ADABTC - One down, 2 more to go!As profit target #1 hit quickly, you were able to add back to your position on that test of the FIB level near the demand zone, which was a gift! Having entered back in, you would now find yourself back in the supply area where we first rejected and are now trying to break out of. Seeing that BTC has returned back in the range after a hectic Wednesday evening, we are primed to breakout from this area and head for the next target, which is near the 50%FIB around 1200. If Bitcoin can remain flat for the next few days, some altcoins looked primed for breakouts as some have already moved quite a bit signaling some good times ahead.
And as I write this ADA has already broken out ;)
Please hit the 'like' button and give us a follow!
Let us know what you think below!
Thanks
Cardanobtc

ADABTC - 4H - UpdateCardano has moved up impressively after testing the demand area around 0.00001 with significant volume. Some macro news regarding a partnership with Metaps Plus, which enables ADA for purchases in 33,000 stores in South Korea.
We can see that ADA has broken above the supply zone it had trouble to break multiple times and we will soon see if it uses it as support, which also coincides with the 23.6%FIB level. If we can get a strong bounce from this level, a long position can be entered near this zone with targets outlined in the chart.
However, we can see that the RSI and MACD have both moved up but the RSI is hitting resistance at the downward trendline so traders need to keep an eye on this if they are planning to enter a position. As always, one must keep an eye on BTC's price movement to give an indication whether or not to enter or hold off on a trade.
If BTC rejects where we currently stand, it might be a good idea to wait it out and see what BTC decides to do! Always respect your risk management!
Please hit the 'like' button and give us a follow!
Let us know what you think below!
Thanks


Cardano slowly moving toward supportAs per our analysis in the mid-August, Cardano has been moving towards the Fibonacci 127.2% extension support after breaching the key short-term horizontal support around 0.0000170. The coin also performed a perfect re-test formation - breaks the support, closes comfortably below and returns to re-test the support, now in the form of a resistance. This offered another opportunity for bears to increase their stakes and push the price further down. Since then, #ADABTC has created a mini-series of lower lows and lower highs as no signs of the recovery to be seen yet. It is almost certain the next battleground is going to be around 0.0000100, where 127.2% Fibonacci support is located. It is a great opportunity for the bears to take some profits off the table, while those bulls looking to enter a long trade can do so, with a stop below the support on a daily basis. Any recovery to the upside will likely run into key resistance area - down slipping trend line, currently located at 0.00001460.

ADA/BTC...Sum it Up...Longerterm play here... Loaded up some bags to Short this...
Jus an idea...NOT Financial Advice...
Longmoney
*Decluttered for your viewing pleasure*

Analytics ADA/BTCThe asset behaves without anomalies, is in its channel, signals for the reversal are not expected. It loses about 20% with about 15 days periodicity.
There is a stable downward channel, so do not open positions earlier than 0.00001210. It is worthwhile to conduct additional analysis in this area, the price may drop to 0.00001080.
In the long term, does not cause much interest, but it can be useful for traders inside the day. We are waiting for the appearance of additional signals.


ADABTC: Check it outHi All,
Hope all your trades are going well
It's all in the chart ADABTC
Be sure to follow me and like this post if it was helpful, and thank you all.
Like the Phoenix we will rise from the ashes
Happy trading People...

ADA - PATTERN CLEAR ON RETRACE Hey Everyone,
I hope you are having a good day trading?
Everything is clear- in hindsight. It seems we have the biggest revelations once we can look back and see what we have done... and this is not any different in trading, we know the pattern on retrace.
It's currently confusing to know right now direction (even for a long term trader) and whether or not the bottom is in. If I compare ALT charts to BTC I would say with conviction that we still have a 5th wave lower to go. But again BTC will only reveal it's pattern on retrace.
Looking at ADA here the 5 wave is currently looking more probable, except for the last rejection wick. So, like all other charts I am seeing right now, we will know more once we retrace and then a decision can be made as to direction.
So keep your trading right now flexible, you need to be reactive and adaptable in this market as nothing is fixed.
REMEMBER IF YOU ARE PRACTICING SAFE... TRADING ALWAYS USE PROTECTION
(minimise your risk, use a stop loss. Especially in Margin Trades) ALWAYS!!!!!!!!!!!!!!!!!!!
<3 Lisa
DISCLAIMER:
The Legal stuff - I'm not financial adviser. Just a few quick thoughts - remember you sit at your computer, you push the buttons...
PS make sure you give me a like, that way you get updates as I post them.... :) <3

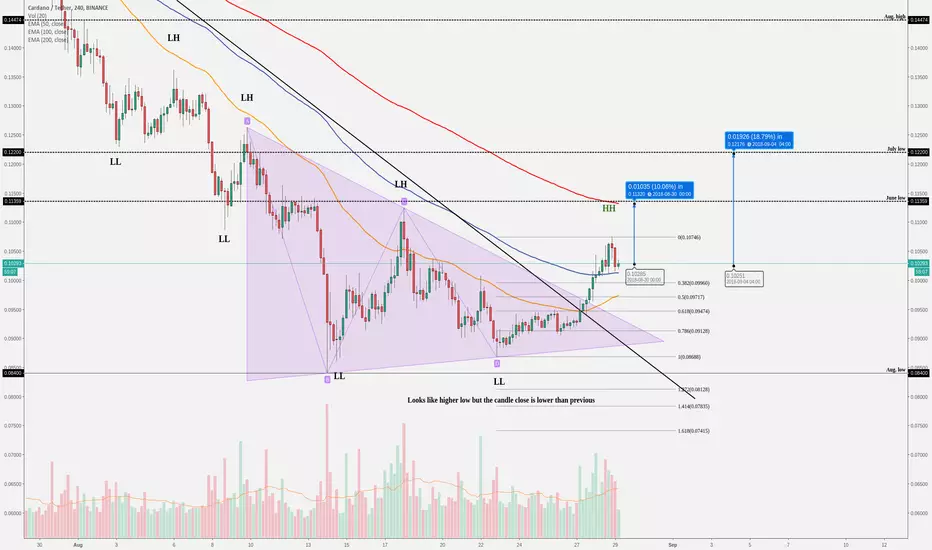
CARDANO (ADA/USD) Shows Some Positive Signs!Over a long time, we can pick up some positive signs from the cryptocurrency market and so as our next analysis - Cardano (ADA)
We have been on the down-Train, yes train, for a very long time but at the moment looks like we have some changes in the market structure.
Around $0.09 area, we have found a bottom what we have tested two times and we can call this a "Double bottom" (W-formation)
After we made a second touch around $0.09 we have a steady climb upwards. Firstly, we break the down-trendline (which is pulled from 02.05.2018 and the second touch 18.07.2018) and we made a breakout from "Descending Triangle". The descending triangle is a bear-ISH pattern but the triangle patterns have a breakout opportunities to either direction and at the moment we made a breakout upwards - bullish sign, and after those breakouts, we made a structure change, we manage to make HH (higher high) on the market!
Currently, You can see that there are two blue target boxes first is above the current price of 10% and the second 18%. So, probably there You can see some price bounce or price stop because those levels are historically worked. First one is June low/support which now becomes a resistance and the second one is the July low which now may become support!
If You want to enter the coin then there is an opportunity if the price falls down a little bit. Like You know we have a breakout from the triangle and the perfect breakout trade would be - breakout and wait for a retest! So, at the moment we could see that we may start to make a pullback because on the 4h chart has formed a three candle candlestick pattern called "Evening Star" (bearish pattern).
Currently looks like the solid spots where to enter the trade are:
$0.1 - criteria: round number, Fibonacci retracement level 38% and supported with EMA's
$0.095 - criteria: it would be close to retest area, perfect Fibonacci retracement level 62%
If You want to read also our thoughts about BITCOIN, then please visit our website - link is on the profile!
Hopefully, it helps You out a little bit to confirm Your own analysis! Definitely make Your own research and if You don't understand some of my points or I miss calculate something then please leave a comment!
Have a nice day!
ADA long still in overall downtrend, other alts are having a bounce as of right now though with cardano being a big player in the space. Definitely going long when horizontal support is touched. as of right now I think we're getting to the bottom of the trend, but who knows. Solid risk to reward ratio.

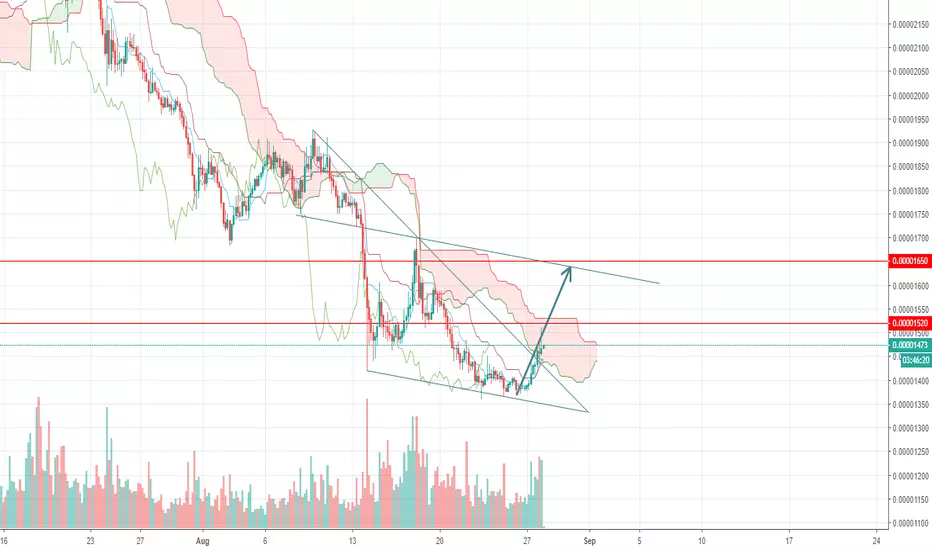
Technical Analytic for #ADA #Cardano (28/08) - CryptoStation#ADA (ADA/BTC)
Buy : 1470
Flash Sell : 1480-1490-1500-1510-1520
Short Sell : 1550-1600-1650
Stop : 1400
Follow me for more signals
Inbox me for more-more signals

Cardano(ADABTC) to continue selling off?Previous post for Cardano (ADABTC) based on its 4hr timeframe made mention of the bullish channel in Cardano (ADABTC) that captured the meandering price action from July 2, 2018.
The 1 hour timeframe of Cardano (ADABTC) is shown in this analysis as opposed to the 4hr in the previous analysis in order to get a better view of price action and the channel.
The horizontal dotted blue lines with price at ~0.00002181 marks the point at which Cardano (ADABTC) closed below the lower line of the bullish channel.
A breakout below the lower line of the bullish channel does imply further bearish action that should see Cardano continue to sell off. A quick and approximate estimate extent of the sell off can be derived by using the width of the channel and subtracting it from the breakout point at ~0.00002181.


ADA created new lows as we anticipatedADA created new lows and is now between support and resistance. We could see a bounce right from the median line to retest the previous support and confirm it's flip to resistance. We have a very small bullish divergence on the MACD but it could get invalidated very easy if we fall a little bit more. Except from the price's reaction to the median line there is no reason to consider buying here. The last line of defense could provide us a good buying opportunity if when the price gets there it's at the intersection with a median line and we also have bullish divergence on MACD and RSI.

Cardano (ADA) Bull div, move up possible. Short ready.Due to the bearish market, altcoins are very easy to predict.
Signals:
Bullish Divergence on the 1 hour for ADA as well as 4 hour, indicating support at the current level.
Cardano has tested support many times, having small bounces each time.
Therefore, we long ADA now with a stop loss below the base of ADA. Once ADA hits the red cloud we close our long and consider a short. If the move up does happen and we break the red cloud, consider another long. For now ADA will likely be trading sideways. If you want to play safe, don't long in this bear market.
Targets:
1783 level (+1%)
Thanks for viewing! Please leave any comments in the box below. I will respond to everything.

Cardano (ADA) Looking for a good short entry, long also possibleCardano has formed a head and shoulders pattern followed by rejection of the trendline and red cloud. If I were looking at the chart alone, I would be shorting, but RSI tells us the rising support at the base, so a long is equally possible. Stoch has room to run too, so at the very least we could be holding the current price.
If this break the white base I believe you should short. I recently got into Bitmex and now I am able to make money in this market way more easily.
Short target at:
1800 satoshi's.
If the long scenario happens, the 1860 level must be broken convincingly for me to go long.
Long target at:
1930 satoshi's
Thanks for viewing! I post all my private charts such as BTC/USD here on tradingview. They can be found in the related ideas. Message me if you would like access to my more recent ones and I will share all the charts with you.

Cardano (ADA) Bullish Pattern, looks to be a strong buyCardano looks very bullish right now, seems to have tested the base with the head and shoulders, now looking to break out for a 5% profit. This is a strong buy in my book, I already entered at 1834 when my limit order was filled. *My stop is 1864, so if the rally fails I can still rebuy at a cheaper price.
Buy in:
On white trendline if breakout fails, which is likely with the bullish divergence. I already bought some just in case, see note above*.
Sell target:
1963 sat level, around 4-8% gain depending on your buy in.
Thanks for viewing! I think this is one of the many good trades available today. Please leave your comments in the section below.

