EUR/CAD My View: BUY!
EURCAD violated a very strong supply cluster this week.
After a long lasting bullish accumulation, bulls finally confirm their presence.
I anticipate a further continuation next week.
Target level - 1.462
Please, support my work with like!
Centered Oscillators

Nike Fails at Potentially Key LevelNike has lagged the broader market this year. Some traders may see an opportunity to push the downside, especially with weak quarterly results and slowing growth in China.
The first pattern on today’s chart is the 200-day simple moving average (SMA), which the footwear stock broke in mid-May. It tried and failed to reclaim it last month – a potential sign of the longer-term trend getting bearish.
In a similar vein, the 50-day SMA is nearing a potential “death cross” below the 200-day SMA.
Next, you have two sets of lower highs. One occurred between early February and early May. The other occurred in the second half of June. Such price action can be indicative of downtrends.
Third, last month’s high was below the $116 area where NKE bounced in mid-March. Has old support become new resistance?
The recent peak additionally brought stochastics to an overbought condition.
Next, the 8-day exponential moving average (EMA) recently crossed below the 21-day EMA. That may suggest the short-term trend is bearish.
Finally, traders may target a price level near the October low of $82.22.
TradeStation has, for decades, advanced the trading industry, providing access to stocks, options, futures and cryptocurrencies. See our Overview for more.
Important Information
TradeStation Securities, Inc., TradeStation Crypto, Inc., and TradeStation Technologies, Inc. are each wholly owned subsidiaries of TradeStation Group, Inc., all operating, and providing products and services, under the TradeStation brand and trademark. TradeStation Crypto, Inc. offers to self-directed investors and traders cryptocurrency brokerage services. It is neither licensed with the SEC or the CFTC nor is it a Member of NFA. When applying for, or purchasing, accounts, subscriptions, products, and services, it is important that you know which company you will be dealing with. Please click here for further important information explaining what this means.
This content is for informational and educational purposes only. This is not a recommendation regarding any investment or investment strategy. Any opinions expressed herein are those of the author and do not represent the views or opinions of TradeStation or any of its affiliates.
Investing involves risks. Past performance, whether actual or indicated by historical tests of strategies, is no guarantee of future performance or success. There is a possibility that you may sustain a loss equal to or greater than your entire investment regardless of which asset class you trade (equities, options, futures, or digital assets); therefore, you should not invest or risk money that you cannot afford to lose. Before trading any asset class, first read the relevant risk disclosure statements on the Important Documents page, found here: www.tradestation.com .

EUR/NZD My Short Signal That I Share With You
I shorted EURNZD.
It is a trend-following trade that is confirmed
by a bearish breakout of key support.
Entry - 1.755
Stop - 1.7633
Target - 1.742
Good luck, guys!

Key Interpretation Methods of CCI IndicatorsHello?
Traders, welcome.
If you "Follow", you can always get new information quickly.
Please also click "Boost".
Have a good day.
-------------------------------------
The CCI indicator, which is included in the 'Strength' indicator, now displays only the oversold or overbought zones.
Accordingly, it seems that there will be difficulties in understanding the indicators, so we took the time to give reinforcement explanations.
The CCI setting I use is 150.
Accordingly, it is utilized to see the flow of the mid-term and above.
The basic source value of CCI is (high + low + close) / 3.
Accordingly, we added the 150 SMA line and the CCI indicator as a secondary indicator.
If it rises a lot from the 150 SMA line, the CCI value rises above +100.
When it rises above +100, it is interpreted as entering the overbought zone.
Entering the overbought zone like this means that there is a possibility that it will exit the overbought zone in the near future.
However, while it is in the overbought zone, it also means that the force to rise is just as strong.
Accordingly, it is the basis for conducting transactions by identifying support and resistance points or sections.
Conversely, if the price drops a lot from the 150 SMA line, the CCI value will fall below -100.
Similarly at this time, when the CCI breaks out of the oversold zone, it enters the sideways zone, providing a basis for trading.
When the CCI is between -100 and +100, prices move sideways.
It is not easy to analyze with only the CCI indicator when it is in the sideways section with the CCI indicator.
Therefore, with the CCI indicator, it is recommended to find the basis for trading when entering and exiting the overbought section (CCI +100) and oversold section (CCI -100).
Since you can check the overbought and oversold sections of the Bollinger bands and CCI shown in this price chart, I think it is a good idea to use it together with the Bollinger bands.
It is quite difficult to create a trading strategy based solely on indicators like these.
Therefore, it is important to create a trading strategy by making sure to set support and resistance points on the price chart and see if the indicators are supported or resisted at those support and resistance points or intervals.
The setting value of Bollinger Bands used in this chart is 60.
-------------------------------------------------- -------------------------------------------
** All descriptions are for reference only and do not guarantee profit or loss in investment.
** Even if you know other people's know-how, it takes a considerable period of time to make it your own.
** This is a chart created with my know-how.
---------------------------------

USD/CAD - Short the Pair Next Week
USDCAD is trading in a long-term bearish trend.
At the end of June, the market started a correctional movement,
after it successfuly completed a bearish impulse.
Analyzing the price action, it feels like the correction is finally over.
I expect a bearish movement next week.
Target Level - 1.3135
Please, support my work with like!

BNBUSDT Short position in updated levelsBNBUSDT is still interacting with the neckline and is about reach the peak of this reaction @ 88.6% Fibonacci retracement key level for adding to shorts.

BNBUSDT right-angled broadening wedgeBNBUSDT is about to fill the corrective a-b-c retrace. After the last target reached, I'm updating this chart with potential targets based on demand zone for the next short position. An impulse wave downward can be expected. Fisher Transform oscillator on 4h-time-frame was added to speculate a price-time correlation.

PERLUSDT Impulse wave reactionPERLUSDT is igniting an impulse wave in reaction as the price bounce inner a broadening structure, in a micro triangle breakout. Fisher Transform bullish crossing is suggesting the direction in time correlation. Aiming 5% upward wave-iii.

GOLD / XAUUSD - I AM BEARISH
Bearish trend will continue on Gold.
The price set a new lower low violating the previous one.
Technical indicators are also bearish.
Goal for sellers now - 1903
Please, like my post!

Dollar Index (DXY) - BUYERS DOMINANCE Remains
Dollar Index will remain bullish next week.
I see a new higher high higher close on an hourly time frame
and a consequent retracement.
After the completion of a local correctional movement,
the Index will grow!
Target level - 103.152
Please, support my work with like!

BNB c-wave failure plus CMF bear divergenceBNBUSDT is heading a potential downward leg to complete iv-wave of this channel. On the 4H chart we can see a strong bearish correlation between the price action and Chaikin Money Flow bearish divergence, in which we have a c-wave failure case. The next demand zone is confluent with the Fibonacci retracement projection.

BTCUSDT Wave B seems to be accomplishedBTCUSDT just made a peak accomplishing the wave B, likely starting a impulse wave inner the next wave C downward. On Chaikin Money Flow we can see a hidden bearish divergence on this daily chart. Overbought condition on ESCGO_LB suggesting that a bearish leg is coming to close the week. I'm expecting a drop to the 20k demand zone region to finish this minor A-B-C zigzag correction phase.

Gold / XAUUSD - Your Best Short Signal
I am quite sure that Gold will drop next week.
I suggest the following short for the market opening.
Stop loss - 1970
Target - 1935
Entry - Market opening level
Good luck!
Please, support my work with like!

BNBUSDT Price, time & divergences.As a update about my current bear position on CZ coin as you can see by the link below.
The price action is heading one leg downward to complete a wave 5 of a contracting ending diagonal, according to the Wave Principle. That seams a breakdown can be expected to the local demand, as we can see clearly on this chart. After broken, the trendline tends to be retested. All my projections are displayed.
Technicals:
* Chaikin Money + 100EMAx100MA cross;
* ESCGO_LB;
This H4 chart is showing a lot of correlations about price, time and divergences on Chaikin Money Flow in in conjunction of 100EMA & 100MA moving averages crossover plus regular and hidden divergences, which is my system I've used to finding turn-points. If in parallel with RSI, is possible to note a lot of divergences that only Chaikin oscillator can display.
* In addition, an ABCD reciprocal (0.886:1.128) projection as an alternative projection.

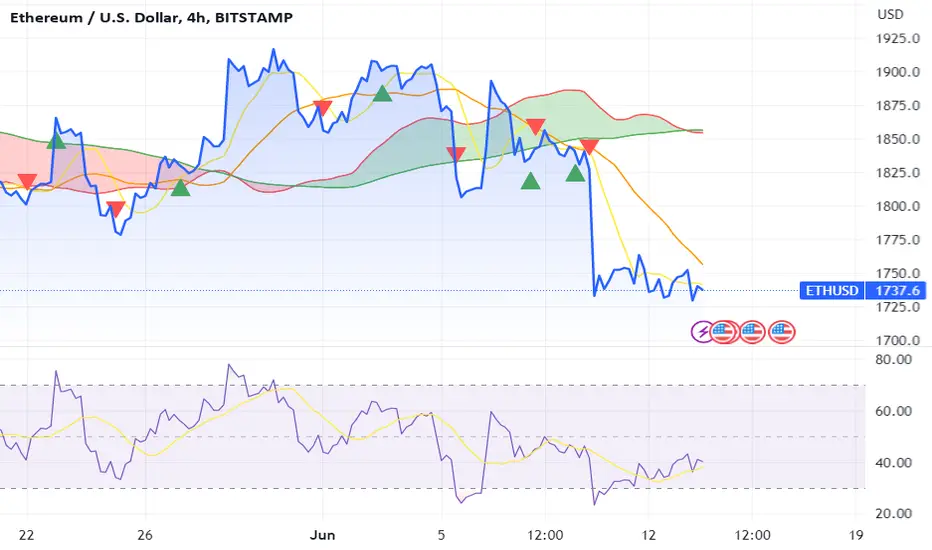
Ether RSI shows short term pop up I wanted to update you on the recent price movements of ETH/USD. Yesterday, the cryptocurrency reached a high of $1,761.96, but today it slipped to an intraday low of $1,727.75. Currently, it moved below a floor at $1,730.
However, bulls have stabilized this support zone, with the RSI finding its floor at 38.00. Currently, the price strength is at 38.81, which is within the oversold region. This could potentially be a positive sign for those looking to buy low.
Please let me know if you have any further questions in the comments.

Will ETH push to $1800 with the current level of RSI?I wanted to share some Ethereum (ETH) trading updates with you. While ETH moved slightly higher, it is still trading below $1,800. In today's session, the price of ETH/USD reached a high of $1,757.89, an improvement from yesterday's low of $1,723.09. The recent surge in price was due to bullish activity at a floor of $1,730, with the RSI bouncing from a floor of its own at 38.00.
Per the daily chart, the current price strength is tracking at 39.33, with the next visible point of resistance being 43.00. If the index moves beyond this ceiling, there is a strong possibility that ETH will climb to $1,800.
I hope this information is helpful to you. If you have any questions or concerns, please do not hesitate to comment in this idea.
Don’t Forget About AlphabetAlphabet has been on the sidelines since a big rally in May. Is it time for traders to think about more upside?
The first pattern on today’s chart is last August’s peak around $122.43. GOOGL chopped on either side of the level for three weeks but has mostly stayed above it. Last Wednesday’s pullback brought prices back to the line and it’s stayed there since. Has old resistance become new support?
Second, stochastics dipped near an oversold condition during the period of consolidation.
Third, GOOGL is near its rising 21-day exponential moving average (EMA). If price stays above that line, it could potentially signal that a bullish trend remains in effect.
Finally, remember that Artificial Intelligence (AI) advances lifted the stock in May. That narrative has continued to play out in other names like Nvidia (NVDA) and Adobe (ADBE). Investors following the movement may see an opportunity in GOOGL now that it’s pulled back.
TradeStation has, for decades, advanced the trading industry, providing access to stocks, options, futures and cryptocurrencies. See our Overview for more.
Important Information
TradeStation Securities, Inc., TradeStation Crypto, Inc., and TradeStation Technologies, Inc. are each wholly owned subsidiaries of TradeStation Group, Inc., all operating, and providing products and services, under the TradeStation brand and trademark. TradeStation Crypto, Inc. offers to self-directed investors and traders cryptocurrency brokerage services. It is neither licensed with the SEC or the CFTC nor is it a Member of NFA. When applying for, or purchasing, accounts, subscriptions, products, and services, it is important that you know which company you will be dealing with. Please click here for further important information explaining what this means.
This content is for informational and educational purposes only. This is not a recommendation regarding any investment or investment strategy. Any opinions expressed herein are those of the author and do not represent the views or opinions of TradeStation or any of its affiliates.
Investing involves risks. Past performance, whether actual or indicated by historical tests of strategies, is no guarantee of future performance or success. There is a possibility that you may sustain a loss equal to or greater than your entire investment regardless of which asset class you trade (equities, options, futures, or digital assets); therefore, you should not invest or risk money that you cannot afford to lose. Before trading any asset class, first read the relevant risk disclosure statements on the Important Documents page, found here: www.tradestation.com .

NZD/USD Technical Analysis & Sentiment! BUY!
NZDUSD had a very bullish market opening.
Even though, we see a correctional movement on intraday time frames,
Daily time frame still remain very bullish.
Before the FOMC the pair will most likely manage to reach 0.618 level.
Please, support my work with like!

BNBUSDT Igniting the most profitable waveBNBUSDT is about to make the most profitable wave for position / swing traders at this actual peak as the price action tends to break-down the ending diagonal, in which the price just complete the final (5th wave) leg. All explained at the chart.

Vertex Pulls Back to Old HighsVertex Pharmaceuticals broke out to new highs last month, and now it’s pulled back.
The first pattern on today’s chart is the price area around $325, near the peaks in December and January. VRTX has dipped to revisit that level. Is old resistance becoming new support?
Second, the drugmaker is attempting to hold the bottom of its Keltner Channel.
Third, some chart matchers may view the recent slide as a completed A-B-C correction. That could make them think the pullback is nearing its end.
Finally, stochastics have slid into oversold territory.
TradeStation has, for decades, advanced the trading industry, providing access to stocks, options, futures and cryptocurrencies. See our Overview for more.
Important Information
TradeStation Securities, Inc., TradeStation Crypto, Inc., and TradeStation Technologies, Inc. are each wholly owned subsidiaries of TradeStation Group, Inc., all operating, and providing products and services, under the TradeStation brand and trademark. TradeStation Crypto, Inc. offers to self-directed investors and traders cryptocurrency brokerage services. It is neither licensed with the SEC or the CFTC nor is it a Member of NFA. When applying for, or purchasing, accounts, subscriptions, products, and services, it is important that you know which company you will be dealing with. Please click here for further important information explaining what this means.
This content is for informational and educational purposes only. This is not a recommendation regarding any investment or investment strategy. Any opinions expressed herein are those of the author and do not represent the views or opinions of TradeStation or any of its affiliates.
Investing involves risks. Past performance, whether actual or indicated by historical tests of strategies, is no guarantee of future performance or success. There is a possibility that you may sustain a loss equal to or greater than your entire investment regardless of which asset class you trade (equities, options, futures, or digital assets); therefore, you should not invest or risk money that you cannot afford to lose. Before trading any asset class, first read the relevant risk disclosure statements on the Important Documents page, found here: www.tradestation.com .

Eli Lilly Finally Pulls BackDrug developer Eli Lilly shot to new highs earlier in the year, and now it’s finally pulled back.
The first pattern on today’s chart is the high-volume bullish candle on May 3. The move followed positive Phase 3 data for donanemab, its potential Alzheimer's disease treatment.
Second, prices are trying to hold the rising 21-day exponential moving average. That may indicate its short-term uptrend remains in effect.
Third, LLY apparently got ahead of itself last week and was unable to hold a new all-time high. But its quick pullback dragged stochastics to an oversold level where some buyers may feel more comfortable with the risk/reward.
TradeStation has, for decades, advanced the trading industry, providing access to stocks, options, futures and cryptocurrencies. See our Overview for more.
Important Information
TradeStation Securities, Inc., TradeStation Crypto, Inc., and TradeStation Technologies, Inc. are each wholly owned subsidiaries of TradeStation Group, Inc., all operating, and providing products and services, under the TradeStation brand and trademark. TradeStation Crypto, Inc. offers to self-directed investors and traders cryptocurrency brokerage services. It is neither licensed with the SEC or the CFTC nor is it a Member of NFA. When applying for, or purchasing, accounts, subscriptions, products, and services, it is important that you know which company you will be dealing with. Please click here for further important information explaining what this means.
This content is for informational and educational purposes only. This is not a recommendation regarding any investment or investment strategy. Any opinions expressed herein are those of the author and do not represent the views or opinions of TradeStation or any of its affiliates.
Investing involves risks. Past performance, whether actual or indicated by historical tests of strategies, is no guarantee of future performance or success. There is a possibility that you may sustain a loss equal to or greater than your entire investment regardless of which asset class you trade (equities, options, futures, or digital assets); therefore, you should not invest or risk money that you cannot afford to lose. Before trading any asset class, first read the relevant risk disclosure statements on the Important Documents page, found here: www.tradestation.com .

Mastering Oscillators In TradingOscillator indicators are technical analysis tools that show the rate at which a particular asset's price or other aspect is changing. Oscillators help traders identify potential trend reversals, trend continuations, and overbought or oversold conditions. These are general strategies that can apply to most oscillators. We would like to cover these in detail so you can ensure that you are using your oscillators to the fullest of their potential.
There are literally thousands of oscillators to choose from on TradingView. All of them probably have a solid use case, but there are a handful of oscillators that have stood the test of time. Those titans of the oscillator category would include the Moving Average Convergence Divergence (MACD), Relative Strength Index (RSI), and Stochastic Oscillator.
1. Trading with Oscillators: Identifying Entry and Exit Points
To use oscillators for trading, traders can look for signals to enter or exit trades. For example, a bullish signal could occur when the indicator crosses above its centerline, indicating that the trend is shifting from bearish to bullish. A bearish signal could occur when the indicator crosses below its centerline, indicating that the trend is shifting from bullish to bearish. Depending on if you are currently in a trade or considering a trade these bullish/bearish signals can be used as either an entry or exit signal.
Traders can also use the momentum of oscillator indicators to identify overbought or oversold conditions. An asset is considered overbought when the oscillator is above a certain threshold, such as 70. Conversely, an asset is considered oversold when an oscillator is below a certain threshold, such as 30. Traders can use these thresholds to identify potential reversal points. Highly overbought can be power areas to look for entry or exit signals.
2. Oscillator Divergences: Confirming Trend Reversals and Continuations
One of the most popular ways oscillators are used is by looking for divergences between the indicator and the price of the asset being analyzed.
For example, a bullish divergence could occur when the price of an asset is making lower lows, but the oscillator is making higher lows. This could be an indication that the trend is about to reverse from bearish to bullish.
Conversely, a bearish divergence could occur when the price of an asset is making higher highs, Oscillator is making lower highs. This could be an indication that the trend is about to reverse from bullish to bearish.
3. Using Oscillators in Combination with Other Technical Indicators
While oscillators can be an incredibly powerful tool on their own, traders can also use them in combination with other technical indicators. For example, traders can use moving averages to confirm oscillator signals. If the oscillator generates a bullish signal and the price of the asset is above its 50-day moving average, it could be a strong indication that the trend is shifting from bearish to bullish.
We see a similar use case in a bearish scenario to follow a trend!
Traders can also use momentum in combination with other oscillators, such as the relative strength index (RSI) or the Stochastic RSI. These indicators provide additional confirmation of momentum signals and can help traders avoid false signals. This is actually one of our favorites as the Stochastic RSI is a measure of the momentum of the RSI. So their respective signals can complement very well.
Putting It All Together
Traders can put this knowledge forward to use most oscillators correctly to adjust their trading strategies and adapt to changing market conditions. We also recommend looking at information the creator of an oscillator has put out in regard to how to properly use the indicator.
Traders can use these strategies to help modify or change their positions. For example, if the chosen oscillator used for an asset is weakening, it could be an indication that the trend is about to reverse. Traders can adjust their strategies accordingly by taking profit from their long positions or entering short positions.
Similarly, if the chosen oscillator for an asset is strengthening, it could be an indication that the trend is about to continue. Traders can adjust their strategies accordingly by adding to their long and short positions or entering new long or short positions.
In conclusion, oscillators are an extremely powerful technical analysis tool that can help traders identify potential trend reversals, trend continuations, and overbought or oversold conditions. By using oscillators in combination with other technical indicators and adjusting their trading strategies to adapt to changing market conditions, traders can improve their trading performance and achieve greater success in the markets.

Exxon Mobil Has Bounced Here BeforeExxon Mobil began the month with a pullback, but now it’s holding a spot that’s offered support before.
The first item on today’s chart is the 200-day simple moving average (SMA). XOM bounced at this long-term trend indicator in September and March. Will buyers defend it again?
Second, you have a rising trendline along the same lows.
Next, XOM appears to have completed an A-B-C correction pattern. That could make some traders feel it’s done pulling back.
Finally, stochastics are rebounding from an oversold condition. (The white arrows show other moments when this helped mark turns.)
TradeStation has, for decades, advanced the trading industry, providing access to stocks, options, futures and cryptocurrencies. See our Overview for more.
Important Information
TradeStation Securities, Inc., TradeStation Crypto, Inc., and TradeStation Technologies, Inc. are each wholly owned subsidiaries of TradeStation Group, Inc., all operating, and providing products and services, under the TradeStation brand and trademark. TradeStation Crypto, Inc. offers to self-directed investors and traders cryptocurrency brokerage services. It is neither licensed with the SEC or the CFTC nor is it a Member of NFA. When applying for, or purchasing, accounts, subscriptions, products, and services, it is important that you know which company you will be dealing with. Please click here for further important information explaining what this means.
This content is for informational and educational purposes only. This is not a recommendation regarding any investment or investment strategy. Any opinions expressed herein are those of the author and do not represent the views or opinions of TradeStation or any of its affiliates.
Investing involves risks. Past performance, whether actual or indicated by historical tests of strategies, is no guarantee of future performance or success. There is a possibility that you may sustain a loss equal to or greater than your entire investment regardless of which asset class you trade (equities, options, futures, or digital assets); therefore, you should not invest or risk money that you cannot afford to lose. Before trading any asset class, first read the relevant risk disclosure statements on the Important Documents page, found here: www.tradestation.com .
