XAU USD : DAILY ANALYSIS (post US election)My last charting was valid for a week and a half so now I’m updating!! I hope this helps you make a million this week ! We are going to watch the market open for selling OR buying opportunities. Expecting gold to retest the floor or quickly break through our double top. After we will test golds major resistance, and key levels within the 1970s to 1980s. We will find a comfy selling position, and break the banks!
MAY THR FORCE BE WITH YOU
CFD


GOLD (XAUUSD): Very Bearish Pattern
Gold is contracting within a descending triangle formation.
with the sequence of lower highs and equal lows, bullish swings become weaker and weaker.
it looks like soon we will see a breakout attempt of the current major daily horizontal support.
in case of a daily violation of that, the price will go to lower structure levels.
next support will be 1800
be prepared and wait for breakout!

XAU/USD UPDATE! go up alreadyWe almost hit the stop loss but price reversed just before we did and we are currently in a profit but we are seeing resistance again at the trendline.. The question is will price break through the trendline and have some sort of recent support before it reverses again or will it hit the SL if price reverses..
Comment your thoughts....


CRUDE OIL (WTI) Technical Outlook
a lot of questions about OIL.
on a daily the price is currently consolidating within a wide horizontal trading range.
41.0 - 41.5 is its resistance
36.1 - 37.0 is its support
while the price within a consolidating range, we expect bullish movements from its support
and bearish from its resistance.
for now, I remain bearish biased.
for intraday trading also consider a falling trend line,
while the market is above that, it serves as the resort for buyers to buy from.
in case of its bearish breakout, it will serve as a local resistance to sell from.
at some moment the consolidation range will be broken either to the upside or to the downside.
daily candle violations of its boundaries will show us the future market direction.

possible move for naturalgas possible move for natural gas.this is so possible move for this cfd. reason market is over extended buy and re test this 38 area and did not break previous high and back. so i think this move go down as mark. lets see the next week. happy trading.stay with me feature info


!! US30 SELL NOW WOLFE WAVE PATTERN !!♦️Pair : DAWOJONES
💢 Vision : Sell
☑️ Entry Point : 28620
💲 Target : 28420 / 28220 / 27950
✖️ Stop Lose : 28820
🔴 Risky Use Small Lot 🔴
⚠️ Reasons To Sell ⚠️
🀄️ Wolfe Wave Pattern
🀄️ Break Out Support Area
❗️ Risk 5%
💠 Reward 15%

big bear divergence on spx500must hold 3150 or we revisit mid 2s again.
covid2.0 coming, lockdown etc...

NAS100TF: 1 Hr
Looking to see how SPX reacts in this area for a intraday trade setup. Might see price breakdown around here, if not look for a break of the trend line to the upside and a retest for a long

Copper (XCUUSD) Bearish Forecast
Copper is retesting a major broken trend line.
currently, the price is trading within an important zone of confluence,
it is based on a horizontal 4h structure, major above-mentioned trend line, and fib.retracements of the last two bearish legs.
chances are high that the price will drop.
target levels:
2.85
2.79

silverleave a comment or a like please if your enjoying my work, and hopefully catching some of these pips. all the best

GERMANY 30 - DAY TRADE VIEWGER30 - Looking good for a selling opportunity , My approach will be a short selling position close to 12770
Maintain stop loss around 12840
Potential downside target 12670 - 12545
Follow the levels as mentioned.
Traders, if you liked this idea hit the like button & write in the comment section.
Why you should follow this tradingview account ?
Managed by top most renowned trader - Pulak Priyesh
10 + years of trading experience
Professional Day trader
Excellence award winning mentor
Professional chart, clear chart without junks.
Major S/R levels with inner insights
Frequent Day & Swing trade levels
All major and minor FX/INDICES covered
Thanks !!

SPX500TF: 8 Hr
Price is heading into the .50 fib retracement and a resistance zone area. Might see some rejection coming up at 3400

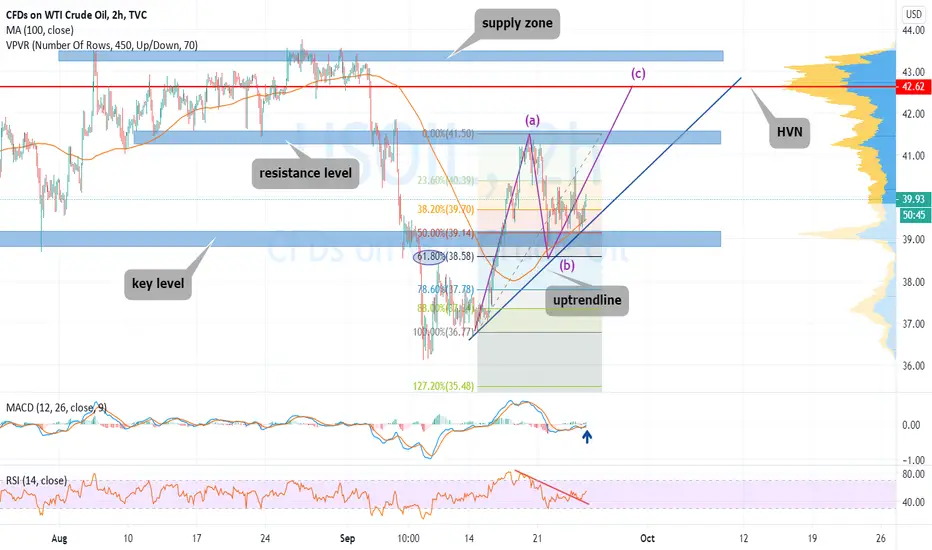
USOIL ANALYSISUSOIL respects uptrendline
Strong bullish wave (a) ended at level 41.50
then corrective bearish wave (b) is rejected from 61.8% Fibonacci level at 38.58
MACD shows bullish momentum
RSI broke downtrendline
It's expected for coming bullish wave (c) to target first resistance level at 41.50
then finally target HVN at level 42.62

GOLD, Where is the next trade...The next possible Buy Zone is above the Support Level.
If the price will approach fast to the level and show a false breakout we can open Buy with low risk.
Share your thoughts if you have another vision.
Dear followers, the best "Thank you" will be your likes and comments!
Before to trade my ideas make your own analysis.
Thanks for your support!

XAU USD - Descending Triangle!Hello Fam!
Short
Reasons:
descending triangle
Good luck to you!
Please consider to put a like to my idea for supporting me & subscribe for more ideas.
Idea is not the financial advice!

XAU USD - Rejection is Coming!Hello Fam!
Short
Reasons:
resistance node is ahead, horizontal resistance and lower support of broken descending channel
Good luck to you!
Please consider to put a like to my idea for supporting me & subscribe for more ideas.
Idea is not the financial advice!

Potential Short for HKXHKDThe FOREXCOM:HKXHKD prices had been consolidating for quite a while and not creating any higher highs (HHs). Yesterday was a good setup to short after the compression was done, but I failed to catch it.
This morning, I saw another good opportunity to short with a condition that the price will close at 24,190 area.
Here is my personal trade opinion :
Sell Stop at 24,190
Stop Loss at 25,000
Take Profit at 23,125
Risk Reward Ratio = 1.35R
Disclaimer :
The analysis above for educational purposes only, I do not responsible for your losses. Please adjust your own lot-sizing according to your appetite.
If you are benefiting from my trade opinion, please buy me coffee .
As always, move your SL when you are in the profit zone.

XAU USD - Head & Shoulders!Hello Fam!
Short
Reasons:
head & shoulders pattern
Good luck to you!
Please consider to put a like to my idea for supporting me & subscribe for more ideas.
Idea is not the financial advice!

NASDAQ ANALYSISNASDAQ broke major uptrendline
Price is in trading range between levels 10960 and 11564
Below SMA 100
Strong bearish wave (a) ended at level 10960
then corrective bullish wave (b) occurred and rejected from 38.2% Fibonacci level at 11534
we r waiting price to break key level at 10960
to open short trade
It's expected forming bearish wave (c) to target support level at 10320
