GOING TO BLUE SKY ZONE, IFB IND...NSE:IFBIND trade at 2150 level. Stocks give a breakout after 7 years. Now ready to trade above all time high level...
Chartanalysis

5 PAISA, READY FOR ALL TIME HIGH...NSE:5PAISA trade at 585 level. You can watch it for its all time high level at 750.

Netflix: Upside Potential!About a year ago, in October 2023, NFLX stock hit a low of $345.87. The uptrend that startet then remains intact and has gained momentum since August this year. After surpassing its record high of $700.99 from November 2021 two months ago, the stock continued to climb and has recently stabilized above the $700 mark. While significant progress has already been made with the turquoise wave 3, we expect a further expansion beyond the $800 hurdle. In the subsequent wave 4, the $700 level should be tested again before the final leg of the larger wave (1) in magenta kicks in. Our alternative scenario (20%), however, anticipates a new low of the turquoise wave alt. 2 below the $345.87 mark.

Meta: Top Placed!In line with our primary assumption, META recently reached the resistance line at $600.27. The upward movement paused at this level, and we now expect a short-term wave C decline, pushing the price below the support at $399. However, we also see an increased likelihood (39%) of a higher high for the green wave alt.(1). This alternative scenario will be quickly triggered if the price breaks above the $600.27 mark


HAL for long term looks good HAL Looks good based on price action it has given trendline breakout and also a trend reversal
You can expect first Target of 5600 and longer term for 1 year and above you can expect 9000 levels

#Silver bearish counter trend opportunityAs seen in the chart, silver has formed a 5-wave bullish impulsive move and has since begun a bearish move, which could be labeled as wave A.
As we know, corrective waves typically occur in three waves. I believe we are nearing the completion of wave B, which could lead to another bearish leg to complete wave C.
This entire 3-wave bearish move could then form wave 2 of 5 on a higher degree.
Therefore, while we might be looking at a short-term bearish move, according to Elliott Wave theory, there is still significant bullish potential in the coming weeks.

#GBPCHF potential reverse head and shoulder patternIn this chart, as you can see, we might be dealing with an inverse head and shoulders pattern. If confirmed, this pattern could lead to higher prices.
However, before taking any positions, it would be prudent to wait for a shift in the lower timeframe market structure toward a bullish trend to ensure stronger confirmation of the move.

BTC 3D AnalysisHere is an analysis for Bitcoin on 3 day time frame. Once it break the down trendline and good retest done we can expect a good profit. Expected targets are given on chart. Can we see this play? Please comment. DYOR. NFA.

Fiserv: Trading Opportunities!Recently, the FI stock surged directly into our green Target Zone (coordinates: $186.40 – $207.40). This year alone, it has gained over 40%. With the recent arrival in our Zone, the time is now ripe for an overarching trend reversal. Because: by hitting our Zone, the price has reached the absolute minimum target for the green wave . From a technical perspective, an immediate trend reversal and a transition into wave II are now possible. At the moment, we place Fiserv in the turquoise wave 3, which should be followed by another dip below our Target Zone. Ultimately, the entire turquoise upward impulse should complete the overarching uptrend of the beige wave I. Thus, our Zone can be used to take profits from existing long positions or to initiate new short trades. Such potential short positions can be hedged with a stop 1% above the 78.60% retracement level (at $207.40).

Misconceptions and Truths about Paper Trading
Hello, traders.
If you "Follow", you can always get new information quickly.
Please click "Boost".
Have a nice day today.
-------------------------------------
TradingView also supports Paper Trading.
For more information, please click the link below. www.tradingview.com
More flexibility: change your Paper Trading account currency :
www.tradingview.com
Even more seamless order design — directly on chart :
www.tradingview.com
---------------------------------------
Paper Trading is thought to support trading practice for beginners.
However, this is a wrong idea.
If you lack prior knowledge about trading or have no concept of trading strategy, you should not do paper trading.
The reason is that the psychological burden is different.
The success or failure of a trade is thought to be the result of trading strategy or response ability, but in reality, it can be said that it is determined by the battle with oneself and psychological state.
This means that psychological state has a significant impact on trading.
Therefore, paper trading should be considered as a transaction that is conducted to confirm one's trading strategy and response strategy after completing chart analysis.
If you have completed some verification of your trading strategy or response strategy, you should continue to conduct actual trading even if you suffer a loss.
The reason is that you should not forget that you can only gain know-how in trading through actual trading.
Therefore, paper trading should not be used to practice mid- to long-term trading, but should be used to verify trading strategies or response strategies for short-term trading or day trading.
In order to do so, you must close the transaction by selling or cutting your loss.
-------------------------------------------
For more information on trading orders in paper trading, please refer to the explanation through the link above.
-
You can proceed with Paper Trading by clicking the Trading Panel at the bottom menu of the TradingView chart.
If you connect to a Paper Trading account, you can start with an initial fund of 100,000.
If the Buy/Sell button is not activated, activate the chart settings to activate the Buy/Sell button before proceeding with the trade.
Right-click on the space in the price candle area to activate the window, and then hover your mouse over the Trade section to check the trading order or trading settings (when you click the Trading menu in the Chart Settings window).
-
In addition, TradingView is linked to a real exchange and supports real trading.
It supports various exchanges, so I recommend you to check if there is an exchange that you are trading on.
-
Have a good time.
Thank you.
--------------------------------------------------

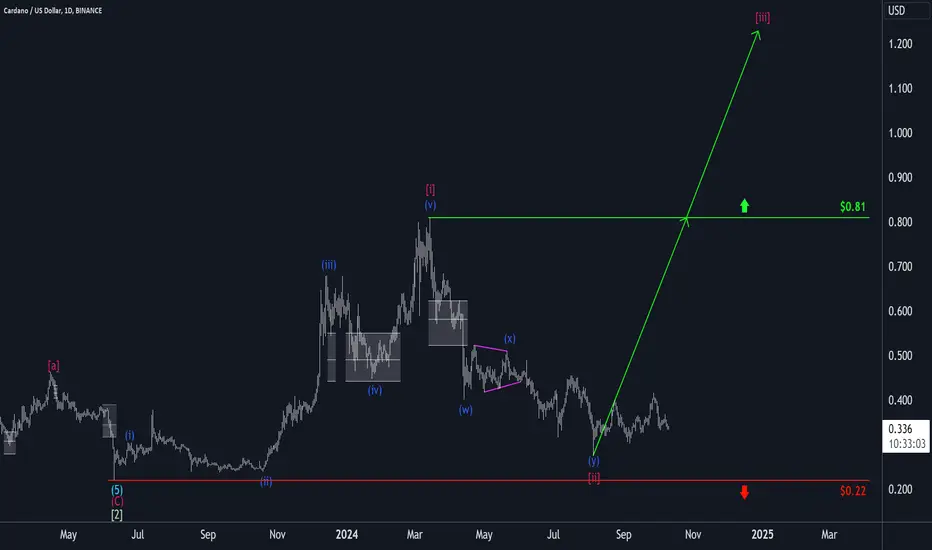
Cardano: SluggishADA has yet to achieve consistent gains. Primarily, we still see it in the magenta wave (iii), which should drive it above the resistance level at $0.81 as it progresses.
POL: Consolidation POL recently moved sideways within our magenta-colored Target Zone (between $0.4711 and $0.3058). We expect a drop below the previous low within this range before the price should place the low of the magenta-colored wave (2). Following this, it should rise above the resistance at $0.60 with the turquoise wave 1. Therefore, traders can open long positions within this range, placing any stops 1% below the lower boundary. If the price falls significantly below the $0.31 mark (42% likely), our alternative scenario will come into play, which anticipates an even lower wave alt.(2) in green.

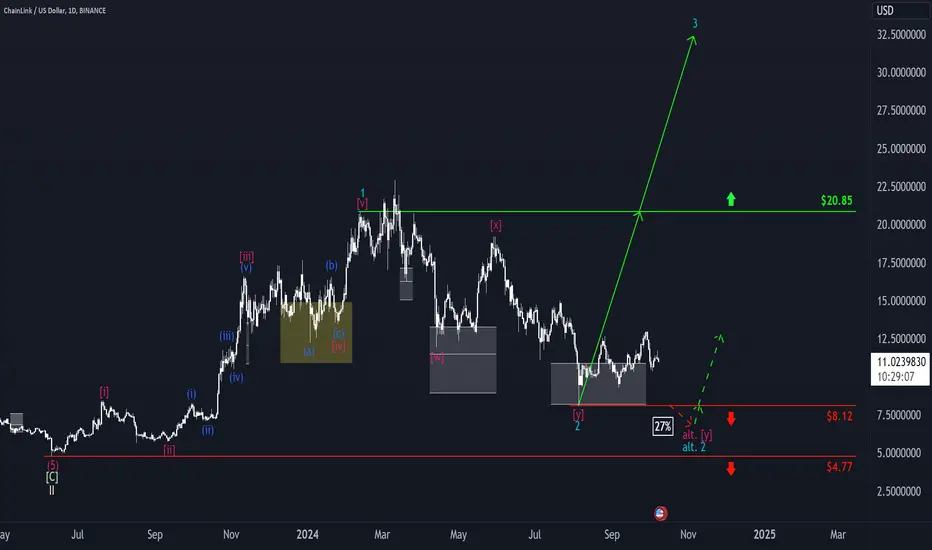
Chainlink: SetbackLINK pulled back significantly over the past seven days. However, we interpret this development primarily as part of the internal substructure of turquoise wave 3 and, therefore, stick to our primary assumption. Moving forward, the price should continue to rise and surpass the resistance at $20.85. However, if the price drops below the support level at $8.12 (probability: 27%), we will have to consider a lower completion for turquoise wave alt.2.
Mahindra and Mahindra next target buy rally?Mahindra and Mahindra takes a first target for harmonic pattern
and take off entry on breaker block
at CMP we can see a FVG also a extreme supply on that area if market breaks extreme supply around 3200 we can expect huge up side rally 3270,3440,also extreme target of 3700
lets be patient to close above supply and take a perfect entry
📌 Please support me with your likes 🤞🏻 and comments 💬 to motivate me to share more analysis with you and share your any opinion about the possible trend of this chart with me !
Best Regards , Davis 🥰
Hit the like 🤞🏻 button to !! Motive some energy !!🥇
📌 Note :
⨻ Check the live market updates and analysis yourself before buy 📈🔺 or sell 📉🔻
⨺ Am not giving any advisory or signals its just my idea for upgrade my knowledge 📚 in trading
⨹ This is my pre and post market analysis to improve my trading journey 🚀
⨂ Am Not suggesting anyone to buy or sell ❌ am just giving my views 👀
⫸ You are responsible for your trading ✅ not me ❌ ⫷
HAPPY TRADING 🥰

MARKET STRUCTURE explained (THE ULTIMATE SIMPLIFIED GUIDE)(In this guide I will attempt for explain Market Structure in the most simplified and easy to understand terms)
WHAT IS MARKET STRUCTURE?
Market structure is the overall framework of a market that helps traders understand price movements and trends. Think of it as the skeleton of the market, showing how prices move over time and where key levels of support and resistance are located.
COMPONENTS OF MARKET STRUCTURE:
TRENDS:
Trends are the general direction in which the market is moving. There are three main types of trends:
- UPTREND: This is when the market is moving upwards. It is characterized by a series of higher highs (HH) and higher lows (HL). Imagine a staircase going up; each step represents a higher high and a higher low.
- HIGHER HIGH (HH): The highest point reached during a price movement before the price starts to fall again.
- HIGHER LOW (HL): The lowest point reached during a price movement before the price starts to rise again.
- DOWNTREND: This is when the market is moving downwards. It is characterized by a series of lower lows (LL) and lower highs (LH). Think of a staircase going down; each step represents a lower low and a lower high.
- LOWER LOW (LL): The lowest point reached during a price movement before the price starts to rise again.
-LOWER HIGH (LH): The highest point reached during a price movement before the price starts to fall again.
- SIDEWAYS/RANGE-BOUND: This is when the market is moving horizontally, neither up nor down. It is characterized by equal highs (EQH) and equal lows (EQL). Picture a flat road; the price moves back and forth within a certain range.
- EQUAL HIGH (EQH): The highest point reached during a price movement that is roughly the - EQUAL LOW (EQL): The lowest point reached during a price movement that is roughly the same as previous lows.
SUPPORT & RESISTANCE LEVELS:
- SUPPORT: A support level is a price point where the market tends to find buying interest, preventing the price from falling further. Think of it as a floor that supports the price.
- RESISTANCE: A resistance level is a price point where the market tends to find selling interest, preventing the price from rising further. Think of it as a ceiling that resists the price.
SWING POINTS:
Swing points are the peaks and troughs that form the structure of the market. They help in identifying the trend direction.
- SWING HIGH: A peak formed when the price reaches a high point and then starts to decline.
- SWING LOW: A trough formed when the price reaches a low point and then starts to rise.
ANALYZING MARKET STRUCTURE:
IDENTIFY THE TREND:
To identify the trend, look at the sequence of highs and lows on the price chart:
- UPTREND: Look for a series of higher highs and higher lows.
- DOWNTREND: Look for a series of lower lows and lower highs.
- SIDEWAYS: Look for equal highs and equal lows.
MARK KEY LEVELS:
Identify and mark significant support and resistance levels on the chart. These levels are where the price has previously reversed or paused.
OBSERVE PRICE ACTION:
Analyze how the price reacts at these key levels. Look for patterns such as:
- BREAKOUTS: When the price moves above a resistance level or below a support level.
- REVERSALS: When the price changes direction after reaching a support or resistance level.
- CONSOLIDATIONS: When the price moves within a narrow range, indicating indecision in the market.
RISK MANAGEMENT:
Always use stop-loss orders to manage risk. Place stop-loss orders:
- Below support levels in an uptrend.
- Above resistance levels in a downtrend.
==================================================================================
This is the basics of Market Structure, explained in the most simplified manner as possible. I hope this publication was simple and easy to understand and helps you understand Market structure better.
I will be doing more easy to understand publications like this within the upcoming days so stay tune...
==================================================================================
HAPPY TRADING :)

Bitcoin: Upward MomentumBitcoin is kicking off the new trading week with a rise, gaining 7% from last Thursday's low. However, we are not convinced that a wave iv low is in place, although it's technically possible. We primarily anticipate a lower low before the rally resumes with the orange wave v.

ICPUSDT - BUY OPPORTUNITY- ICP Update -
ICP is one amazing blockchain, within its ecosystem, it can handle gaming, social, web3, Ai etc
DYOR!!! There's just too much about ICP which you can read up on their webpage.
I am personally buying this coin within BUY area, Holding to target areas and potentially SWING TARGET.
My SWING TARGET for ICP for near future is +$150 - $250, this coin 100% deserves 3 digits at fair value, its one of those coins that is built to handle future web3 projects, its utility is amazing, the transaction speeds are insanely fast, if so, even faster than SOLANA. This coin holds its value and reputation in my opinion amongst SOLANA and ETHEREUM, possibly flip SOLANA in near future!!!
The blockchain is just built for the future, and with recent announcement regarding Ai model integrated within the blockchain, This by far is one solid and positive outlook for the future of this blockchain. As the future technology continues to progress and evolve around Web3 and mass adoption of crypto takes off. This coin will surely (in my opinion) be key player within the Web3 industry as well as Ai !!!
We can only look forward from here and accumulate as much as possible, todays price is a steal for this GEM!!! Todays price will be a history in the future! that is my personal view and outlook! I could be totally wrong, lets wait and see.
If this coin dips before Bitcoin halving, I will look further to add to my moon bag.
Trade Safe Habibis
** Crypto is highly volatile and risky, profits are never guaranteed, only risk what you can afford to lose **

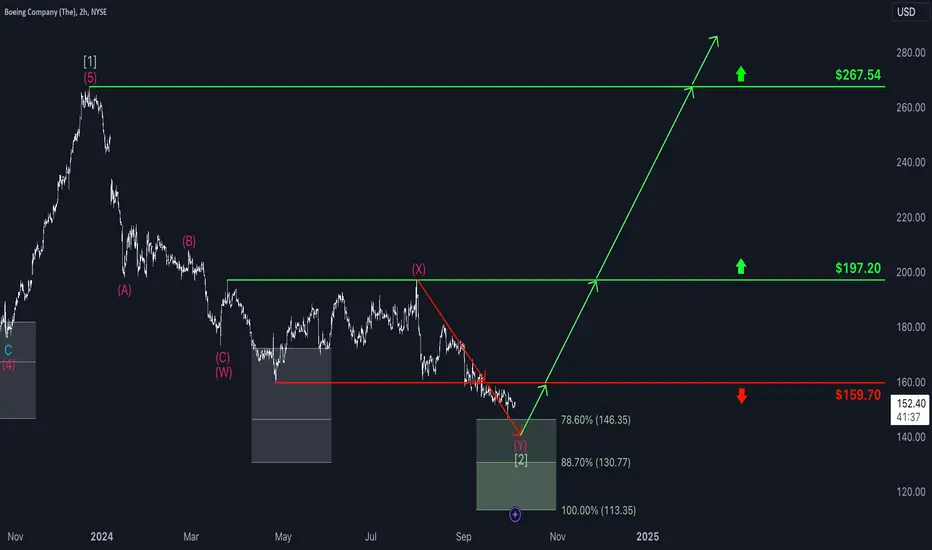
Boeing: Taking Off?Boeing continued its decline recently, moving steadily toward our green Target Zone ($146.35 – $113.35). Just this Tuesday, the price reversed only $0.23 above our Zone. While it’s technically possible that the stock has already established the low for wave (2) in green with this dip, we aren’t convinced. So, we expect another pullback soon, with the stock eventually landing within our Target Zone.
DOT/USDT Long Opportunity: High Risk-Reward Setup!🚀 DOT/USDT is rebounding, and a clear long opportunity is presenting itself! 🔥 I won’t go into too much detail—just check the chart and let me know what you think.

TSM: Entry, Volume, Target, Stop Entry: above 189.33
Volume: above 15.1M
Target: 204.10 area (this is an area, no guarantees, you should be selling on the way up)
Stop: Depending on your risk tolerance; Based on an entry of 189.33, 182.02 gets you 2/1 Reward to Risk Ratio.
This LONG swing trade idea is not trade advice and is strictly based on my ideas and technical analysis. No due diligence or fundamental analysis was performed while evaluating this trade idea. Do not enter a trade based on my idea, do not follow anyone blindly, do your own analysis and due diligence. I am not a professional trader.

Fetch: Home StretchFET has sold off as planned over the last seven days, reinforcing our primary assumption that the final subwave of wave 2 in green is currently unfolding. To catch the low of this movement, we’ve added a green Target Zone onto the chart; it ranges from $1.14 to $0.8810. Investors could enter long positions there, with stops placed about 1% below the lower edge or at the support level of $0.80. Once the low is confirmed, we anticipate a rise above the resistance at $1.73. However, if this level is breached earlier (38% probability), we will already place the coin in the green wave alt. 3.

Bitcoin: Uptober or Rektober?Traditionally, October has been a very bullish month for Bitcoin. However, in its first few hours, this October brought Bitcoin a sharp sell-off of almost 9%. The largest cryptocurrency not only lost the important $65,000 mark within a few minutes, but also temporarily fell back towards $60,000. However, we do not expect this sell-off to end any time soon. After all, we expect a final lower low of the orange wave iv before the same-colored wave v should lead to new all-time highs.

FANG DIAMONDBACK ENERGY, INC.Swing trading potienal
holding period one month
Hi i am swing trader based in india, and i am closely monitoring markets in US
i would love to share swing oppurtunity for u guys
