Ethereum (ETH/USD) Chart AnalysisEthereum (ETH/USD) Chart Analysis
**Trend Overview:**Ethereum (ETH/USD) Chart Analysis
* The chart shows **strong bullish momentum**, with Ethereum maintaining an upward trend of **higher highs and higher lows**.
* The price is currently around **\$3,618**, well above the key moving averages:
* **EMA(7): \$3,610**
* **EMA(21): \$3,539**
* **EMA(50): \$3,419**
**Support Levels:**
* The recent pullback found support at the **\$3,570–\$3,600 zone**, which is now acting as a **key horizontal support**.
* Below this, **EMA 21 (\$3,539)** and **EMA 50 (\$3,419)** offer additional dynamic support zones.
* Marked support areas **S1 and S2** also highlight previous breakout zones that could act as strong demand levels if retested.
**Bullish Outlook:**
* As long as ETH stays **above the support zone**, the bullish trend is likely to continue.
* A bounce from the current level could lead to a **retest of \$3,740**, followed by a move toward the **\$4,000 target** shown by the projected green path on the chart.
**Indicators & Sentiment:**
* Price respecting the EMA lines confirms **strong buyer interest** on pullbacks.
* No visible bearish divergence, and the chart structure favors **trend continuation**.
**Conclusion:**
Ethereum remains in a **bullish structure**, with strong support around \$3,570–\$3,600. As long as it holds above this zone, the next upside targets are \$3,740 and potentially \$4,000. A break below the EMAs would signal weakness, but for now, momentum supports continued gains.
Chartanalysis

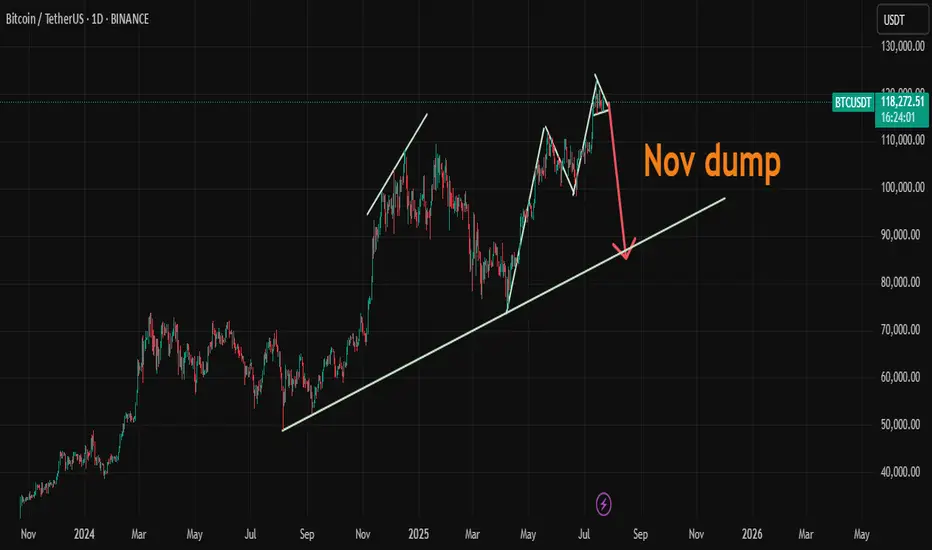
BTC/USDTHello friends, I hope you are well. We should probably expect a slight increase in Bitcoin after the big drop in the financial market, which will most likely start in November. What is your opinion?
XAUUSD Bullish Setup | Liquidity Grab to Breakout📊 XAUUSD Bullish Breakout Plan | Price Action + Key Levels Analysis 🔥
Gold (XAUUSD) is currently holding above a strong support-turned-resistance zone around $3,340 - $3,345. After a clear rejection from the support area and a bullish structure forming, price is showing potential for a clean breakout toward higher targets.
🔍 Key Technical Highlights:
• Support Area: $3,310 - $3,320 held strongly
• Resistance Flip: $3,345 zone acting as new demand
• Target 1: $3,375
• Target 2: $3,390 major liquidity zone
• Structure: Bullish W pattern forming above demand
This setup favors buy on retracement, aiming for breakout above recent highs. Wait for a confirmation candle above resistance before entering.
📈 Watch for liquidity grab and strong bullish impulse.
#XAUUSD #GoldAnalysis #SmartMoney #BreakoutSetup #LiquidityHunt #ForexTrading #TechnicalAnalysis #BuySetup #PriceAction #TradingView #GoldSetup #ForYou

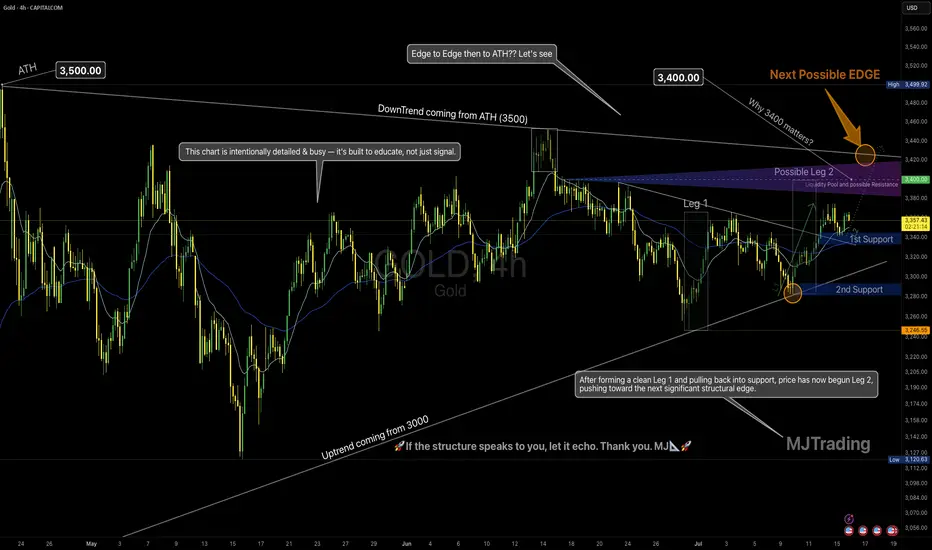
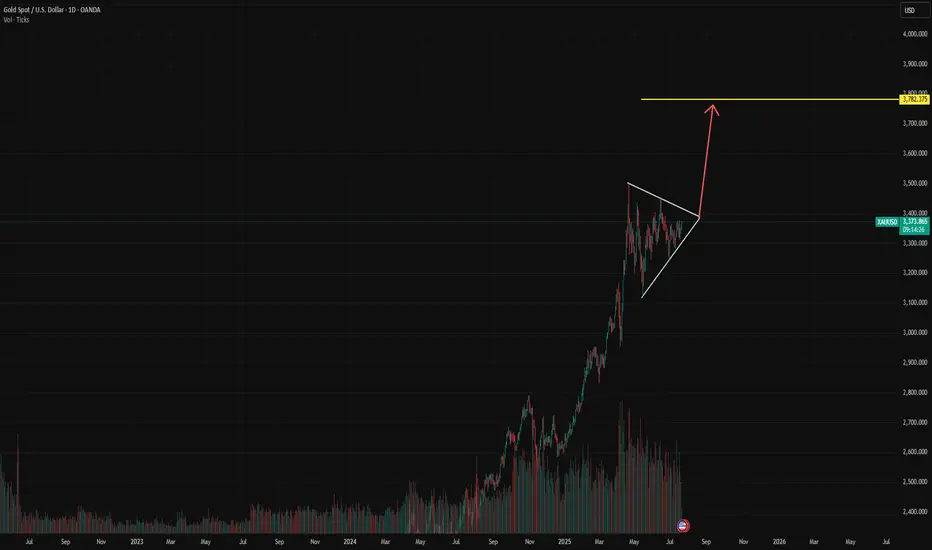
Leg 2 in Progress? | All Eyes on the Possible EDGE around 3400💡 GOLD 4H – MJTrading:
After forming a clean Leg 1 followed by a technical pullback into support, Gold has initiated Leg 2, pushing upward toward the next possible EDGE: 3400.
🟠 Why 3400 Matters
This zone is not just a round number:
It aligns with the long-term downtrend coming from the ATH (3500)
It’s the last reaction high before a deeper correction
There’s likely liquidity resting above — it’s where smart money may make decisions
This is where structure and psychology meet.
And end of 2 possible 2nd leg...
🔄 Possible Scenarios:
🟥 Scenario A – Rejection from the Edge (if could reach):
A reaction from this zone could lead to a pullback toward:
1st Support around 3340-3360
2nd Support near 3250 (also the uptrend line from 3000)
Use these zones to reassess momentum.
🟩 Scenario B – Breakout Above 3400:
A clean break above this structural edge opens the path for:
An “Edge to Edge” move back toward ATH (3500)
Possible higher timeframe trend shift — especially if retest holds
🧠 Our Strategy
We’re long-biased into the edge, not beyond it yet.
Let 3400 show its hand — we stay adaptive, not predictive.
🔍 This chart is intentionally detailed — it's built to educate, not just signal.
Focus on structure, sequence, and behavior — not just levels.
Lets Zoom in around the Breakout area...
And a Zoomout to Daily...
🧭 “If the structure speaks to you, let it echo.”
– MJTrading 🚀
📍#Gold #XAUUSD #TradingView #TechnicalAnalysis #ChartDesigner #MJTrading #MarketStructure #ForexIdeas #Edge
Gold (XAU/USD) Bullish Outlook Based on Price ActionGold (XAU/USD)**, showing a bullish outlook based on price action and support zones.
**Chart Analysis:**
* **Current Price:** \$3,359
* **EMA Signals:**
* EMA 7: \$3,353
* EMA 21: \$3,345
* EMA 50: \$3,341
**Bullish EMA alignment** (short EMAs above long) signals upward momentum.
* **Support Zones:**
* **S1**: \~\$3,345 (strong short-term demand area)
* **S2**: \~\$3,325 (deeper support zone)
* **Volume:** Spikes in green bars signal strong buyer interest near support, especially during the bounce.
* **Projected Move (Green Arrow):**
* A potential retest of the breakout zone (\~\$3,350) could happen before gold targets the **next key resistance** near **\$3,410**.
**Summary:**
Gold broke above a consolidation range supported by EMA alignment and strong volume. As long as the price stays above S1 (\$3,345), the trend remains bullish with upside potential toward \$3,400–\$3,410. A pullback may occur first, offering re-entry opportunities.

Bitcoin (BTC/USD) Technical AnalysisBitcoin (BTC/USD) Technical Analysis – Daily Chart Overview
This chart shows a **bullish continuation setup** for Bitcoin, supported by **EMA structure**, **trendline**, and **support zone** validation. Here's the detailed breakdown:
**1. Trend & Structure**
* **Uptrend:** Price is in a clear uptrend, making higher highs and higher lows.
* **Trendline:** The ascending trendline confirms strong upward momentum. It has been respected multiple times, acting as dynamic support.
**2. Key Support Zones**
* **Recent Breakout Zone (\~\$118,000 – \$119,000):**
Bitcoin broke out above this horizontal resistance and is now **retesting it as support**. This is a classic bullish retest pattern.
* The chart suggests that as long as price holds above this zone, **bullish continuation** is expected.
**3. EMA Indicators (Exponential Moving Averages)**
* **7 EMA (Red) – \$118,386**
* **21 EMA (Blue) – \$114,042**
* **50 EMA (Black) – \$109,483**
All EMAs are **sloping upwards** and aligned in bullish order (7 > 21 > 50), confirming strong upside momentum. The price is currently above all EMAs, which supports a continuation of the bullish trend.
**4. Bullish Target**
* The green arrow suggests a projected bullish move with a potential target above **\$130,000–\$132,500**, assuming price holds the support and resumes upward.
**5. Risk Area**
* If BTC closes **below the highlighted support zone (\~\$118,000)**, it could invalidate the bullish structure temporarily and push toward the next support near **\$114,000–\$115,000**.
**Conclusion**
* **Bias:** Bullish
* **Actionable Insight:**
* As long as BTC remains above the \$118K support zone and trendline, **buy dips** or **hold longs**.
* A clean break and close above recent highs (\~\$121K–\$122K) could open the door toward **\$130K+** targets.

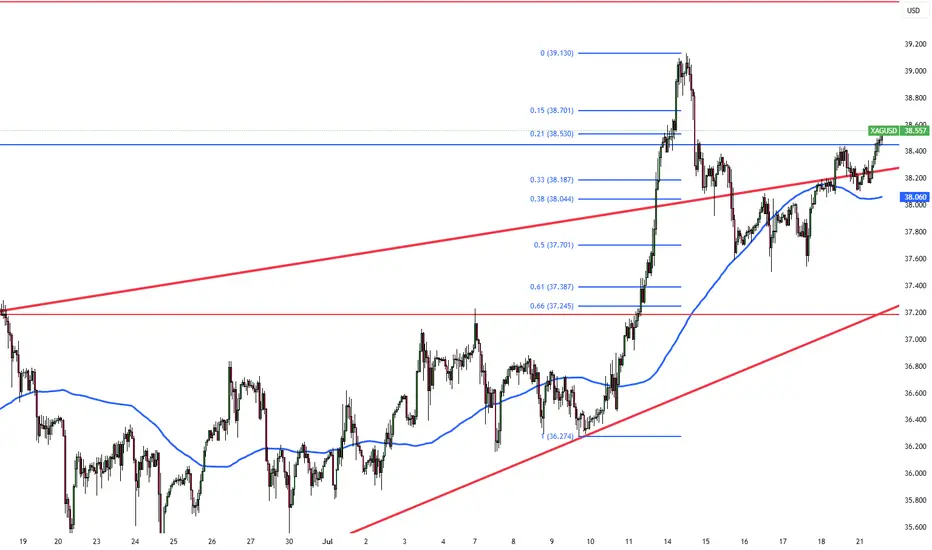
Silver Holds Near $38.40 with Bullish MomentumAs of July 21, 2025, silver (XAG/USD) trades between $38.20 and $38.40, maintaining its upward trend. Key resistance is at $38.50; a break above could lead to $39.10–$40.00. Strong support is at $37.00 and $36.80. The RSI is nearing overbought, suggesting a possible short-term correction.
Upcoming U.S. CPI and PPI data may raise Fed rate cut expectations, supporting silver. Geopolitical risks and U.S. trade policies are supporting safe-haven demand, while strong industrial use in renewable energy and electronics also supports prices. The medium-term outlook remains positive.
Silver faces resistance at 38.50, with higher levels at 39.50 and 40.10. Support is found at 37.20, followed by 36.85 and 35.50.
XAU/USDHello friends, I hope you are well. My analysis for gold is currently bearish, but from August we can surf and make good profits.
Today's GOLD Analysis – Structural Breakout and Bullish Setup🔷 1. Descending Channel – End of Bearish Phase
The chart initially shows Gold trading inside a well-defined descending channel, where price was consistently respecting both upper and lower trendlines. This movement reflected short-term bearish pressure, likely driven by fundamental uncertainty and lower time frame liquidity grabs.
However, the price broke above the channel with a strong bullish candle, which is a clear sign of momentum shift. Breakouts like these usually signify the end of a corrective phase and the beginning of a trend reversal or impulsive leg.
🔷 2. Minor Break of Structure (BOS) – First Confirmation
Following the channel breakout, price broke through a minor structure zone around 3,345–3,350, confirming a short-term change in market direction. This zone, previously acting as resistance, is now functioning as support (noted as “Minor SR - Interchange” on the chart).
This BOS is important because it represents the first break of a lower high in the previous downtrend, which is an early sign that buyers are stepping in with strength.
🔷 3. Retest and Clean Reaction – Support Validated
After breaking structure, the market retraced back into the broken zone, validating it as new support. This is a classic market behavior where price retests previous resistance to gather liquidity before moving higher — a key concept in Smart Money Concepts (SMC).
The bullish rejection from this zone further confirms the validity of the breakout and indicates that institutional buyers may be active in this region.
🔷 4. Current Price Action – Building Momentum
Price is now hovering near 3,355, building bullish structure with a series of higher highs and higher lows. This setup aligns with a continuation move toward the next liquidity target or resistance zone, which is:
✅ Reversal Zone: 3,375–3,380
This zone is marked as the next high-probability area where price might:
Face short-term resistance
Grab liquidity above previous highs
Possibly react with a pullback
The highlighted reversal zone (target: 3,378.23) is crucial because:
It aligns with previous supply
It could act as a decision point for larger time frame traders
It’s where a Major Break of Structure might occur if price breaks and holds above it
🔷 5. Projection & Scenario Planning
Here’s how the next move could play out:
Bullish Scenario: If price maintains support above the 3,350 zone, a rally toward 3,378 is expected. A strong close above this level would shift the larger structure bullish, confirming a major trend reversal.
Bearish Scenario (Short-Term): If price fails to break 3,378, we could see a pullback into the 3,345–3,350 area again. However, as long as this support holds, the bullish bias remains intact.
🔐 Key Technical Concepts Used:
Channel Breakout
Minor BOS & SR Flip
Liquidity Sweep
Reversal Zone (Supply Area)
Trend Structure Shift
📌 Conclusion:
Gold has broken out of its bearish channel and confirmed a short-term bullish structure. The recent breakout and retest give buyers a strong foundation to push toward the 3,378 zone. This is the key reversal area, and the reaction from here will define whether Gold continues to rally or faces a temporary pullback. For now, bulls are in control, and the market structure supports a continuation move.

#Bitcoin LTF update #Bitcoin LTF update
After making a high of $123,300, it dropped a bit and made short-term support at $117,000, and currently it is holding at this level.
But it is not strong enough to hold, we will retest the lower level.
IMO, we can see a retest up to $113,000 level approximately.
Where we have 0.382 golden fibre level, which is also aligning with some more important indicators, and most importantly, we have good numbers of liquidation at that level.
If you find my updates helpful, don’t forget to like and follow for more!
DYOR, NFA

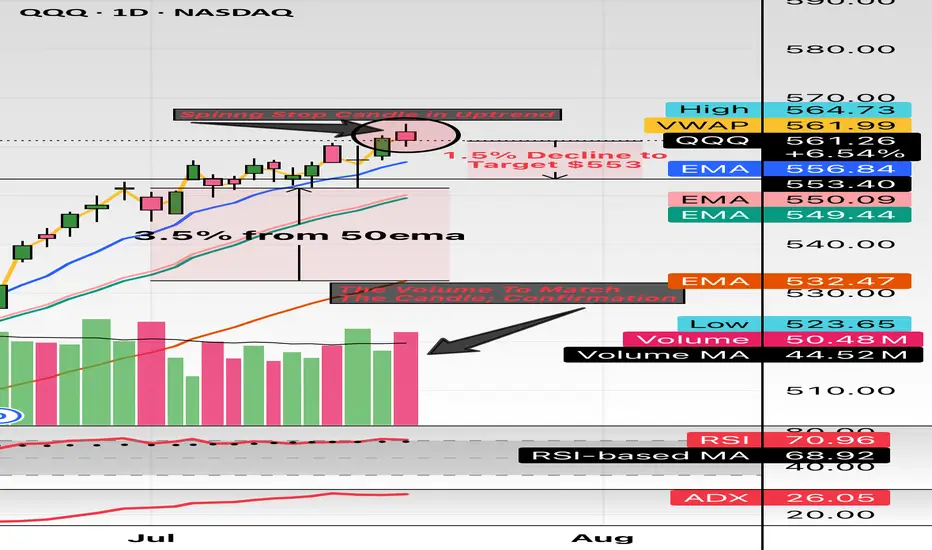
$QQQ this might the spot. Hello and good night, evening, afternoon, or morning wherever you may be. I have been looking at names all day and I wanted to check the indexes: NASDAQ:QQQ and $SPY.
Here we have the indexes up almost 30% from the April lows and sitting about 10% YTD. The candle highlighted is the spinning stop candle and has volume to match. These candles usually take place (green or red) in downtrends or uptrends and provide pivotal indication. The market has major earnings this week (07/21/2025 to 07/25/2025) with names like Google, Tesla, General Dynamics, Verizon, Domino’s And so forth.
This week could be a catalyst to see some great volatility. I believe staying 3% from moving averages so I have noted 3.5% from the 50EMA and revisiting the 20EMA and 21EMA in the low $550 area. My target is $553 which is only a 1.4% move which can happen in one session in this environment while staying 3.5% above the 50EMA.
My trade idea will be $553p for 07/25/2025. Good luck!
WSL
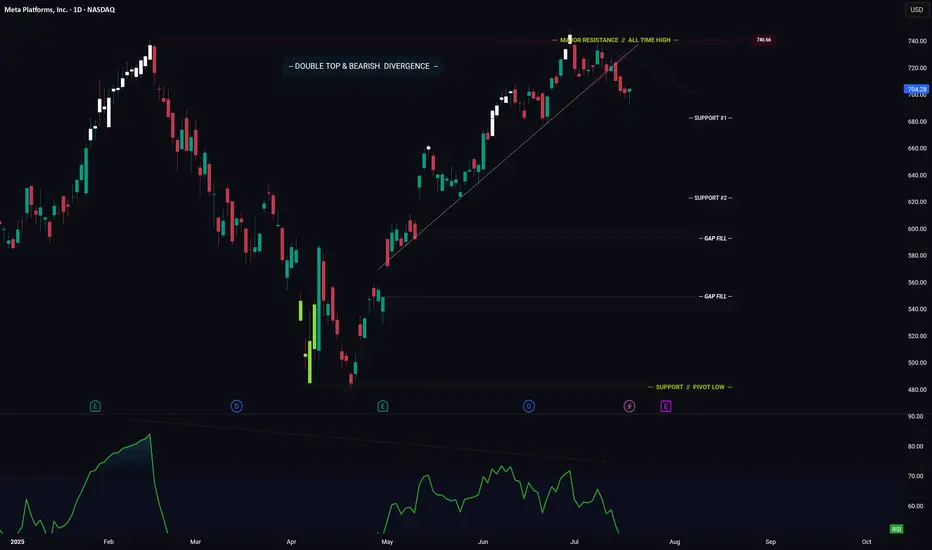
META -- Breakdown? Or Move Higher? Levels To Watch ForHello Traders!
Meta has broken down from its ascending trendline. This is bearish.
In addition price has formed a major Double Top pattern with Bearish Divergence.
Bearish Factors
1) Breakdown of ascending trendline
2) Double top
3) Bearish divergence
Two things need to happen if META is going to make a move higher...
1) Price needs to stay above "Support #1"
2) Price needs to break above the descending trendline (connecting the range highs)
IF price does breaks lower... where do we start looking for long positions?
- Support #2 is a great starting point, however if price makes it to support #2, then I could also see price trading down to fill the gap just below.
- This is where you could enter again to average down your position.
Thanks everyone and best of luck on your trading journey!
BTC/USD Fake out before Pump | Bullish Flag formationBTC/USDT (1D) Market Outlook – July 1, 2025
Introduction
BTC is currently consolidating within a bullish flag pattern after printing a swing high at 108.9K and a recent swing low at 98K. The price sits just below a major supply zone.
Context 1: Key Zones
Supply: 104.6K – 112.1K
Demand: 74.4K – 82.5K
Fair Value Gaps (FVG): 3 zones below price, with one near 88–90K
Context 2: Technical Confluence
Liquidation Zone: 106.2K
Golden Pocket (Fib 0.618): 102.1K
Psychological Levels: 105K and 110K
Context 3: Market Structure
Pattern: Bullish flag
Trend (LTF): Sideways/consolidation
Volume Profile: Heavy activity near 105K–110K
Bullish Scenario
Breaks above 106.2K (liq zone)
Pulls back to 102.1K (golden pocket), forms higher low
Retests resistance for continuation
Alt scenario: clean breakout above resistance → ATH retest
Bearish Scenario
Breaks below 106.2K and flag support
Fills FVG, breaks prior low at 98K
Triggers macro downtrend toward 88–90K zone
Summary
BTC is at a decision point inside a bullish flag, facing supply. A break above 106.2K favors upside continuation, while rejection and a lower low could trigger a deeper retracement. Watch key levels closely.

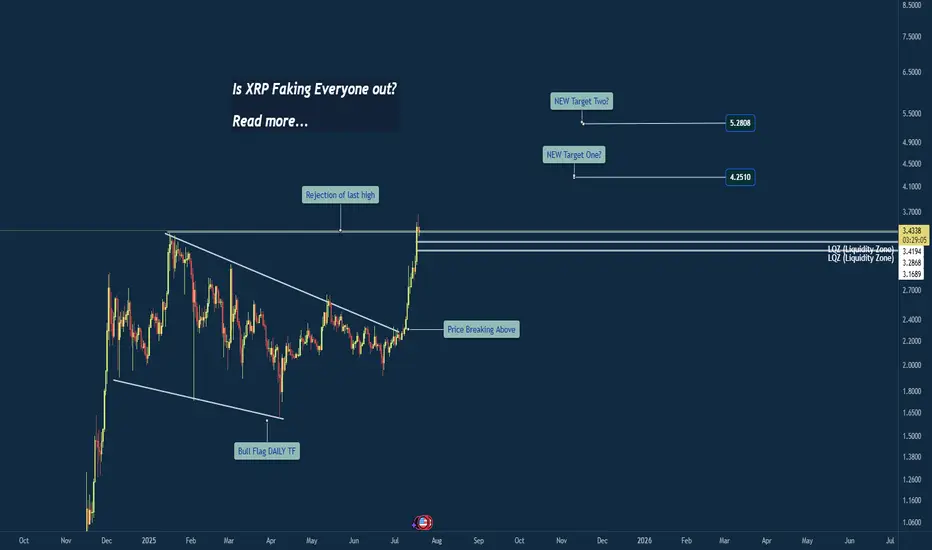
Breakout or Bull Trap? XRP at Critical Weekly LevelWeekly Chart Insight: XRP Closing Above Previous High
XRP has just closed above its previous weekly high—a significant development that could signal a shift in market sentiment. Historically, when price closes above such a critical level on the weekly timeframe, it often leads to continuation, unless a sharp rejection quickly follows.
At this stage, the focus shifts to the 4-hour timeframe for confirmation. An impulsive move above the current consolidation zone could indicate that this breakout is legitimate, potentially leading to another bullish weekly candle.
However, caution is warranted. If the next two daily candles close weakly or fail to maintain structure above the breakout level, it could hint at a fakeout or liquidity grab before a deeper correction.
My Current Bias:
I remain neutral-to-bullish, contingent on:
An impulsive continuation on the 4HR
Strong daily closes above the key range
Price not falling back and closing below the weekly breakout level
If price begins to consolidate and hold this level, that would reinforce the bullish case. But if we see immediate selling pressure and a re-entrance below the breakout, I’ll reconsider the bias based on developing structure.
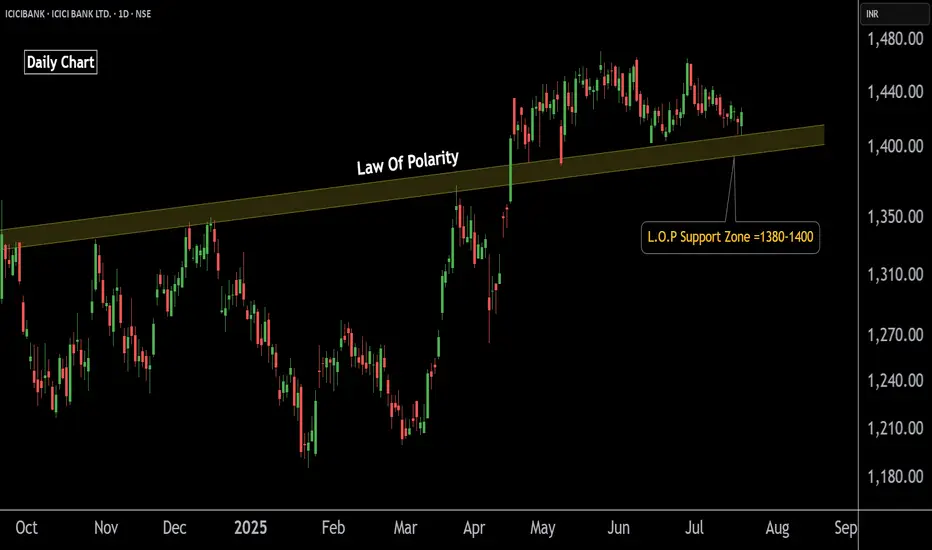
ICICI Bank Poised for Upside – Buy OpportunityThis is the daily chart of ICICIBANK.
ICICIBANK having a good law of polarity at 1380-1400 level .
If this level is sustain then we may see higher prices in ICICIBANK.
Thank You !!
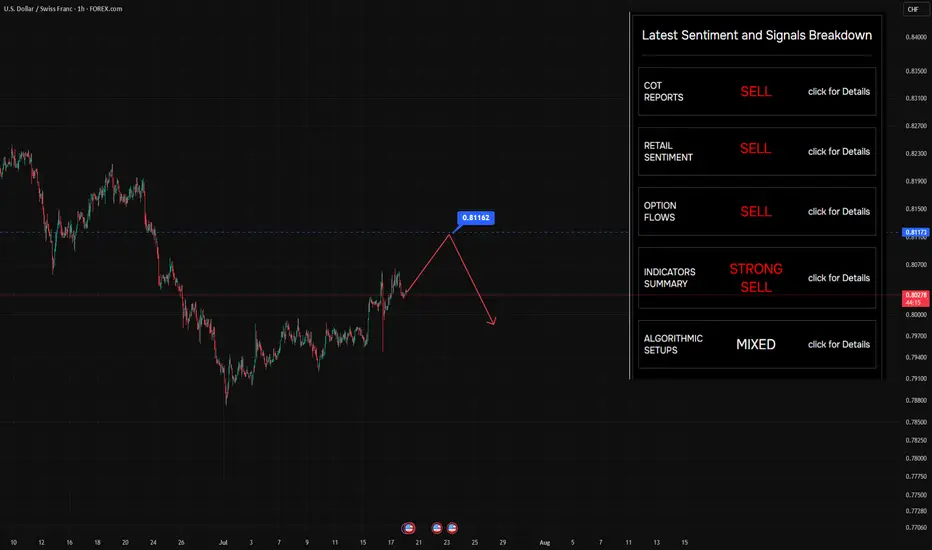
Still looking to sell on rallies — nothing’s changedStill looking to sell on rallies — nothing’s changed. The level on the chart? That’s where buyers jumped in before. Makes sense to target it again.
So… why do we say there are "suffering buyers" at this level?
Let’s rewind a bit (see Chart #2) and imagine price at the point marked on the chart.
At that moment, price had clearly returned to a visible local level — 0.8123 — a zone that naturally attracted traders to jump in on the fly , or triggered limit orders .
But here’s what happened next:
Selling pressure overpowered buying interest — and price moved swiftly lower .
That’s when those buyers got caught.
That’s when the pain started.
🔍 What Makes This Level Special?
Broker data from open sources confirms that open positions are still sitting at this level — meaning a lot of traders are underwater, hoping for a recovery that may never come.
It’s not just technical structure.
It’s crowded sentiment , failed expectations , and trapped capital — all wrapped into one.
🧠 This is what we call a "suffering trader" zone — and it often becomes a magnet for future selling .
📌 Follow along for more breakdowns on flow, positioning, and market sentiment .
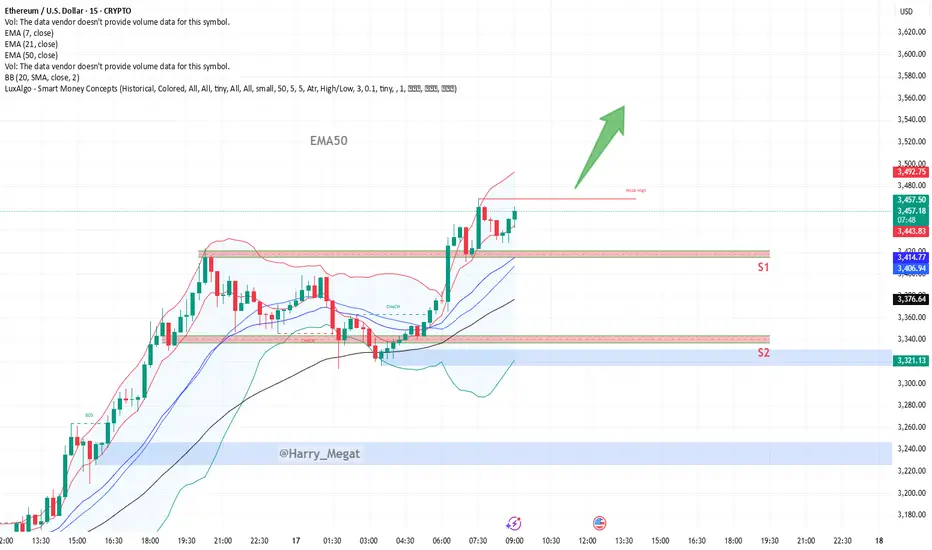
Technical **chart analysis** for ETH/USDTechnical **chart analysis** for **ETH/USD** based on (15-min timeframe) :
Bullish Outlook**
* **Price Action**: Ethereum is consolidating just above previous resistance (\~\$3,440) after a breakout from the range.
* **Current Price**: \~\$3,446
* **EMA Support**:
* EMA 7: \$3,441 (price holding above)
* EMA 21: \$3,413
* EMA 50: \$3,376 (strong dynamic support)
Key Levels**
* **Resistance Broken**: Former resistance zone (\~\$3,415–\$3,440) now acting as support.
* **S1 Support Zone**: \$3,415–\$3,440 (ideal retest zone for long entries)
* **S2 Support Zone**: \$3,335–\$3,350 (next demand zone if S1 fails)
Analysis Summary**
* **Trend**: Bullish momentum is intact above EMA cluster.
* **Setup**: Retest of breakout zone successful → price stabilizing above EMA7.
* **Target Area**: If momentum continues, next target zone could be \$3,500–\$3,560 (as shown by green arrow).
* **Invalidation**: Drop below \$3,413 (EMA21) and especially \$3,376 (EMA50) would weaken the bullish structure.
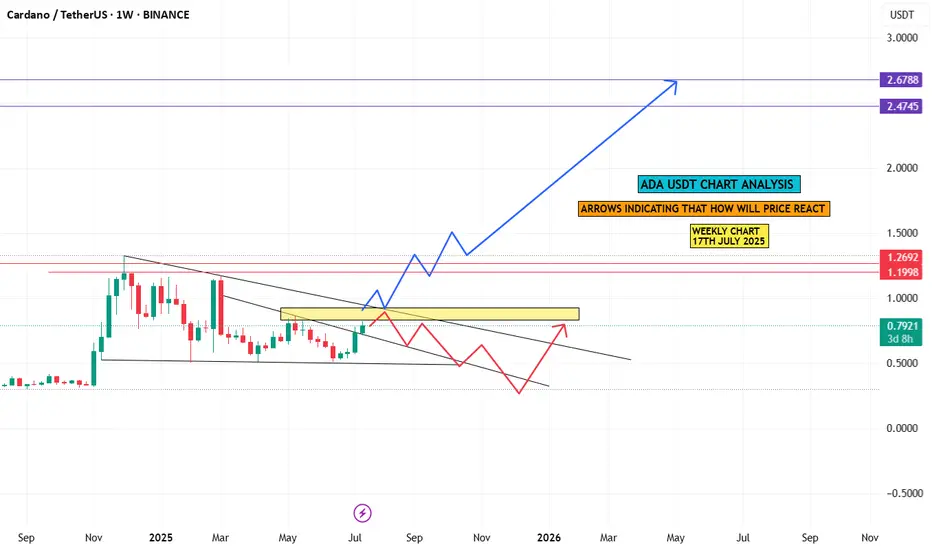
ada chart analysiscardano weekly chart analysis n arrows indicating that how will price react in upcoming
days or months,
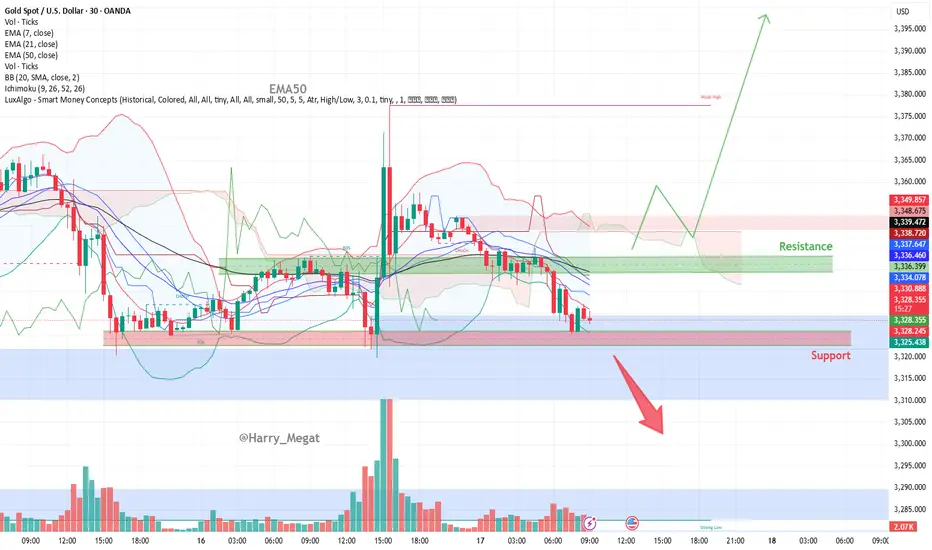
Gold (XAU/USD) Setup based on 30-minute chartGold (XAU/USD) Setup based on 30-minute chart
**Bullish Scenario**
* **Support Held**: Price is currently testing a key horizontal support zone (\~\$3,320–\$3,327), which has held multiple times in the past.
* **Potential Reversal**: If price forms a bullish candlestick pattern here (e.g., bullish engulfing, hammer), we may see a rebound.
* **Upside Target**:
* **First Resistance**: \$3,345–\$3,350 (green zone)
* **Further Target**: \$3,380–\$3,400 if momentum continues
**Confirmation Triggers**:
* Bullish price action from support zone
* Break above EMA 7 / EMA 21 (\~\$3,330–\$3,336)
* Increasing volume on green candles
**Bearish Scenario**
* **Breakdown Threat**: Price is hovering near support; if it breaks below \$3,320 with volume, downside pressure may intensify.
* **Next Support Levels**:
* \$3,310 (minor)
* \$3,285–\$3,275 (major support)
**Bearish Triggers**:
* Clear break and close below \$3,320
* EMA crossover (short-term below long-term)
* Rising red volume bars
Summary
| Direction | Conditions | Targets |
| ---------- | --------------------------------------------------- | ------------------------- |
| Bullish | Hold above \$3,320 + breakout above \$3,336 (EMA50) | \$3,350 → \$3,380–\$3,400 |
| Bearish | Break below \$3,320 support | \$3,310 → \$3,285 |
EUR/USD Technical Outlook Daily chart frame**EUR/USD has bounced from the S1 zone (\~1.1595–1.1575)**, chart analysis
**EUR/USD Technical Outlook**
**Current Price:** \~1.1618
**Recent Action:** Rejection from S1 zone, forming a potential base.
**Bullish Scenario (Active)**
The pair has bounced from key **S1 support** (1.1595 area), suggesting demand is present.
**If momentum holds:**
* **Immediate Target 1:** 1.1645 (Fibonacci + 21 EMA)
* **Target 2:** 1.1665–1.1685 zone (7 EMA + minor resistance)
* **Target 3:** 1.1725 (R1 zone and mid-July resistance)
* Breakout above R1 would shift momentum firmly bullish.
*Watch for bullish continuation candles and rising volume.*
**Bearish Risk (Still Possible)**
* If the bounce stalls near **1.1645–1.1665**, and the pair reverses:
* A drop back toward **1.1595–1.1575** support could occur again.
* Break below that zone would expose:
* **S2 support at 1.1510**
* Possibly extend to **1.1475** in case of stronger USD demand
Summary:
* **Bounce from S1** shows initial bullish strength.
* **Key resistance to break:** 1.1645–1.1685 for bullish continuation.
* **Key support to hold:** 1.1595–1.1575 to avoid deeper correction.

DXY Bullish Pennant (awaiting breakout)**1-hour timeframe** of the **US Dollar Index (DXY)** with technical analysis applied. Here's the breakdown:
**Technical Analysis Summary:**
**Current Price:**
* Around **98.08**, trading just under the **7 EMA (98.09)**.
**Bullish Structure:**
* A strong **bullish impulse leg** is visible (sharp green candle rally).
* Followed by a **bullish flag/pennant** pattern (marked in red), which is typically a **continuation pattern** in an uptrend.
* The flag is forming after a steep upward move — suggesting **consolidation before potential breakout continuation**.
**EMA Trend Support:**
* **EMA 7, 21, and 50** are aligned bullishly:
* EMA 7 > EMA 21 > EMA 50
* This supports the **short-term uptrend** structure.
**Support Zones:**
* A strong **demand zone** is marked between **97.50–97.70** (highlighted in red), where price previously consolidated before the breakout.
* EMA 50 also sits around **97.72**, reinforcing this as a strong **pullback support level**.
**Possible Scenarios:**
1. **Bullish Continuation:**
* If the price breaks above the flag resistance, it may **rally towards 98.70 → 99.00 → 99.10**.
2. **Bullish Pullback:**
* If price dips to retest the support near **97.80–97.90** or EMA 21, and holds, it may bounce and continue upward.
**Conclusion:**
* **Trend:** Bullish
* **Pattern:** Bullish Pennant (awaiting breakout)
* **Support:** 97.72–97.90
* **Upside Targets:** 98.70 → 99.00+
* **Outlook:** Positive bias continues **as long as price holds above the support zone** and EMAs.

Exide Industries Ready for the Next Bull Run !! Powering Up !!there are two chart of Exide Industries.
In a first chart: EXIDEIND is moving in a well defined parallel channel and currently trading near at support 365-375 range
In the second chart,EXIDEIND is respecting support at both the monthly pivot and the supertrend indicator, with the support zone positioned between ₹365-₹370.
EXIDEIND is currently sustaining below both the monthly and weekly pivot levels at ₹290. As long as the stock does not break above this pivot zone, the momentum is expected to remain weak.
If this level is suatin then ,we may see higher prices in EXIDEIND.
Thank you !!

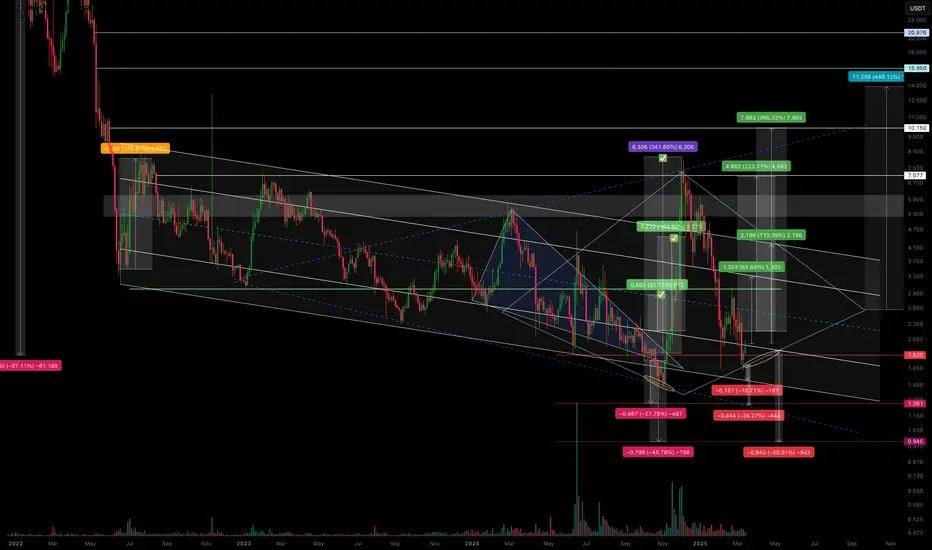
CVX/USDT – Is the scenario repeating? Continuing to work.The previous trading idea has played out with 3 out of 4 marked zones reached.
We saw a false breakout from the descending channel, followed by a pullback in line with the overall market—returning to the channel’s support zone.
I’ve noticed a potential formation of either a diamond pattern or an expanding triangle, but we’ll see how it plays out further.
Regarding declines and support zones:
-10.71% drop to the support of the descending channel.
-26.27% drop to the anticipated support of the expanding triangle.
-50% drop, likely as a squeeze under extremely negative news.
Regarding growth and resistance zones:
+65% rise to the resistance of the internal channel.
+110% rise to the resistance of the external channel (and if a diamond pattern forms, then its boundary).
+246% rise as a second attempt to break out of the descending channel.
+440% rise as a potential realization of diamond pattern pricing (if it forms).
All of this should be factored into your trading strategy, even the less likely scenarios.
I'll share the execution of the previous trading idea in my TG. I've also marked it on the chart.