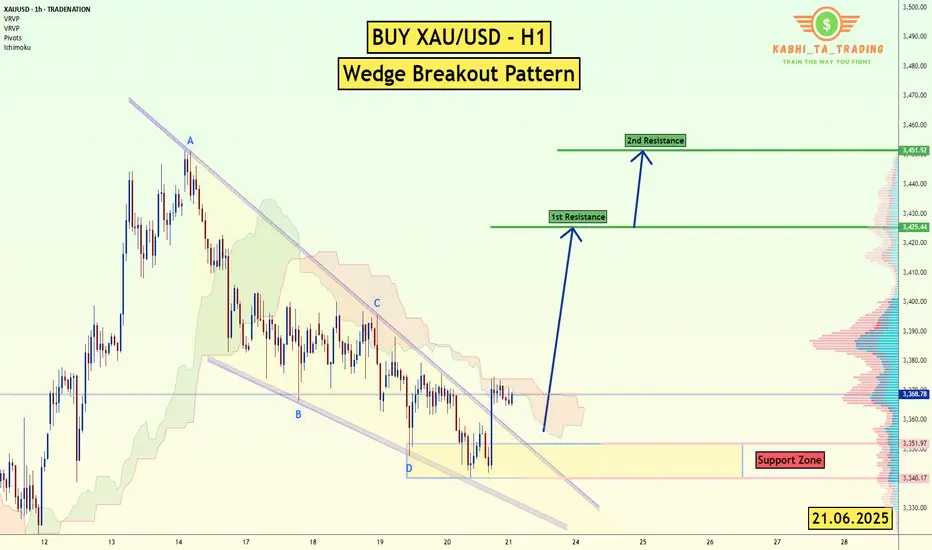
XAU/USD (Gold) - H1 - Wedge Breakout (21.06.2025)The XAU/USD pair on the H1 timeframe presents a Potential Buying Opportunity due to a recent Formation of a Wedge Breakout Pattern. This suggests a shift in momentum towards the upside and a higher likelihood of further advances in the coming Days.
Possible Long Trade:
Entry: Consider Entering A Long Position around Trendline Of The Pattern.
Target Levels:
1st Resistance – 3425
2nd Resistance – 3451
🎁 Please hit the like button and
🎁 Leave a comment to support for My Post !
Your likes and comments are incredibly motivating and will encourage me to share more analysis with you.
Best Regards, KABHI_TA_TRADING
Thank you.
Disclosure: I am part of Trade Nation's Influencer program and receive a monthly fee for using their TradingView charts in my analysis.
Chart Patterns
Tesla update, watch 343 level!boost and follow for more ❤️🔥 tsla broke the trend support mentioned in my last analysis, doesn't surprise me too much I did mention it was likely, now look for a daily close above 343, if we can get that then the rally to and past 400+ will come in the blink of an eye 🎯👁️
that is all, I am done posting for today.. I hope you all have a great weekend! stay safe and see you soon ⚡✌️

GOLD DAILY CHART UPDATEHey Everyone,
Great finish to the week across all our multi timeframe analysis.
We updated our 1H chart throughout the week catching the buys from the dips using our levels and ema5 cross and lock allowed us to track the movement with confirmation.
This is now an end of week update on our daily chart idea. This chart shows our perfect play into the channel top and then rejection for the movement down. We used our smaller timeframe charts to catch the bounces from this movement down.
Following up on our previous analysis, price action has continued to respect our Goldturn channel beautifully. The key takeaway here is that the channel levels are being respected with precision, validating the strength and reliability of our Goldturn channel framework.
We’ll be back now on Sunday with our multi-timeframe analysis and trading plans for the week ahead. Thanks again for all your likes, comments, and follows.
Wishing you all a fantastic weekend!!
Mr Gold
GoldViewFX

HelenP. I Euro will break resistance level and continue to fallHi folks today I'm prepared for you Euro analytics. On this chart, we can see how price initially moved inside a triangle formation, forming higher lows from the trend line and testing the resistance zone multiple times. Eventually, price broke out to the downside, falling sharply and breaking through the lower boundary of the triangle and also the trend line, signaling a shift in market sentiment. After touching the support zone and forming a temporary bottom, the pair started climbing back up, but this movement was more of a correction than a trend reversal. Price respected the trend line from below and followed it upward, but failed to break significantly higher. It managed to push above both support 2 and support 1 levels, which now act as resistance. Currently, EURUSD is trading inside the resistance zone, where previous reactions have led to strong bearish impulses. Given this behavior and the recent false breakout, I expect the price to rebound from this area and break back below support. My goal is set at 1.1350, anticipating further downside movement as the bearish structure remains valid. If you like my analytics you may support me with your like/comment ❤️
Disclaimer: As part of ThinkMarkets’ Influencer Program, I am sponsored to share and publish their charts in my analysis.

BITCOIN → Possibility of retesting 100K. Buyer weakeningBINANCE:BTCUSDT.P is in consolidation after the rally stalled due to the exhaustion of the bullish driver. The price updates local lows and starts looking at 100K
Bitcoin is under pressure after the escalation of conflict in the middle east and after the FOMC speech. There is also another observation: large companies, politicians, funds and investors have long and aggressively motivate the crowd to buy, verbally confirming that they bought dozens and hundreds of bitcoins at a time for the balance, but bitcoin is standing still and updating lows. At the same time, various services such as "cryptorank" fix bullish sentiment at the lows. The market either lacks liquidity or something more unpredictable is happening (chart drawing????)
Technically, bitcoin is following the behavior of the SP500 quite strongly, which closes Friday's session quite weak and close to key support, which could trigger a continuation of the decline. Bitcoin won't stay on the sidelines and could also follow the index....
Resistance levels: 104K, 105K, 106K
Support levels: 102K, 100.6K, 97.5K
The price is coming out of the “symmetrical triangle” consolidation breaking the support, thus confirming the bearish mood. After a small correction after a false breakdown of 102500 the price may again return to storm (retest) the level under market pressure, which will only strengthen expectations of further decline. The target is liquidity 100600 - 100K. From 100K rebound and growth is possible.
Regards R. Linda!

Gold may exit from pennant and rise to resistance levelHello traders, I want share with you my opinion about Gold. The price previously made a strong impulse upward, forming a downward pennant, but this move lost steam after touching the seller zone around 3430 - 3440. From there, the market reversed and dropped sharply below the support level, even creating a visible gap. Didn’t last long, the price recovered quickly and made another strong move up, breaking out of the downward pennant structure. Since then, Gold has been trading inside a new formation, an upward pennant, where both support and resistance lines are gradually converging. This setup suggests growing pressure and the potential for a breakout. Currently, the price is hovering near the support line of this upward pennant. In my opinion, we may see a small correction to test this support, followed by a bullish rebound. If the structure holds, Gold could break out upward and head directly toward the 3430 resistance level, which matches the upper boundary of the previous seller zone — this is my TP 1. Given the strong impulse structure and continuation pattern, I remain bullish and expect further growth after this local retest. Please share this idea with your friends and click Boost 🚀
Disclaimer: As part of ThinkMarkets’ Influencer Program, I am sponsored to share and publish their charts in my analysis.

Looking deeper in the consolidation zone of $BTC 4hr Wanted to show how I use fibs and how I use them to approach entry and exit points while in consolidation.

Bitcoin - Expecting Liquidity Grab at 102.8k Before Relief MoveMarket Context
After a strong rejection from resistance, price has shown clear signs of internal weakness. We recently got an internal liquidity sweep followed by a sharp move down, confirming a shift in momentum. The market is currently compressing just below a key fair value gap, hinting at further downside before any real bullish structure can form
Internal Sweep and Bearish Pressure
The internal sweep acted as a final inducement before the market sold off. The reaction afterward was clean and aggressive, suggesting that smart money is offloading positions into trapped longs. Price has now stalled in a tight range, and the lack of bullish follow-through adds weight to the idea that lower prices are still on the table.
Fair Value Gap Below as Draw
The unfilled imbalance below, lining up near 102.8k, is acting as a magnet. This level has not been tapped and lines up cleanly with the idea of a final liquidity sweep before any retracement. It would make sense to target this zone to clear out remaining liquidity and rebalance price before reassessing.
Retracement Scenarios After the Sweep
Once that low is swept and the gap is filled, we could see a retracement back into the previous fair value gap around 106k. This could either form a lower high, continuing the broader downtrend, or potentially run the high if there's enough momentum. Either way, the reaction from that level will offer the next major clue on direction.
Key Expectation
Until the low around 102.8k is swept, the bearish narrative remains intact. The cleanest setup would be a liquidity run into that level followed by a reaction that leads us higher, ideally back toward the 106k zone. From there, we’ll watch how price behaves to decide whether a deeper correction or a trend continuation is in play.
Conclusion
Still leaning bearish short-term as long as that gap and low remain unfilled. Once we tap into the 102.8k area, I’ll be watching for a shift that could give us a play back into the 106k gap. It’s all about liquidity, structure, and the cleanest path for smart money to move.
Disclosure: I am part of Trade Nation's Influencer program and receive a monthly fee for using their TradingView charts in my analysis.
Thanks for your support!
If you found this idea helpful or learned something new, drop a like 👍 and leave a comment, I’d love to hear your thoughts! 🚀

EURNZD Buyers In Panic! SELL!
My dear friends,
EURNZD looks like it will make a good move, and here are the details:
The market is trading on 1.9299 pivot level.
Bias - Bearish
Technical Indicators: Supper Trend generates a clear short signal while Pivot Point HL is currently determining the overall Bearish trend of the market.
Goal - 1.9163
Recommended Stop Loss - 1.9366
About Used Indicators:
Pivot points are a great way to identify areas of support and resistance, but they work best when combined with other kinds of technical analysis
Disclosure: I am part of Trade Nation's Influencer program and receive a monthly fee for using their TradingView charts in my analysis.
———————————
WISH YOU ALL LUCK
XAU/USD.4h chart pattern.XAU/USD (Gold vs US Dollar) on the 4-hour timeframe, and it indicates a bearish breakdown from an ascending triangle or wedge pattern. The trendline has been broken, and the price has moved below the Ichimoku cloud, supporting a bearish outlook.
📉 Bearish Targets Identified:
1. First Target Zone (Minor Support):
Price Level: Around 3,300 – 3,310
This is the first horizontal support area after the breakdown.
2. Second Target Zone (Major Support):
Price Level: Around 3,250 – 3,260
This is the second marked target and more significant support zone based on past price action.
🔻 Summary:
Pattern: Rising wedge / ascending structure breakdown.
Breakdown Confirmed: Price below trendline and Ichimoku cloud.
Target 1: 3,300 – 3,310
Target 2: 3,250 – 3,260
Stop Loss (Suggested): Above 3,380 (cloud resistance / previous high).
Let me know if you'd like entry/SL/TP levels or a written analysis for posting.

Gold Weekly Friday Trend Analysis and Trading RecommendationsOn Thursday, gold maintained a sideways trend, currently trading near $3,370. It hit a low of $3,347 and then rebounded immediately, while yesterday's Federal Reserve interest rate decision had little impact on market volatility. Since Monday, when bearish forces were stronger than bullish ones, the gold market has been seeing equalized bullish and bearish forces, consolidating as it waits for the next stimulus direction.
Once it stabilizes above $3,400 again, there is likely to be an inflection point, and it will gradually rise to test the upper track at $3,460–3,470. At the 4-hour level, it is currently under pressure at the middle track of $3,405, with support at $3,345.
Gold may break out of the current range on Friday. Intraday trading can focus on range operations between the support of $3,345 and the resistance of $3,400: when the gold price stabilizes above $3,360, you can lightly go long, with targets sequentially at $3,375 and $3,395; if it is resisted below $3,395, you can try to lightly go short.
XAUUSD
buy@3350-3360
tp:3380-3390-3400
Investment itself is not the source of risk; it is only when investment behavior escapes rational control that risks lie in wait. In the trading process, always bear in mind that restraining impulsiveness is the primary criterion for success. I share trading signals daily, and all signals have been accurate without error for a full month. Regardless of your past profits or losses, with my assistance, you have the hope to achieve a breakthrough in your investment.

AUDUSD Analysis – Falling from the Rising WedgeAUDUSD pair broke below an ascending wedge, a bearish reversal pattern.
Clean rejection from 0.6518, with lower highs and new lower lows confirming bearish momentum.
Price is now sitting below former trendline support, retested and respected as resistance.
Bearish target points toward 0.6400–0.6380 zone, aligning with recent swing lows.
Risk invalidation sits above 0.6520, where structure fails.
Technical Bias: Bearish
Target: 0.6400
Stop-loss zone: Above 0.6520
📊 Current Bias: Bearish
🔍 Key Fundamentals Driving AUDUSD
AUD Fundamentals (Weakening):
Australian jobs data was mixed, and wage growth has plateaued.
RBA remains cautious, with expectations for rate cuts later in 2025.
AUD pressured by China growth risks and weak commodity demand.
Geopolitical drag: Australia-China tensions and weak Chinese retail data from 618 Festival dampen AUD outlook.
USD Fundamentals (Resilient):
USD remains bid on risk-off flows, especially after weak global data and ongoing Middle East tensions.
Fed remains reluctant to cut fast despite disinflation signs – supports the USD.
US data is mixed, but rate cut odds are declining (only one expected in 2025 now per dot plot).
⚠️ Risks to This Bearish View
If China announces new stimulus, AUD could rebound sharply.
A dovish surprise from the Fed (e.g. Powell softening in speeches).
Sharp rebound in risk appetite (e.g. tech-led equity rally).
🗓️ Important Events to Watch
🇨🇳 China industrial profits & PMIs
🇦🇺 RBA Meeting Minutes (July preview hints)
🇺🇸 US Core PCE (June 28)
Global risk tone: watch metals, equities, and geopolitical headlines.
🚀 Which Asset Leads?
AUDUSD is lagging other USD pairs, but will likely lead commodity FX downside if China or metals weaken further.
Watch AUDJPY and EURAUD for further confirmation of risk-off flows and Aussie weakness.

GOLD → Consolidation within a falling wedgeFX:XAUUSD is consolidating. A major player is gathering a trading position inside a wedge ahead of distribution. But the main question is: in which direction?
Gold lost ground again on Friday after mixed holiday trading on Thursday. Traders are waiting for new signals from the Fed and monitoring the situation in the Middle East. Interestingly, gold fell as the conflict escalated further (which is not logical overall). The dollar is in a global bearish trend, and traders are waiting for a decision from Powell (who is under pressure from Trump to cut rates).
Technically, if we look at the wedge, we can see how difficult it is for the market to move. The price is stuck inside the consolidation. The intraday movement is very short, with long tails and a very weak reaction to both false breakouts and level break. Large players are building up positions inside the current channel. This may only hint at the possibility of future implementation (distribution).
Resistance levels: 3360, 3396, 3420
Support levels: 3338, 3320, 3302
On D1 - H4, gold is in a countertrend (bullish trend) correction and is testing the trend support + 0.7 Fibo zone. Below, there are fairly strong areas of interest — 3320 and 3302 — which gold may test before rising. However, within the wedge, there is a fairly high probability of a breakout of resistance and the 3360 level, followed by a rally to the liquidity zone at 3396
Best regards, R. Linda!

Can Crude Oil Spike to 150 USD / bbl ? Scenario Analysis.With Mid East tensions rising and overall unpredictable
situation around Strait of Hormuz, let's review potential
scenarios for the Crude Oil Prices. I've outlined three
scenarios with projected oil prices for each scenario below.
🚨 Market Alert: Israel-Iran Conflict Impact Forecast 📈
🔴 Worst-Case Scenario: Regional War + U.S. Military Involvement
🚢 Oil (Brent): Soars to $150–$200+ if Strait of Hormuz closes
🥇 Gold: Skyrockets to $4,500–$5,000 (safe-haven rush)
₿ Bitcoin: Initial volatility; settles at $80k–$100k
📉 SPX: Crashes to 4,000–4,500
💻 NDX: Drops sharply to 15,000–16,000
🟠 Base-Case Scenario: Protracted Tension, No Major Disruption
🛢 Oil: Stabilizes at elevated $75–$95, occasional spikes
🥇 Gold: Moves higher, trading $3,500–$3,800
₿ Bitcoin: Trades steady, $90k–$110k range
📊 SPX: Pullback moderate, around 5,200–5,500
💻 NDX: Moderately lower, 18,000–19,000 range
🟢 Best-Case Scenario: Diplomatic De-Escalation
🌊 Oil: Eases down to $65–$75
🥇 Gold: Mild decline, holds at $3,300–$3,500
₿ Bitcoin: Positive sentiment, lifts to $100k–$120k
📈 SPX: Slight dip; stays strong near 5,800–6,200
💻 NDX: Minor correction, remains high at 20,000–22,000

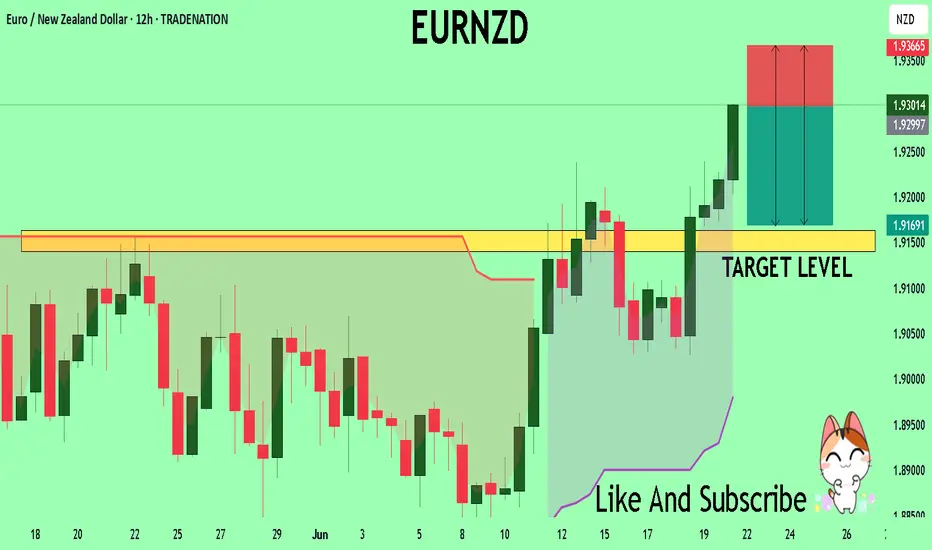
EUR-NZD Bullish Breakout! Buy!
Hello,Traders!
EUR-NZD keeps growing and
The pair made a bullish breakout
Of the key horizontal level
Of 1.9270 and the breakout
Is confirmed so we are bullish
Biased and we will be
Expecting a further move up
Buy!
Comment and subscribe to help us grow!
Check out other forecasts below too!
Disclosure: I am part of Trade Nation's Influencer program and receive a monthly fee for using their TradingView charts in my analysis.

Bitcoin Short-Term Recovery Confirmed Bulls Win!Ranging markets/sideways markets is when traders lose the most money. Always keep this in mind.
» Short-term signals are pointing to a recovery right away.
» Bitcoin's drop wicked below the 13-June low but the RSI produced a higher low and thus we have a bullish divergence.
» Bitcoin's current drop went lower yet the chart reveals lower volume now compared to 13-June. This reveals weakness on the bear camp. This means a recovery will happen next, right away.
These are just a few signals but taken together with the altcoins analysis that I showed you and the bigger picture; Ha ha! The bulls win again.
Namaste.

Bitcoin - Will it explode up or down?Introduction
Bitcoin (BTC) is currently trading within a symmetrical triangle pattern, forming a series of higher lows and lower highs. This price action indicates a tightening range as the market approaches the apex of the triangle. A breakout is becoming increasingly likely in the coming days, and traders are now watching closely to see which direction BTC will choose. Will it break to the upside or the downside?
Pattern Trading
The symmetrical triangle has been a consistent feature of BTC’s recent price action. Price has been oscillating between the descending resistance and ascending support trendlines, gradually compressing the range. Based on the current structure, Bitcoin could continue moving within this pattern until around June 26th, when the triangle becomes extremely narrow and a breakout becomes imminent. Historically, such setups can produce false breakouts or “fake-outs,” where the price temporarily moves in one direction before sharply reversing and breaking out in the opposite direction. These moves often trap traders who enter too early, so caution is advised. Market manipulation is not uncommon in these tight formations, making it essential to wait for confirmation before entering a position.
4H Fair Value Gap (FVG)
Bitcoin has recently filled a 4-hour Fair Value Gap (FVG), a zone that often attracts price due to inefficiencies in the market. Now that this gap has been filled, there could be increased selling pressure, potentially pushing BTC back down toward the lower boundary of the triangle. If BTC is unable to break through the resistance created by this FVG, we may see more bearish momentum. However, should BTC manage to break and hold above this imbalance zone, it would be a strong sign of bullish intent and could open the door for a move to the upside. For now, though, this area remains a significant resistance level.
Upside Target
If BTC manages to break out of the triangle to the upside with strong volume and confirmation, the first major resistance level is around $109,000. This would be a logical target for bulls, as it represents a key zone of liquidity and previous interest. A successful move toward this level would confirm the bullish breakout and could set the stage for further gains, depending on broader market sentiment.
Downside Targets
Conversely, if BTC breaks below the lower trendline of the triangle, the first area to watch is around $103,500. This level is where a significant amount of liquidity has built up, and it could act as initial support. However, if that level fails to hold, the next key psychological level to watch would be $100,000. A drop below this milestone could trigger panic selling and further downside, especially if market sentiment turns negative.
Conclusion
At this point, BTC is at a critical juncture, and traders should remain patient as the market decides its next direction. While the current rejection from the 4H FVG suggests some short-term bearish pressure, the overall pattern remains neutral until a confirmed breakout occurs. Trading within the triangle can be risky due to the possibility of fake-outs, so it’s best to wait for clear confirmation before committing to a trade. Stay cautious, manage your risk carefully, and prepare for volatility as Bitcoin approaches a decisive move.
Disclosure: I am part of Trade Nation's Influencer program and receive a monthly fee for using their TradingView charts in my analysis.
Thanks for your support.
- Make sure to follow me so you don't miss out on the next analysis!
- Drop a like and leave a comment!

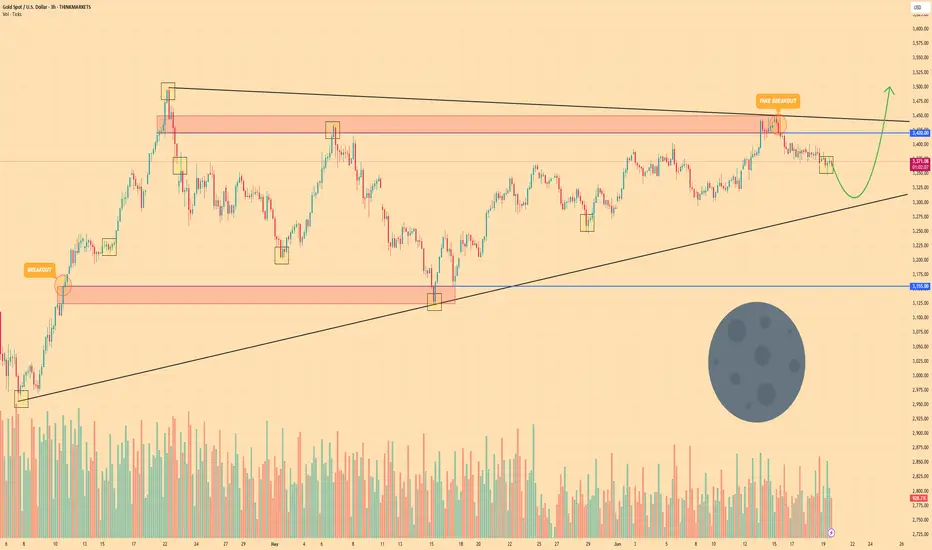
GOLD - Price may bounce up from wedge to $3500 points Hi guys, this is my overview for XAUUSD, feel free to check it and write your feedback in comments👊
A few moments ago, price entered to wedge, where it at once made an upward impulse from the support line.
Price broke $3155 with $3420 level and reached resistance line, but soon turned around and started to decline.
After this, Gold broke the $3420 level one more time and later tried to grow, but when it reached the resistance zone, it dropped.
Next, price bounced from support line of wedge and started to grow and in a short time rose to $3420 level.
Recently, it declined below, making a fake breakout of the resistance level, and now it continues to decline.
In my mind, Gold can decline a little more and then bounce up to $3500, breaking the resistance level.
If this post is useful to you, you can support me with like/boost and advice in comments❤️
Disclaimer: As part of ThinkMarkets’ Influencer Program, I am sponsored to share and publish their charts in my analysis.
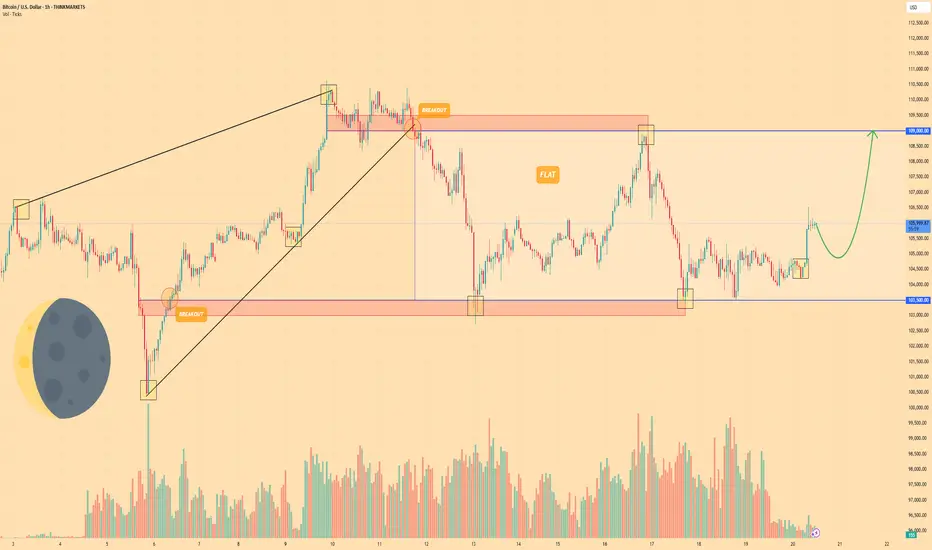
BITCOIN - Price can continue grow inside flat to $109000 levelHi guys, this is my overview for BTCUSD, feel free to check it and write your feedback in comments👊
A few days ago, the price entered a wedge, declining below the $103500 level and then making a strong impulse up.
Next, price broke $103500 level one more time and rose to resistance line of wedge, after which started to decline.
BTC broke $109000 level and started to trades inside a flat, where it declined to support level and then bounced up.
Price rose to resistance level, which is top part of flat, and then at once dropped back and started trading close.
But some time later, price bounced from this level and started to grow, and even now it continues to grow.
So, I think that BTC can make a small correction movement and then continue to grow to $109000 level.
If this post is useful to you, you can support me with like/boost and advice in comments❤️
Disclaimer: As part of ThinkMarkets’ Influencer Program, I am sponsored to share and publish their charts in my analysis.
ETHUSD 4H Chart | ETH Bearish SetupThis chart highlights a possible bearish breakdown scenario for Ethereum (ETHUSD) on the 4H timeframe.
🔍 Key Levels:
Breakdown Confirmation Level: $2,362
Target 1: $2,151
Target 2: $1,954
(Optional Target 3: $1,750 if added)
📉 After multiple failed attempts to break above resistance, ETH price is now testing a critical support zone. A confirmed breakdown below this level could trigger further downside towards the mentioned targets.
Ichimoku Cloud shows weakening bullish momentum, supporting the potential for a bearish move.
Use Proper Money Management

NVIDIA – Best Buy of the Decade (2 Years from now) 🚀💻 NVIDIA – Best Buy of the Decade (2 Years from now) 🔥🧠
Hey everyone! Back in 2021, I called NVIDIA the best buy of the decade, and in 2023, we followed up as NVDA rocketed to my target of $143. Now in 2025, it’s time for Part 3 — and the case for NVDA being a generational play just got even stronger. 💪
✅ On April 4th, I re-entered around $96.85, right at my alert level. The setup? A rounded bottom reversal pattern forming with 4 strong bullish divergences on key indicators (Stoch, CCI, MOM, MFI). Target levels ahead:
📍 $143
📍 $182
📍 $227
📉 Yes, Nvidia took a 6% hit after announcing a $5.5B impact from U.S. export restrictions on its H20 chip to China — a reminder that macro & geopolitical factors still matter. But…
💡 The company just launched DGX Spark and DGX Station, bringing AI supercomputing to the desktop — powered by Grace Blackwell architecture. That’s next-level innovation, not just for enterprises, but for developers, students, and researchers alike. A true desktop AI revolution.
🇺🇸 And most importantly: NVIDIA will now manufacture AI supercomputers on U.S. soil — in Arizona and Texas — aiming to produce $500 billion worth over the next four years. This initiative is a bold move toward supply chain resilience, economic growth, and cementing NVIDIA’s leadership in the AI arms race.
⚠️ If we lose the $96 level, I’ll re-evaluate. But for now? The technical and fundamentals still say: Best Buy of the Decade (2 Years from now we will revisit this chart).
💬 What’s your outlook? Are you buying the dip or waiting on clarity?
One Love,
The FXPROFESSOR 💙

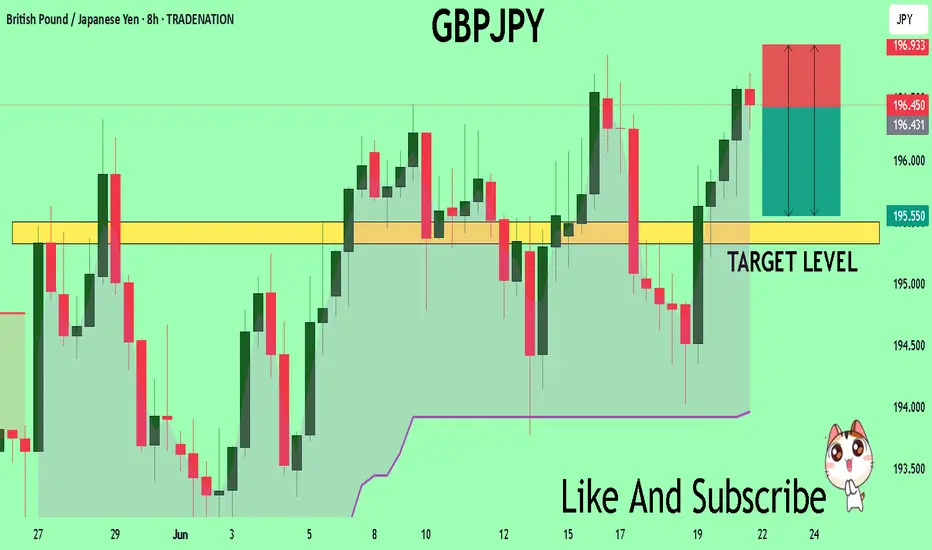
GBPJPY Massive Short! SELL!
My dear subscribers,
This is my opinion on the GBPJPY next move:
The instrument tests an important psychological level 196.43
Bias - Bearish
Technical Indicators: Supper Trend gives a precise Bearish signal, while Pivot Point HL predicts price changes and potential reversals in the market.
Target - 195.50
My Stop Loss - 196.93
About Used Indicators:
On the subsequent day, trading above the pivot point is thought to indicate ongoing bullish sentiment, while trading below the pivot point indicates bearish sentiment.
Disclosure: I am part of Trade Nation's Influencer program and receive a monthly fee for using their TradingView charts in my analysis.
———————————
WISH YOU ALL LUCK
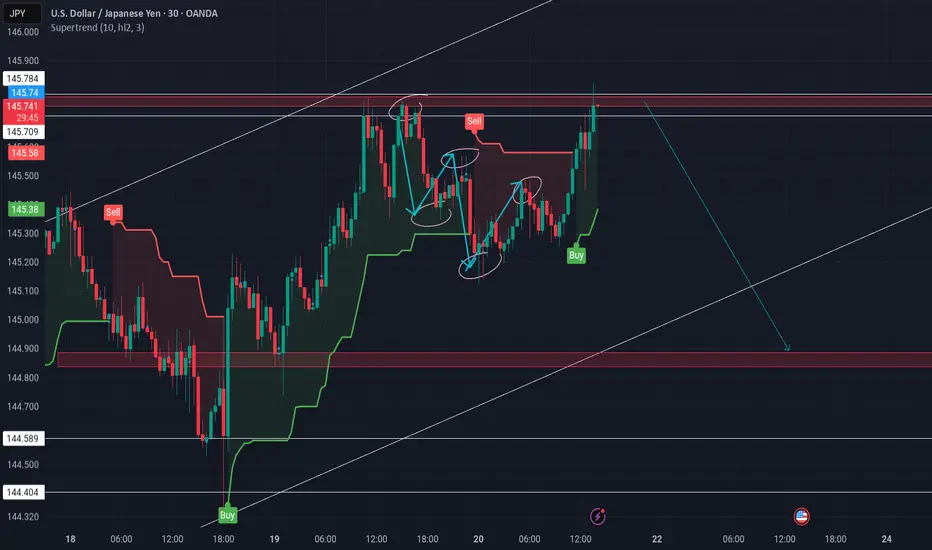
Reason for SELL (USDJPY M30)1. [Strong Resistance Zone
Price reached a key resistance (red zone) that was rejected multiple times before.