$TAO/USDT Eyes 18%$TAO/USDT is bouncing off a strong support zone around $340–$350.
It’s trading inside a descending channel and could target $420, an 18.60% potential move if support holds and momentum builds.
DYRO, NFA
Chart Patterns

Bitcoin (EoY '28) - Potentials <3I just wanted to publish this because I feel there is some deep involvement on the drawings based off the all-time historic trendline.
I would like to see how this unfolds. Usually, I am too grandiose about my predictions, or too short-time-minded/%gains. Today we can see a few things that are appreciative and indicative of continuation on a higher timeframe. We can crawl and crawl forever. You musn't be afraid. Continue to trudge forward. There are no bears here, they are only phantoms in the dark.

bullish targets smashed ;)spy broke my bullish targets i posted when it was 500, now struggling with a lower high at resistance zone, push down to 572-580 or so is possible before they try to push for all time highs🚀
boost and follow for more 💖

BNL LONG TRADE (THIRD STRIKE) 16-06-2025BNL Long Trade (Third Strike)
Rationale: After its inception in PSX in 2013, BNL went into a tremendous uptrend, reaching a high of Rs. 61.7, then corrected and down trended to Rs. 12. The stock consolidated for 4 years between Rs. 49 and Rs. 12. Recent rally broke out of this accumulation zone, creating bullish FVGs and IFDZS for a safe long trade entry.
🚨 TECHNICAL BUY CALL – BNL🚨
- Buy 1: Rs. 45.90
- Buy 2: Rs. 44.30
- Buy 3: Rs. 38.6
- TP 1: Rs. 58.7
- TP 2: Rs. 67.9
- TP 3: Rs. 74.77
- TP 4: Rs. 86.70
Stop Loss - Below Rs. 34 ON DAY CLOSING
Risk-Reward Ratio- 3.65
aution: Close at least 50% position size at TP1 and then trail SL to avoid losing incurred profits in case of unforeseen market conditions.
PLEASE BOOST AND SHARE THE IDEA IF YOU FIND IT HELPFUL.

AUDCHF - Wait For it!Hello TradingView Family / Fellow Traders. This is Richard, also known as theSignalyst.
📈AUDCHF has been overall bearish trading within the flat falling broadening wedge pattern marked in red.
Moreover, the green zone is a supply.
🏹 Thus, the highlighted red circle is a strong area to look for sell setups as it is the intersection of the upper red trendline and supply.
📚 As per my trading style:
As #AUDCHF approaches the red circle zone, I will be looking for bearish reversal setups (like a double top pattern, trendline break , and so on...)
📚 Always follow your trading plan regarding entry, risk management, and trade management.
Good luck!
All Strategies Are Good; If Managed Properly!
~Rich
Disclosure: I am part of Trade Nation's Influencer program and receive a monthly fee for using their TradingView charts in my analysis.

Ethereum at PRZ: Bullish Setup _ Short termEthereum ( BINANCE:ETHUSDT ) reacted from the Potential Reversal Zone (PRZ) around the confluence of key Fibonacci levels , the Important Support line and 50_SMA(Daily) .
From an Elliott Wave point of view , we can identify a Expanding Flat (ABC/3-3-5) structure ending right above the Support zone ($2,474-2,437) .
The structure also hints at the formation of a new upward leg , potentially leading ETH toward the Resistance zone ($2,564-$2,524) and the upper line of the Ascending Channel .
I expect Ethereum to test the 38.2%($2,531=First Target) - 50%($2,561) Fibonacci retracement levels on the way to a potential retest of the previous swing highs .
Note: Stop Loss (SL) = $2,451= Worst Stop Loss(SL)
Please respect each other's ideas and express them politely if you agree or disagree.
Ethereum Analyze (ETHUSDT), 15-minute time frame.
Be sure to follow the updated ideas.
Do not forget to put a Stop loss for your positions (For every position you want to open).
Please follow your strategy and updates; this is just my Idea, and I will gladly see your ideas in this post.
Please do not forget the ✅' like '✅ button 🙏😊 & Share it with your friends; thanks, and Trade safe.

BTC at 103K – Bounce or Breakdown?1. Overall Trend:
The chart is currently within a descending channel, indicated by two parallel downward-sloping trendlines. The price continues to fluctuate within the boundaries of this bearish channel.
2. Current Price Action:
BTC has just touched the lower green support zone (around 103,000 – 102,500 USDT) and is showing a slight rebound.
→ This suggests a potential recovery toward the nearest resistance zone.
3. Key Levels:
✅ Nearest Support Zone:
103,000 – 102,500 USDT → The price is currently bouncing from this area. If this zone holds, a short-term rebound toward resistance is likely.
🟥 Nearest Resistance Zone:
105,000 – 106,500 USDT → This zone has repeatedly rejected price advances in the past. Watch closely as price approaches this level.
🟪 Major Upper Resistance Zone:
Around 107,000 – 109,000 USDT → If price breaks above the red zone, this will be the next target.
4. Potential Scenarios:
🔹 Scenario 1 (Bullish):
If BTC holds the 103K support and breaks above the descending channel → price could aim for 105K – 106.5K. If that level is breached, the next target may be 107K – 109K.
🔸 Scenario 2 (Bearish):
If the 103K support breaks → price may fall deeper toward the lower green support zone (around 101,500 – 100,500 USDT).
🎯 Summary:
Short-term trend remains bearish.
Price is reacting at support → a rebound is possible.
Need confirmation from volume and candlesticks to determine if the current downtrend can be broken.
Don't forget to like – follow – and share if you find it useful!”😁😁😁

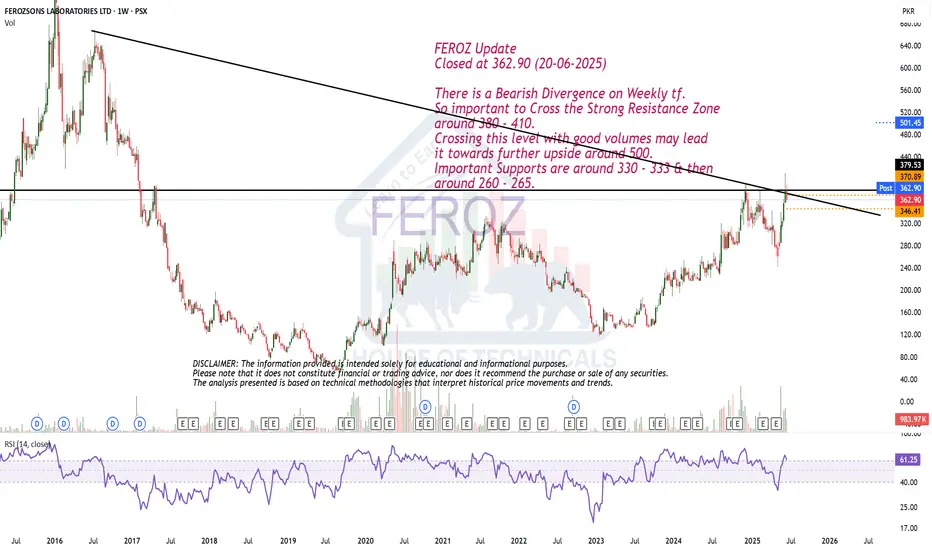
Bearish Divergence on Weekly tf.FEROZ Update
Closed at 362.90 (20-06-2025)
There is a Bearish Divergence on Weekly tf.
So important to Cross the Strong Resistance Zone
around 380 - 410.
Crossing this level with good volumes may lead
it towards further upside around 500.
Important Supports are around 330 - 333 & then
around 260 - 265.
10 year united states government bond yieldthe US 10-Year Treasury Yield (US10Y) stands at 4.435% newyork session,The 10-year yield is a key benchmark for long-term interest rates in the United States and is closely watched by investors as an indicator of market sentiment regarding economic growth, inflation, and Federal Reserve policy.
The yield has been rising recently, reflecting investor concerns about US fiscal policy, inflation, and the outlook for Federal Reserve rate cuts.
Federal Reserve Interest Rate Decision (June 2025)
The Federal Reserve held its key interest rate steady at 4.25%–4.50% at its June 2025 meeting.
This marks the fourth consecutive meeting with no change in rates, as the Fed continues its cautious, data-dependent approach amid persistent inflation and moderate economic growth.
The Fed’s latest “dot plot” and projections indicate that two 25-basis-point rate cuts are still possible by the end of 2025, but expectations for cuts in 2026 and beyond have been reduced.
Key Drivers and Outlook
Yield Movements: The 10-year yield has climbed amid concerns about US fiscal deficits, credit rating downgrades, and the impact of tariffs and trade policy on inflation.
Fed’s Tone: The FOMC statement and projections reflect ongoing stagflationary pressures—slower growth, persistent inflation, and a slightly rising unemployment rate.
Market Expectations: Markets are pricing in two rate cuts by year-end, most likely in September and December, but nearly half of Fed officials see little or no room for cuts in 2025 if inflation remains sticky.
Conclusion
The US 10-year Treasury yield remains elevated as markets weigh fiscal risks, inflation, and the Fed’s cautious stance.
The Fed is holding rates steady but signaling that two rate cuts remain possible in 2025, with future moves highly dependent on incoming data, especially inflation and labor market trends.
Investors should expect continued yield volatility as economic and policy uncertainties persist.

USDCAD LONG SETUPI am expecting the US Dollar to be bullish this week.
Weekly closed as a bullish engulfing.
Expecting price to make a minor pull back on the daily before taking making another bullish push.
Price is also showing a bullish divergence on the daily, which furthers strengthens my perspective.
The 2H TF also illustrates somewhat of a Cup-and-Handle Candle Stick Formation
Will look to enter longs on the lower TFs (1-4h)

Bitcoin and the geopolitical news BINANCE:BTCUSDT.P
Advanced Technical Analysis of Bitcoin's Structure – Current Situation on Smaller Timeframes
We notice a symmetrical triangle forming on the small timeframes (1-hour and 4-hour), centered in a critical area. Historically, when this price pattern forms, Bitcoin takes no more than three days to confirm its trend. Therefore, the close of the third-day candlestick will serve as a pivotal turning point.
🔹 Immediate Support: 103,400
🔹 Strong Support: 102,500 — a daily low + institutional liquidity zone
🔹 First Resistance: 105,600 — associated with a convergence of moving averages (EMAs)
🔹 Main Resistance: 106,700 — a crossover with the 200-period moving average, which can be described as the largest psychological barrier
---
Possible Scenarios:
☑️ Positive Scenario:
If 105,600 is breached, we are expected to witness an upward movement targeting:
108,000
110,000
118,000 (potentially later)
✅ Catalysts:
Positive US economic data
Regulatory news supporting the markets (such as institutional entry and cryptocurrency regulations)
---
⚠️ Negative Scenario:
If the 102,500 support level is broken, the path will be open to:
100,000
99,000 (strong psychological support area)
❗️ Potential Triggers:
Negative inflation data
Major geopolitical escalation (especially if it directly involves the United States)
🔴 Important Note: I'm not a proponent of trading based on news, but I'm including the US factor because it's the only one I consider truly influential in geopolitical analysis.
The US entering a full-scale war would prompt American investors (who represent about 5% of active traders) to withdraw immediately for fear of long-term repercussions.
🔻 America is making history now, and Trump is managing the situation expertly. He is likely to avoid getting involved in long-term conflicts, focusing on concluding deals and wars strategically.
---
Current Sideways Trading:
Trading continues between the 103,400 and 105,600 levels within the symmetrical triangle.
The future direction will be determined by the following developments:
If the conflict ends and a deal is reached (especially if Iran surrenders), we will witness a strong upward breakout.
If the United States enters the war directly, we expect a downward breakout to levels that may reach 92,000.
---
Technical Conclusion: 💎
Bitcoin is in a critical consolidation phase with a delicate balance between institutional selling pressure at 106,700 and strong buying demand at 102,500.
The next breakout will depend on:
1. A clear breakout of the triangle pattern
2. The strength of the liquidity accompanying the movement
3. Official US developments—regulatory or political
---
Important Clarification:
❌ The recent decline is not directly related to the Iran-Israel war. Rather, it came as a result of:
1. Options expiry
2. Trump's statements about the possibility of direct US intervention, with the arrival of an aircraft carrier in the Middle East
🔍 A war between only two parties doesn't worry the market much, but US intervention is the decisive factor.
✅ America alone is the one that moves the markets.

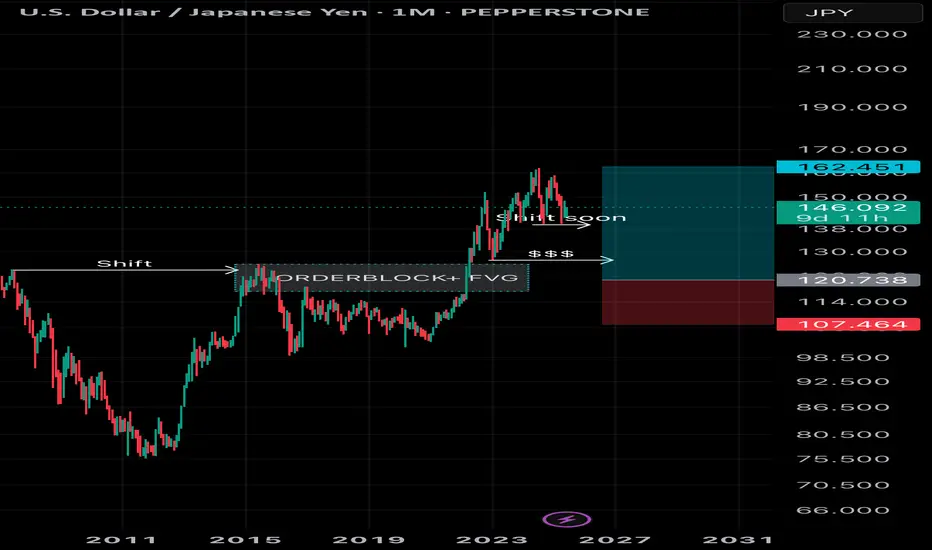
Mega long for the year 2027-2030Here is an idea for USDJPY pair. Im looking for a long term long position when price sweeps liquidity and react at the OrderBLock and FVG marked in my analysis. First of all, I expect a market shift in the near term, as i marked it(shift soon). Maybe a short position there wont be bad
LAYERUSDTBullish trend continuation expectation
either take entry on break of HH
or take entry on fib 0.382 and put SL 0.6013

Ondo (ONDO): Reached Another Pump Zone | Good Entry Right HereOndo coin reached the local liquidity trend, where reaching this area was signaling us of upcoming smaller buyside movement.
So that's what we are looking for right now as well, a healthy upward movement towards our major target area at least.
Swallow Academy

NAS100 WILL FALLLooking at this H4 charts, as we can see it, FUSIONMARKETS:NAS100 lost the backup of our H4 50EMA, im expecting a clean bounce at the retest of these 50EMA. Targeting the below 200EMA for TP.

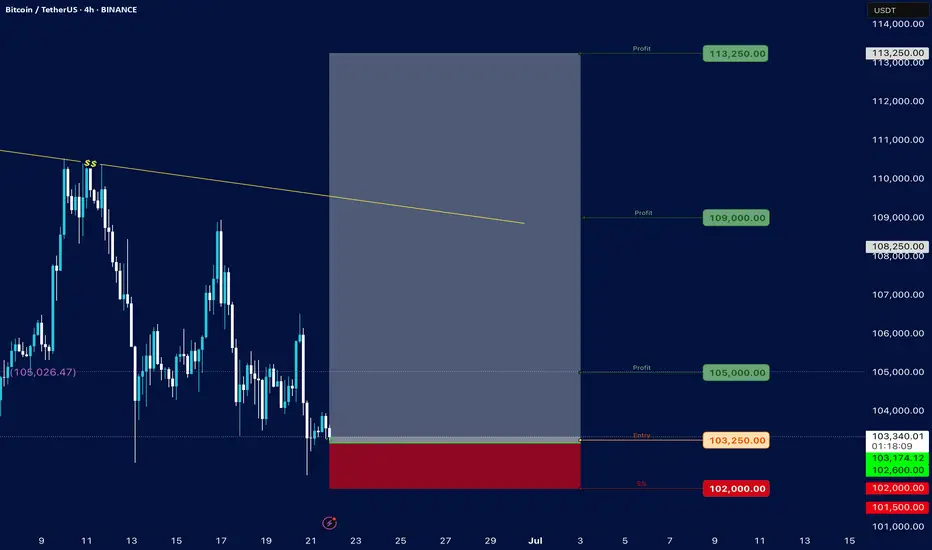
Bitcoin### Bitcoin Price Analysis (June 21, 2025)
#### **Current Price**: $103,236.15 (as of the snapshot)
- The price is hovering near the lower end of the recent range, with key support at **$102,000** (marked as "S/s" on the chart).
- Resistance levels are visible at **$105,000**, **$107,000**, and **$110,000–$114,000**.
#### **Key Observations**:
1. **Support and Resistance**:
- **Strong Support**: $102,000 (critical level; break below could signal further downside).
- **Immediate Resistance**: $105,000 (previous entry point and psychological level).
- **Higher Targets**: $110,000–$114,000 (if bullish momentum returns).
2. **Price Action Context**:
- The price recently rejected the $105,250 level ("Entry") and is now testing lower support.
- The "Profit" markers at $105,000 and $105,026 suggest these were take-profit zones for traders.
3. **Trend and Sentiment**:
- The chart shows consolidation between $102,000–$110,000, with no clear breakout yet.
- A hold above $102,000 could lead to a retest of $105,000, while a break below may target $100,000 or lower.
4. **Volume and Timeframe**:
- The snapshot lacks volume data, but the date range (June–July) suggests a medium-term view.
- Key dates to watch: June 25–28 and early July for potential volatility.
#### **Conclusion**:
- **Bullish Case**: Hold above $102,000 and reclaim $105,000 to aim for $110,000+.
- **Bearish Risk**: Break below $102,000 could accelerate selling toward $100,000 or $99,000.
**Actionable Insight**: Watch the $102,000–$105,000 range for a breakout or breakdown. A rebound from support with volume could signal a buying opportunity, while a drop below $102,000 may indicate further downside.
*(Note: The analysis is based on limited data from the snapshot. For a full assessment, additional indicators like RSI, MACD, and volume would be needed.)*
NATURAL GAS Natural gas prices have pulled back from a 2½-month high due to forecasts of normalizing summer temperatures in the U.S., which could reduce cooling demand and electricity generation needs.
Demand Drivers:
U.S. LNG exports are ramping up, supporting demand and prices. LNG export facilities like Plaquemines LNG and Corpus Christi Stage 3 began production in late 2024, with more capacity expected in the next two years.
Domestic demand for natural gas in power generation is expected to rise seasonally in summer, with June electric power consumption projected to be about 25.7% higher than May.
Supply Factors:
U.S. dry gas production remains robust, currently around 106.7 billion cubic feet per day (Bcf/d), up 3.3% year-over-year.
Natural gas inventories are near five-year averages but expected to end the injection season (October 31) about 3% below average due to strong demand and exports.
Price Forecast:
The U.S. Energy Information Administration (EIA) projects Henry Hub spot prices to average around $4.00/MMBtu in 2025 and rise further to about $4.90/MMBtu in 2026, driven by increased LNG exports and domestic consumption growth.
Conclusion
Natural gas prices are currently moderating after recent gains but remain supported by strong export demand and seasonal power consumption increases. The market outlook is for prices to rise through 2025 and 2026 as LNG exports expand and domestic demand grows, despite some short-term weather-driven fluctuations.
#LNG #USOIL #DOLLAR

BTC: A shakeout for more liquidityBTC: A shakeout for more liquidity
.
Wait for a drop and catch the dip, and continuously go up!
US STOCKS- WALL STREET DREAM- LET'S THE MARKET SPEAK!

BTCUSD – At a Make-or-Break LevelBTCUSD – At a Make-or-Break Level: Will Bitcoin Rebound or Slide Further?
Bitcoin continues to hover near a critical support level after last week's sharp drop. With rising macro uncertainty, shifting institutional flows, and growing interest in crypto regulation, BTCUSD is showing signs of a potential reversal — but traders should proceed with caution.
🌐 Macro Outlook – Debt Pressure, ETFs & Election Talk Fuel Uncertainty
US fiscal stress is building: Analysts warn that the United States could see interest payments exceed $1 trillion in 2025 — more than its defense or healthcare budget. This puts pressure on the Federal Reserve to consider fiscal tightening instead of rate cuts.
Spot Bitcoin ETF inflows are slowing: After a strong start in early 2024, institutional flows into spot BTC ETFs have cooled down recently. Hedge funds and asset managers are waiting for more clarity on economic policy.
Pro-crypto narratives gaining traction in US politics: With elections approaching, political figures are floating proposals to use Bitcoin as a strategic reserve asset and encourage crypto-based financial infrastructure.
Meanwhile, the US Dollar Index (DXY) remains volatile. A weaker dollar could support crypto, but stronger-than-expected inflation data may fuel further caution.
📉 Technical Analysis (BTCUSD – H1 to H4)
BTC is currently trading within a medium-term descending channel, and has recently tested the key support zone near 103,108.
A potential V-recovery pattern is forming. If buyers can hold this zone and break above 104,184, the price may target 106,047 and eventually 107,586.
However, EMA clusters (50–100–200) on the H1 chart are still pressing downward. A confirmed bullish reversal would require a breakout above 105,200 with strong volume.
✅ Suggested Trade Plan
🟢 BUY ZONE: 103,100 – 103,300
Entry: On price reaction with confirmation candlestick
SL: 102,600
TP: 104,184 → 106,047 → 107,586
🔴 SELL ZONE: 107,500 – 107,800
Entry: Only if price rejects resistance at upper channel
SL: 108,200
TP: 106,000 → 104,500
⚠️ Avoid aggressive shorting in the current range to reduce false breakout risk.
💬 Final Thoughts for Indian Traders
The current market is caught between macroeconomic caution and long-term crypto optimism. Bitcoin is holding near its lower range — a zone that historically triggers upward momentum.
For Indian traders, the key is to wait for clear structural confirmation and respect technical levels. Let price and macro alignment guide your decisions, not emotion or hype.
Plan the trade. Trade the plan. Protect your capital.

"XAUUSD – Hidden Strength Within the Accumulation Zone"Hello everyone, how are you currently evaluating XAUUSD?
Yesterday, gold remained relatively stable without major volatility, yet continued to be supported by a favorable macro environment. Escalating tensions between Israel and Iran have sustained safe-haven demand. While the U.S. has yet to make a direct military move, President Trump’s emergency meeting and firm stance have increased market caution, which in turn boosted interest in gold.
At the time of writing, gold is trading around $3,368, and the long-term trend still favors the bulls. But why do I say that?
From both a technical and macro perspective, gold is in a healthy accumulation phase. Although it hasn’t broken above the record high, XAUUSD remains safely above key support zones — especially above the EMA 34 — which continues to affirm its bullish structure.
EMA 34 remains a strong dynamic support, with a clear separation from EMA 89, reinforcing the momentum. Even if we see short-term pullbacks in the next few sessions, they are more likely technical retests rather than signs of reversal.
Adding to that, the rising trendline, higher support levels, and bullish candlestick patterns all strengthen the case for continued upward movement. These combined factors paint a positive technical outlook for gold in the medium to long term.
From my perspective, I remain confident in gold’s long-term uptrend. What about you? Feel free to share your thoughts!

MAGIC broke above the resistance!MAGIC has broken above the daily resistance and is now gearing up for a potential bullish move.
Strategy:
~ Entry: $0.15 to CMP.
~ Trade Period: Short-term.
~ Trade Type: Spot/2x-3x leverage.
~ Target: 50%-60%.
Note: Always do your own research and analysis before investing.
Regards,
Dexter.

Bitcoin Could Hit as High as $400KWhen comparing our macro cycle to the 2017 cycle, we see the potential for a very parabolic run on Bitcoin. I believe Bitcoin could hit as high as $400K by 2029. This is because Bitcoin tends to follow the stock market, and I anticipate a major blow-off top coming for the stock market. I expect one more big parabolic run on the Dow Jones leading up to 2029, which would fuel Bitcoin’s rise to $400K.
The lowest I see Bitcoin going during this parabolic run is $250K. On the higher end, I could see it hitting $400K or even more. Big things are coming.
As always, stay profitable.
— Dalin Anderson
