MAGIC/USDTKey Level Zone: 0.1520 - 0.1550
LMT v2.0 detected.
The setup looks promising—price previously trended upward with rising volume and momentum, then retested this zone cleanly. This presents an excellent reward-to-risk opportunity if momentum continues to align.
Introducing LMT (Levels & Momentum Trading)
- Over the past 3 years, I’ve refined my approach to focus more sharply on the single most important element in any trade: the KEY LEVEL.
- While HMT (High Momentum Trading) served me well—combining trend, momentum, volume, and structure across multiple timeframes—I realized that consistently identifying and respecting these critical price zones is what truly separates good trades from great ones.
- That insight led to the evolution of HMT into LMT – Levels & Momentum Trading.
Why the Change? (From HMT to LMT)
Switching from High Momentum Trading (HMT) to Levels & Momentum Trading (LMT) improves precision, risk control, and confidence by:
- Clearer Entries & Stops: Defined key levels make it easier to plan entries, stop-losses, and position sizing—no more guesswork.
- Better Signal Quality: Momentum is now always checked against a support or resistance zone—if it aligns, it's a stronger setup.
- Improved Reward-to-Risk: All trades are anchored to key levels, making it easier to calculate and manage risk effectively.
- Stronger Confidence: With clear invalidation points beyond key levels, it's easier to trust the plan and stay disciplined—even in tough markets.
Whenever I share a signal, it’s because:
- A high‐probability key level has been identified on a higher timeframe.
- Lower‐timeframe momentum, market structure and volume suggest continuation or reversal is imminent.
- The reward‐to‐risk (based on that key level) meets my criteria for a disciplined entry.
***Please note that conducting a comprehensive analysis on a single timeframe chart can be quite challenging and sometimes confusing. I appreciate your understanding of the effort involved.
Important Note: The Role of Key Levels
- Holding a key level zone: If price respects the key level zone, momentum often carries the trend in the expected direction. That’s when we look to enter, with stop-loss placed just beyond the zone with some buffer.
- Breaking a key level zone: A definitive break signals a potential stop‐out for trend traders. For reversal traders, it’s a cue to consider switching direction—price often retests broken zones as new support or resistance.
My Trading Rules (Unchanged)
Risk Management
- Maximum risk per trade: 2.5%
- Leverage: 5x
Exit Strategy / Profit Taking
- Sell at least 70% on the 3rd wave up (LTF Wave 5).
- Typically sell 50% during a high‐volume spike.
- Move stop‐loss to breakeven once the trade achieves a 1.5:1 R:R.
- Exit at breakeven if momentum fades or divergence appears.
The market is highly dynamic and constantly changing. LMT signals and target profit (TP) levels are based on the current price and movement, but market conditions can shift instantly, so it is crucial to remain adaptable and follow the market's movement.
If you find this signal/analysis meaningful, kindly like and share it.
Thank you for your support~
Sharing this with love!
From HMT to LMT: A Brief Version History
HM Signal :
Date: 17/08/2023
- Early concept identifying high momentum pullbacks within strong uptrends
- Triggered after a prior wave up with rising volume and momentum
- Focused on healthy retracements into support for optimal reward-to-risk setups
HMT v1.0:
Date: 18/10/2024
- Initial release of the High Momentum Trading framework
- Combined multi-timeframe trend, volume, and momentum analysis.
- Focused on identifying strong trending moves high momentum
HMT v2.0:
Date: 17/12/2024
- Major update to the Momentum indicator
- Reduced false signals from inaccurate momentum detection
- New screener with improved accuracy and fewer signals
HMT v3.0:
Date: 23/12/2024
- Added liquidity factor to enhance trend continuation
- Improved potential for momentum-based plays
- Increased winning probability by reducing entries during peaks
HMT v3.1:
Date: 31/12/2024
- Enhanced entry confirmation for improved reward-to-risk ratios
HMT v4.0:
Date: 05/01/2025
- Incorporated buying and selling pressure in lower timeframes to enhance the probability of trending moves while optimizing entry timing and scaling
HMT v4.1:
Date: 06/01/2025
- Enhanced take-profit (TP) target by incorporating market structure analysis
HMT v5 :
Date: 23/01/2025
- Refined wave analysis for trending conditions
- Incorporated lower timeframe (LTF) momentum to strengthen trend reliability
- Re-aligned and re-balanced entry conditions for improved accuracy
HMT v6 :
Date : 15/02/2025
- Integrated strong accumulation activity into in-depth wave analysis
HMT v7 :
Date : 20/03/2025
- Refined wave analysis along with accumulation and market sentiment
HMT v8 :
Date : 16/04/2025
- Fully restructured strategy logic
HMT v8.1 :
Date : 18/04/2025
- Refined Take Profit (TP) logic to be more conservative for improved win consistency
LMT v1.0 :
Date : 06/06/2025
- Rebranded to emphasize key levels + momentum as the core framework
LMT v2.0
Date: 11/06/2025
Chart Patterns

Altseason AnalysisTo determine whether we're approaching a true Altseason, we're analyzing the macro relationship between Bitcoin Dominance (BTC.D) and Total 2 (the total crypto market cap excluding Bitcoin). This comparison has consistently revealed where capital is flowing and helps signal shifts in market cycles.
Current Market Structure
BTC Dominance: Currently at 64% and testing resistance zone.
A breakdown below 57% could trigger fresh capital rotation into alts.
Total 2: Hovering near 1.2T ; watching for breakout confirmation.
What Triggers an Altseason?
BTC stability or slow upward grind: Altcoins thrive when Bitcoin is stable not crashing, not parabolic.
BTC.D Breakdown: Often the first real signal. Look for confluence with Total 2 breakout.
Capital Rotation: Watch Ethereum and majors big cap — they usually lead before microcaps follow.
BTC.D Breakdown: Often the first real signal. Look for confluence with Total 2 breakout.
$5 Trillion??
Breakout above $1.7T ATH in Total 2 opens the door for exponential price discovery.
Key resistance zones: $2T → $3.5T → $5T
Watch for volume surge + BTC.D breakdown for strong confirmation.
Caution:
Not every BTC.D dip leads to an Altseason fakeouts happen. Confirm with Total 2 strength and sector rotation.

Cycle Last LegThis present cycle is near its end. Pico top will arrive soon, probably by the end of November. BTC is currently ranging (103-109) forming a new base at 106, which is the current point of control. The start of the next and final up leg should start early July, so we have less than 2 weeks to remain patient.
Stand fast. Keep faith. Remain vigilant.

BTCUSD:Technical Analysis and OutlookIn the recent trading session, Bitcoin exhibited an upward trend; however, it subsequently experienced a significant decline from the established Mean Resistance level at 110300. On Friday, Bitcoin exhibited notable price action, characterized by a pump-and-dump scenario. At this juncture, Bitcoin is retracing downwards as it seeks to approach the Mean Support level at 101500 and the ultimate Inner Coin Dip at 96500. It is essential to acknowledge the potential for an upward rally from the Mean Support levels of $101500 and/or the Inner Coin Dip at $96500. Such a rally could culminate in a retest of the Mean Resistance level at $107000.

AERO: Clears the Runway! Can it gain altitude!?AERO gave a valid long setup
We were eye a possible retrace of an impulsive move and it displayed enough to trigger a rules-based entry.
Technical Breakdown
Key structural elements supported the setup:
Initial leg up showed impulse-like behavior
Pullback found support at a clearly defined AOI
Multiple MLT levels aligned with a common zigzag framework
Swift bounce off the Golden Corner Pocket (GCP)
Break and close above 0.54 completed the impulse structure
Prior resistance flipped into support
Volume confirmed the move, and price reached the first algo target, producing a reactive wick and confirming potential of algo activity.
This created a textbook TDU-style GCP/Algo/C-3 setup with measured entry and exit.
Risk Management
Partial profit was taken at the first MLT zone
Stop loss was moved into profit post-structure break
Scenario planning:
If move continues: positioned
If move stalls as a larger zigzag: no loss
Outlook
Attention now shifts to the next actionable level, possible second entry long
0.62 is the AOI for re-entry atm
Ideal scenario = Continuation in a wave 3, obvi
Alt scenario = Clean corrective to AOI + long
Bear scenario = Zig Zag complete
Conclusion
The trade played by the book!
Confluence across AOI, GCP, MLT, and volume created a qualified entry — not a guess.
This remains a great example of structure over sentiment and waiting for the market to meet criteria before engaging.

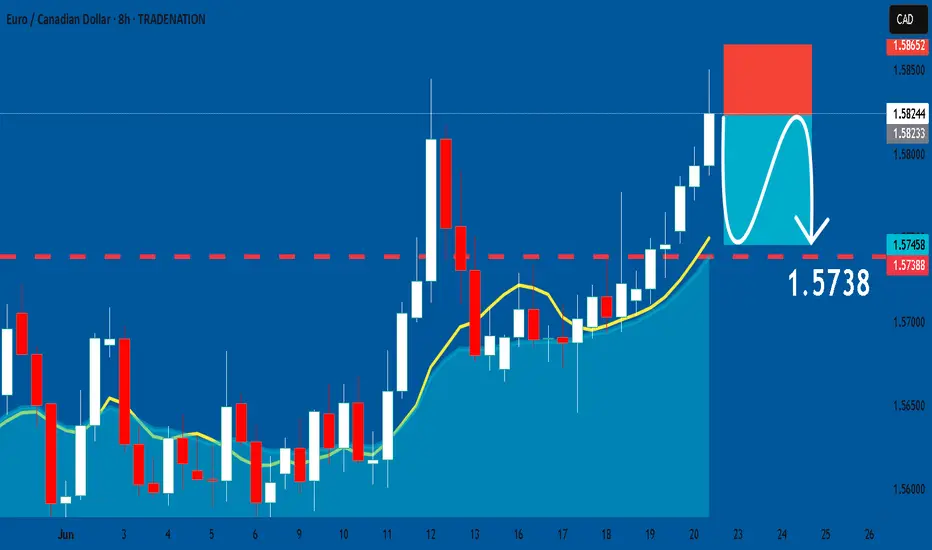
EURCAD: Short Trade Explained
EURCAD
- Classic bearish pattern
- Our team expects retracement
SUGGESTED TRADE:
Swing Trade
Sell EURCAD
Entry - 1.5823
Stop - 1.5865
Take - 1.5738
Our Risk - 1%
Start protection of your profits from lower levels
Disclosure: I am part of Trade Nation's Influencer program and receive a monthly fee for using their TradingView charts in my analysis.
❤️ Please, support our work with like & comment! ❤️
NATGAS Will Collapse! SELL!
My dear friends,
Please, find my technical outlook for NATGAS below:
The instrument tests an important psychological level 3.896
Bias - Bearish
Technical Indicators: Supper Trend gives a precise Bearish signal, while Pivot Point HL predicts price changes and potential reversals in the market.
Target - 3.662
Recommended Stop Loss - 4.034
About Used Indicators:
Super-trend indicator is more useful in trending markets where there are clear uptrends and downtrends in price.
Disclosure: I am part of Trade Nation's Influencer program and receive a monthly fee for using their TradingView charts in my analysis.
———————————
WISH YOU ALL LUCK

FILUSDT - short-term rally is upon ushi traders,
FILUSDT looks good for a short-term rally.
The regular bullish divergence formed.
Risk-Reward ratio: 6,67
Target: 2,74$
It may be a quick move.
I expect it to happen within the next 7 days.
Good luck

LCID SHORT-SELL ANALYSIS – JUNE 21, 2025 (NASDAQ 100 | S&P 500) LCID SHORT-SELL ANALYSIS (U.S STOCK)
LCID has been in a persistent downtrend, respecting a long-standing resistance line (marked with a black dotted line). Following a sharp decline, the stock entered a brief consolidation phase before breaking lower, forming a classic bearish flag pattern. This pattern typically signals continuation to the downside.
Given this technical setup, we anticipate further downward momentum, with targets derived from quantified displacements and underlying support zones.
🚨 TECHNICAL SHORT SELL CALL – LCID 🚨
Short Sell Levels:
Short Sell 1: $2.19 (current level)
Short Sell 2: $2.37
Short Sell 3: $2.50
Target Prices:
TP 1: $1.99
TP 2: $1.70
TP 3: $1.40
TP 4: $1.09
TP 5: $0.77
Stop Loss (Closing Basis): Above $2.60 | Risk Reward Ratio: 1:5.4
Caution:
Please short sell in 3 parts within the selling range. Close at least 50% of your position at TP1 and trail the stop loss to protect profits in case of unforeseen market conditions.

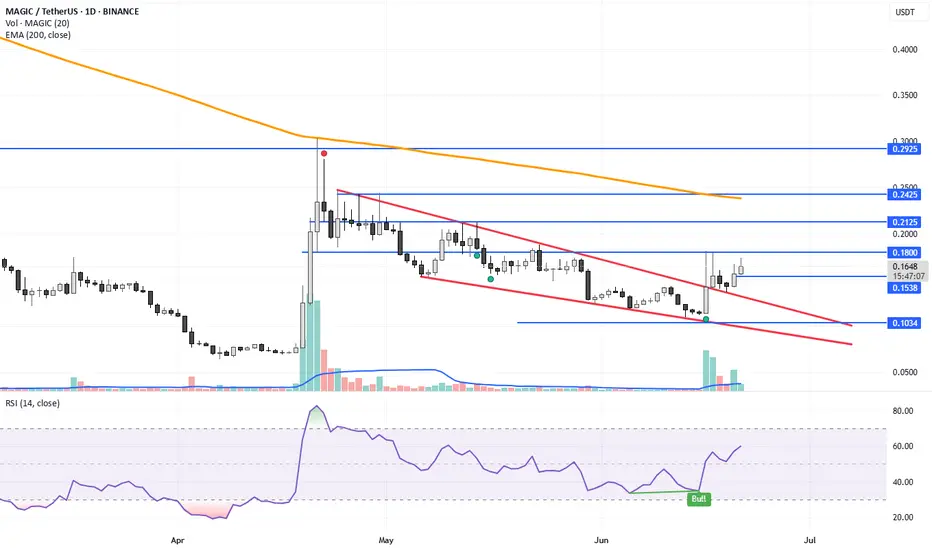
magic usdt 5x long term 100% gain shorter timealready borken the resistance with daily candle
Can buy now 0.1538 - 0.1800
for long term holding
can get 100% in the short time
if u hold longer can be 5x easily
No need stop loss.
but if u want then use SL: 0.100
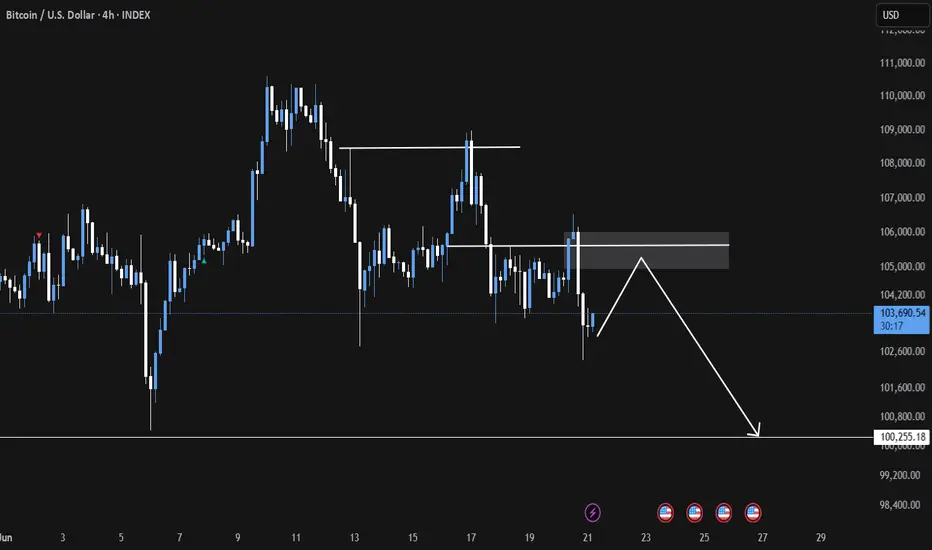
Bitcoin Market Analysis | Bitcoin Order Flow Turns Bearish Bitcoin Order Flow Turns Bearish
Bitcoin's order flow has shifted decisively to the bearish side. Price is consistently treating each down-closed candle as resistance, leading to a series of downward pushes.
The daily order block (OB) has effectively rejected price, aligning with the overall bearish tone and triggering a continuation toward lower levels.
Currently, price action appears to be targeting the sell-side liquidity near the $100,000 mark.
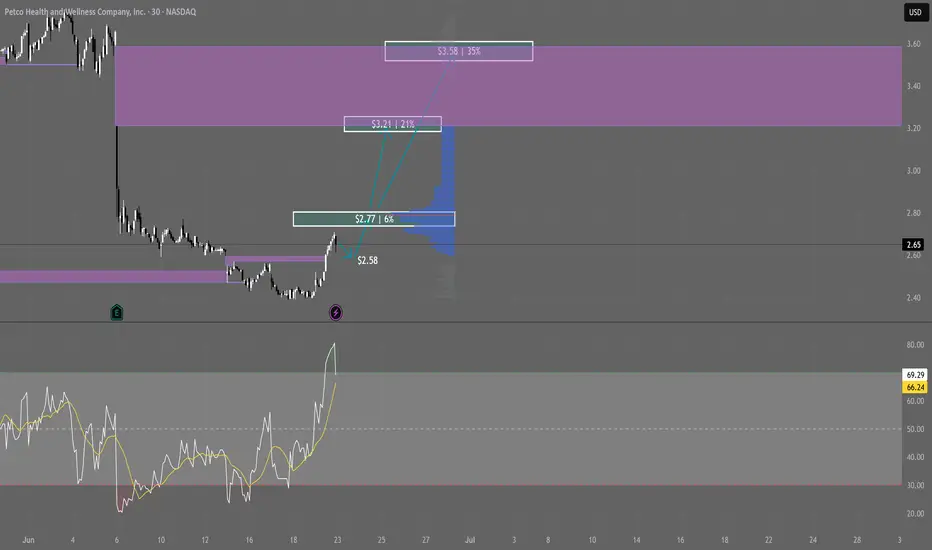
WOOF - The Next Big JumpAs we approached Friday today, we saw a strong rally of WOOF as it closes the $2.50 gap, putting us 2.70 as the market closed. What a beautiful way to finish off the week.
As next week approaches, here are the important prices to watch out for:
- As the day ended, we saw a huge selling pressure as RSI reached 80 (Indicating that it is very overbought). What this means is that we could see price decrease down to the $2.58 line. Personally, I have loaded WOOF at $2.44 and own about 300 shares, and I would be buying at least 300 more as price touches this line again.
- Next week, if buying pressure continues, I would be looking to sell half of my holdings at $2.77. This would mean a 6% increase from today's close. We would see resistance at this level as it has faced multiple resistance at this level. The reason for selling is to mitigate risk. Earning less money is still earning money, and if the bullish trend continues, we could always re-enter.
- Nearing the end of the week, I predict WOOF returning back and closing up the huge gap it made on June 6th. This would mean a closing price of $3.21 which is a 21% increase from the current price. My initial point of interest would be the bottom of the gap, as WOOF price reached the bottom of gaps almost 95% of times.
- The best scenario that we all hope to achieve is to see WOOF reach $3.58, which would be a 35% increase as of the current price. This price would take longer to achieve as well... we still got a long ways to go. I don't think we will be seeing that for another two weeks.
My sentiment on WOOF is extremely bullish. Just for reference, this company that has beat 5 out of 6 earnings, an eps that has increased every single time, P/S of 0.12, and an insider holding of 51.77% tells me that this company has a very solid foundation. In addition, WOOF has always held on on the $2.50 dollar range before (March 2025, August 2024) which tells a strong reversal is about to happen.
Of course what I wrote here is not financial advice and of course this post would be slightly skewed to the bullish side as well... I'm bullish. This post, like any other of my posts, are to help other traders who have a similar sentiment as I do but aren't really aware of the key points of resistance of the stock. Please, before any trade, do your own research and that there is always a risk of losing money.
Have an AMAZING weekend traders and GOOD LUCK!
Neutral environmentThe Friday close on the S&P 500 daily chart created a neutral environment going into a weekend with the least high tension situation. Be prepared for the potential for high volatility.

BEAM The stock chart for Beam Therapeutics Inc. (BEAM) displays an ascending triangle pattern, a bullish continuation signal. The target price of $24.45, marked on the chart, suggests a potential 45-46% upside, calculated by adding the triangle’s height (approximately $4.87) to the breakout level, with an expected path involving initial confirmation above $16.87, a steady rise toward $20.00, and further gains toward the target over days to weeks. Key resistance levels to watch are $20.00 and $22.00, with support at $16.87 and the rising trendline, though the stock’s movement may be influenced by market conditions, biotech sector trends, and company-specific news, with potential for volatility and pullbacks along the way.

Nice chart AMD profit zoneGreen zone, up vs down performance. AMD is underforming this year giving us a chance to invest in AI company with great outlook going fwd.

BITCOIN SUPPORT AHEAD|LONG|
✅BITCOIN is set to retest a
Strong support level below at 101,000$
After trading in a local downtrend for some time
Which makes a bullish rebound a likely scenario
With the target being a local resistance above at 105,000$
LONG🚀
✅Like and subscribe to never miss a new idea!✅
Disclosure: I am part of Trade Nation's Influencer program and receive a monthly fee for using their TradingView charts in my analysis.

My buy view for BlackBerryMy buy view for BlackBerry.
This stock has pushed up about 60% following the draw down from the US tariff.
I am still bullish on this stock.
My buy thoughts are on the chart

Bitcoin Cash, Anomaly or Predictive Signal?Some people can say that Bitcoin Cash right now is simply an anomaly, nothing to see here. But a closer look reveals nothing abnormal, more likely a very strong predictive signal that supports what we saw happening with the COIN stock and what was predicted recently to happen with ETHUSDT (Ethereum), that is, a very strong bullish breakout is the next main major market move.
Good morning my fellow Cryptocurrency trader, I hope this day finds you well.
How are you feeling?
Introduction —The market is one
In isolation, the market is tricky and hard to predict. Within a bigger context, we can easily predict what will happen next. Just look at Bitcoin Cash, it shows exactly what will happen because it has been being in perfect syntony with the rest of the market.
Many pairs are consolidating or retracing. My view is that a bullish move comes next.
Let's see how Bitcoin Cash has been behaving lately and compare this to the rest of the market. The fact that it is bullish now predicts that also the other pairs will be bullish because they are moving in the exact same way.
Price action —Past history
A crash ends in early August 2024. By late 2024 the action goes bullish. November 2024 marks the start of a month long advance that ends December 2024. This is true for most of the altcoins market.
The December 2024 peak leads to a correction with the main low happening 3-February. Another low and market bottom happens 7-April 2025. From this point on, we have a recovery and after a high in late May, the market goes into retrace.
Present day
This retrace is where we are today for most of the pairs. 100% of these are trading within a higher low compared to 7-April. Here BCHUSDT ended its retrace and moved ahead of the pack to hit a higher high compared to May. It also produced the highest price since January 2025.
The future
This is not an anomaly. Bitcoin Cash's price action simply reveals what is coming to the rest of the market. As it moved in perfect synchrony with other projects for months or even years, it will continue to do the same. The fact that it is trading higher now, means the other pairs will follow, in fact, some other pairs are already there; a bullish continuation.
Soon everything will grow.
Thank you for reading.
Namaste.

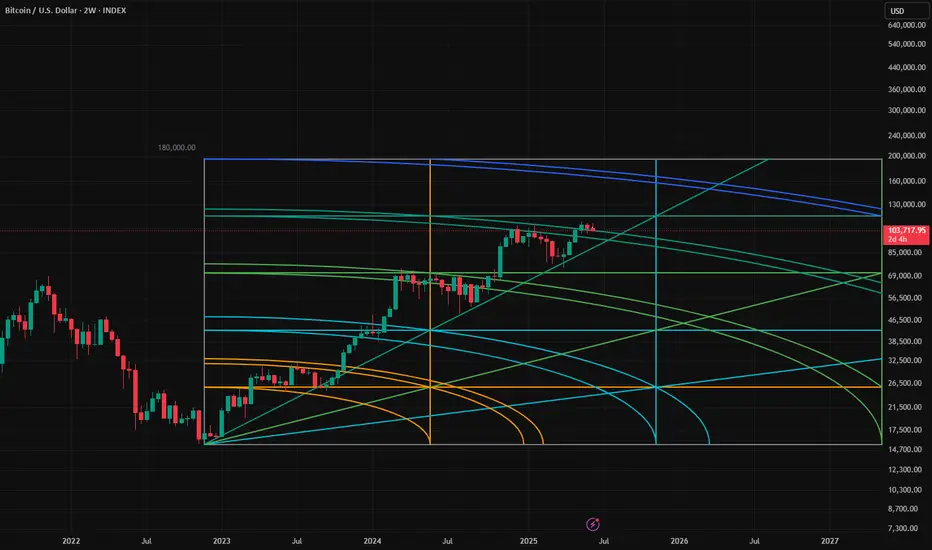
Bitcoin will go to it's next arc for sure around 170K!Btc will gravitate to the next arc After this consolidation!
XAUUSD Broken from ascending channel with big bearish candle📉 XAUUSD (Gold) Technical Breakdown – 1H Time Frame
Gold has broken down from the hourly bullish channel and is showing strong selling pressure.
💥 Sell Entry: 3365
🎯 Targets:
1️⃣ 3345
2️⃣ 3323
3️⃣ 3295
Bearish momentum is building—watch these levels closely for potential moves.
📊 Like, Follow, and Comment 💬
🚀 Join us for more live trade ideas and updates!
By Livia 😜

Solana is cookedYou can clearly see that in the monthly timeframe, CRYPTOCAP:SOL retests the support trendline after breaking it and now, it's joever - Solana is now cooked.

DAX weekly Analysis
As per OMFA strategy which is hybrid of Volume profile, ICT, Price action, and chart pattern, here is the DAX weekly Analysis.

Chartanalyse: Der Chart zeigt eine Seitwärtskonsolidierung mitTechnical Overview:
The EUR/USD chart exhibits signs of a bearish reversal pattern forming near a key resistance zone (1.15800 - 1.16000), highlighted with repeated rejection wicks (🔴 red arrows). Price is currently trading at 1.15222, after failing to hold above the neckline of the rounded bottom pattern.
🔍 Key Observations:
🔺 Resistance Zone: Strong resistance has been confirmed multiple times (red arrows), indicating sellers are active at the top.
🟠 Double Top / Head & Shoulders Behavior: Price action shows topping formations (highlighted with orange circles), suggesting exhaustion of bullish momentum.
📉 Bearish Breakdown Possibility:
Price rejected near neckline and is showing bearish candle formations.
Breakdown from the current consolidation zone could push price toward the target zone at 1.14491, marked in purple.
This aligns with previous support structure, reinforcing a technical downside projection.
🔻 Support Zone: Around 1.13800 - 1.14000 is a strong area of demand and may act as the next bounce point if the bearish move continues.
📐 Chart Pattern Structure:
Rounded bottom formed earlier, but the failure to continue higher and breakout suggests a false breakout trap for buyers.
Downward sloping trendline broke, but now price is struggling to sustain above previous highs.
📌 Conclusion:
⚠️ Caution for bulls as price shows signs of weakness at resistance. A move below 1.15000 may initiate further downside toward 1.14491 and possibly lower. Short-term traders can watch for confirmation candles near this zone for entries.
📅 Short-Term Bias: Bearish
🎯 Target: 1.14491
⛔️ Invalidation: Strong breakout above 1.16000
