Gold will continue to fall on the last day of this week!
New low in Asian session, bottomed out and rebounded in European session. Currently rebounding to 3360 is blocked.
It is recommended to sell at 3360-3370, increase positions near 3373 and 3376, and target 3355-3345!
Chart Patterns

Live Trade hello friends✋️
Considering the price drop, you can now see that we are in important support and now we can take advantage of this situation and enter into a transaction with risk and capital management.
🔥Follow us for more signals🔥
*Trade safely with us*

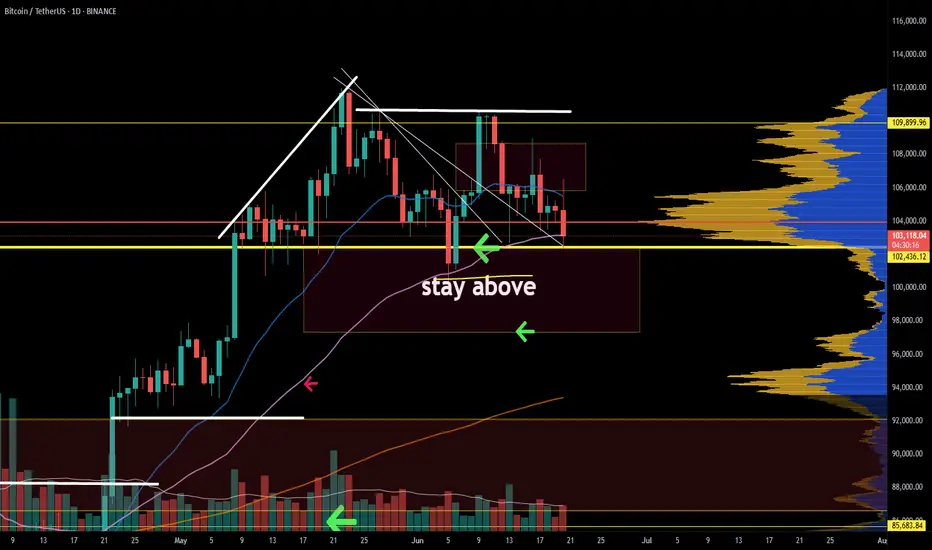
BTC has made the perfect market conditions for a trade. BTC setup is very clear. Why? Because the structure is clear. The current price is an inflection point; both bears and bulls are watching to make their next move. May the strongest of the two prevail. 95k or 110k?
Full TA: Link in the BIO
NEXTNAV has broken out!NASDAQ:NN has broken out of it's blue arc and will gravitate to it's next one. This can take some months!

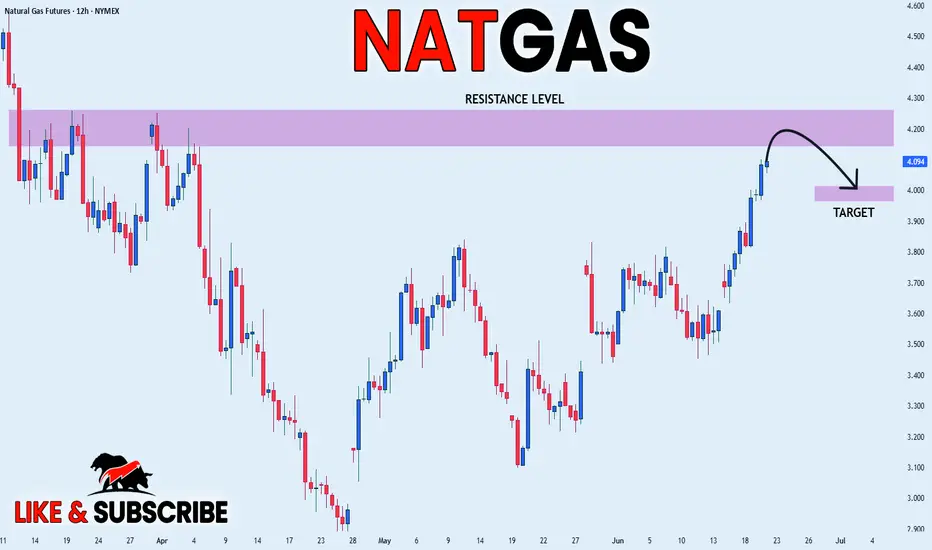
NATGAS STRONG RESISTANCE AHEAD|SHORT|
✅NATGAS has been growing recently
And Gas seems locally overbought
So as the pair is approaching
A horizontal resistance of 4.256$
Price decline is to be expected
SHORT🔥
✅Like and subscribe to never miss a new idea!✅
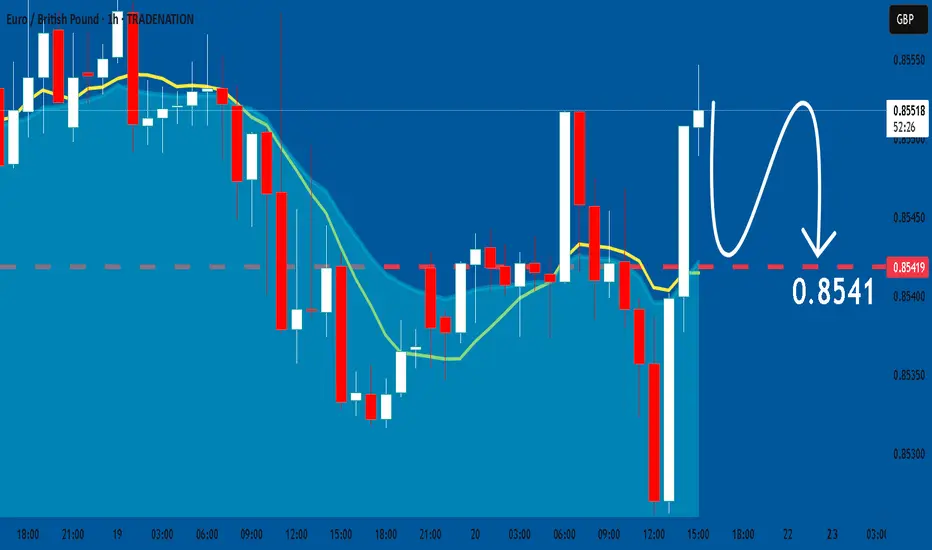
Disclosure: I am part of Trade Nation's Influencer program and receive a monthly fee for using their TradingView charts in my analysis.
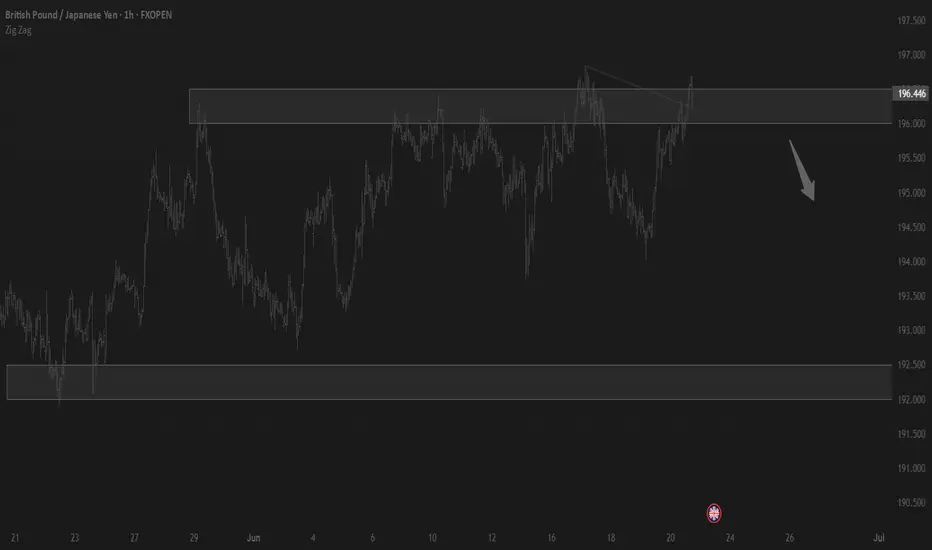
CHECK GBPJPY SIGNAL READ CAPTAINEntry: around 196.550) 196.450✅
Take Profit 196.150 ✅
Take Profit 2: 195.600✅
Last Target:195.100 ✅
Stop Loss: 197.000❌

Crude Oil BreakoutOil has been in a descending wedge pattern for quite a while, the last 19 months or so. It is just now breaking out, price target is between $100-$110 a barrel but could go higher we will have to see how inflation progresses.

Falling towards 50% Fibonacci support?The Loonie (USD/CAD) is falling towards the pivot which acts as an overlap support that lines up with the 50% Fibonacci retracement and could bounce to the pullback resistance.
Pivot: 1.3651
1st Support: 1.3581
1st Resistance: 1.3735
Risk Warning:
Trading Forex and CFDs carries a high level of risk to your capital and you should only trade with money you can afford to lose. Trading Forex and CFDs may not be suitable for all investors, so please ensure that you fully understand the risks involved and seek independent advice if necessary.
Disclaimer:
The above opinions given constitute general market commentary, and do not constitute the opinion or advice of IC Markets or any form of personal or investment advice.
Any opinions, news, research, analyses, prices, other information, or links to third-party sites contained on this website are provided on an "as-is" basis, are intended only to be informative, is not an advice nor a recommendation, nor research, or a record of our trading prices, or an offer of, or solicitation for a transaction in any financial instrument and thus should not be treated as such. The information provided does not involve any specific investment objectives, financial situation and needs of any specific person who may receive it. Please be aware, that past performance is not a reliable indicator of future performance and/or results. Past Performance or Forward-looking scenarios based upon the reasonable beliefs of the third-party provider are not a guarantee of future performance. Actual results may differ materially from those anticipated in forward-looking or past performance statements. IC Markets makes no representation or warranty and assumes no liability as to the accuracy or completeness of the information provided, nor any loss arising from any investment based on a recommendation, forecast or any information supplied by any third-party.

BTC-bias shortBearish indications:
Trend line support broken.
Major support broken.
Evening star candle in 4 hr before the support break.
Made a new low.
MA 21 being respected in 5 min.
formation of HS in 5 min while support break.
Bullish indications:
Bullish divergence in 15 min.
Trade plan bias short @ 103880
SL:104725
TP1:102970
TP2:102188
TP3:101351

Update on DOGE chart after Apr 7th heavy bleeding🔮 Short-Term Forecast (1–7 Days)
🧱 Base Case Scenario (Most Likely — 60% probability)
If DOGE holds above $0.14, builds support and gradually climbs toward $0.155–$0.16.
Could form a mini bull flag or W-bottom on the 4H/daily.
RSI levels will normalize in the 50–60 zone. This sets up a second leg of recovery — possibly to $0.165–$0.172. ((This is most likely if BTC stays above $72K+ and consolidates.))
🐻 Bearish Continuation (20% probability)
If DOGE rejects from $0.15–$0.155, forms lower high, and BTC breaks back down to test FWB:67K or $65K. In that case, DOGE can retest $0.13 or even wick into the $0.12s. Possible liquidation traps below $0.13.
Monitor BTC dominance: if it spikes, alts like DOGE suffer more.
🚀 Bullish Breakout (20% probability)
If BTC reclaims $80K and surges toward ATH ($85K+), DOGE could: Break above $0.165 and push quickly to $0.18–$0.19. Reignite interest and flip the trend.
📈 Levels to watch
Price Action Reason
$0.14–0.145 Watch support If it holds = accumulation zone
$0.172–0.18 Strong resistance Reclaim = full trend reversal confirmed
🧘♂️ Psychological Edge
The Fear Index was at 17: Usually marks bottoms, not tops.
RSI recovery = healthy reversal start.
High volume + strong candle = whales likely already bought.

MICROSOFT: 1D Golden Cross to slingshot it to $590MSFT turned overbought on its 1D technical outlook (RSI = 73.199, MACD = 13.580, ADX = 52.584), extending the rise to a new ATH today, having formed a 1D Golden Cross on June 9th. That was the first 1D Golden Cross since March 20th 2023, which validated a bullish extenstion to +71.50% from the bottom. Since the long term Channel Up has already started its new bullish wave, we are expecting the uptrend to continue up to +71.50% at least. Go long, TP = $590.
## If you like our free content follow our profile to get more daily ideas. ##
## Comments and likes are greatly appreciated. ##

Will Nike’s Upcoming Earnings ‘Just Do It’ for Investors?This hasn’t been the greatest year for Nike NYSE:NKE , which will report earnings next Thursday at a time when the stock is down more than 20% year to date. What does technical and fundamental analysis say might happen to the stock from here?
Let’s take a look:
Nike’s Fundamental Analysis
NKE ended Wednesday down 21.4% year to date, and last year wasn't so hot for the athletic-gear giant, either. Shares fell 30.3% over 2024 as a whole.
In fact, it’s been a tough decade so far for Nike, a one-time Wall Street darling.
All in, the stock has fallen some 66.8% since peaking at $179.10 in November 2021. Gross.
Things got so bad that former CEO John Donahoe "retired" in October 2024 -- a retirement that the firm’s board graciously “agreed” to.
The board then pulled in Nike veteran Elliott Hill, who had retired in 2020 after 32 years with the firm, off of the bench to serve as the company’s new CEO.
While it's still early, Hill hasn’t worked much magic so far for the stock, either.
Nike shares have struggled since March, when the firm beat analyst expectations for its fiscal Q3 earnings and revenues but provided poorly received forward guidance.
As for next week’s fiscal Q4 results, the Street is looking for NKE to report just $0.11 of GAAP earning per share on roughly $10.7 billion of revenue.
That would compare badly to the $0.99 of EPS on $12.6 billion of revenues that Nike saw in the same period last year -- an 88.9% decline in earnings per share and about a 15% drop in sales.
In fact, of the 23 sell-side analysts that I’ve found that track the stock, 21 have revised their fiscal Q4 earnings estimates lower since the quarter began. Only two have moved their forecasts to the upside.
Nike’s Technical Analysis
Now let's take a look at NKE’s chart going back some four months:
Readers will see that from early April through mid-June, Nike developed a so-called “rising-wedge” pattern of bearish reversal, marked with purple shading and a red box in the chart above.
Late last week, shares broke through the wedge’s lower trend line at about $62, which is the pivot point here.
Nike also recently gave up its 21-day Exponential Average (or “EMA,” marked with a green line above). That’s likely turned some swing traders against the stock for now.
The stock will now have to look to its 50-day Simple Moving Average (or “SMA,” denoted above with a blue line) for support. That’s at $59.50 in the chart above, but NKE was trading at $59.51 on Friday afternoon as I wrote this.
Should that line crack as well, a certain percentage of portfolio managers would likely have their risk managers force them to reduce long-side exposure to the stock.
But interestingly, readers will also note that from Nike’s late-February high to its early April low, shares hit resistance at the 38.2% Fibonacci retracement level of that move twice -- first in mid-May and then again a month later. This typically implies that there are probably institutional sellers at that level.
Looking at NKE’s other technical indicators, the stock’s Relative Strength Index (the gray line at the chart’s top) is on the weak side of neutral here. It’s not awful, but it also isn’t positive.
Worse, Nike’s daily Moving Average Convergence Divergence indicator (or “MACD,” marked with blue bars and black and gold lines at the chart’s bottom) is postured quite bearishly.
Within that indicator, the 9-day EMA (the blue bars) stands below zero, while the 12-day EMA (the black line) has crossed below the 26-day EMA (the gold line). Those are all typically negative technical signals for a stock.
(Moomoo Technologies Inc. Markets Commentator Stephen “Sarge” Guilfoyle had no position in NKE at the time of writing this column.)
This article discusses technical analysis, other approaches, including fundamental analysis, may offer very different views. The examples provided are for illustrative purposes only and are not intended to be reflective of the results you can expect to achieve. Specific security charts used are for illustrative purposes only and are not a recommendation, offer to sell, or a solicitation of an offer to buy any security. Past investment performance does not indicate or guarantee future success. Returns will vary, and all investments carry risks, including loss of principal. This content is also not a research report and is not intended to serve as the basis for any investment decision. The information contained in this article does not purport to be a complete description of the securities, markets, or developments referred to in this material. Moomoo and its affiliates make no representation or warranty as to the article's adequacy, completeness, accuracy or timeliness for any particular purpose of the above content. Furthermore, there is no guarantee that any statements, estimates, price targets, opinions or forecasts provided herein will prove to be correct.
Moomoo is a financial information and trading app offered by Moomoo Technologies Inc. In the U.S., investment products and services on Moomoo are offered by Moomoo Financial Inc., Member FINRA/SIPC.
TradingView is an independent third party not affiliated with Moomoo Financial Inc., Moomoo Technologies Inc., or its affiliates. Moomoo Financial Inc. and its affiliates do not endorse, represent or warrant the completeness and accuracy of the data and information available on the TradingView platform and are not responsible for any services provided by the third-party platform.

SOL/USDT LONG OPPORTUNITY Looking at the current structure of SOL/USDT and the Fib retracement, there's the likelihood that price will get to the 0.618 area where there will be a great opportunity to LONG


COIN: Weekly Cup & Handle Setup• Long-Term Bullish Trend and Pattern : The price action for COIN exhibits a clear long-term bullish trend, contained within an ascending channel (demarcated by the green and red dashed trendlines). A prominent "Cup and Handle" pattern appears to have developed, with the blue arc delineating the "cup" phase and the subsequent period of consolidation forming the "handle."
• Current Consolidation and Key Levels : Following the completion of the "cup" and a test of its rim, the price has entered a consolidation phase, depicted as a descending channel (white box) which constitutes the "handle." The current price is positioned near the upper boundary of this consolidation, resting above an "Intermediate support" level at $270 and a "Short-term Support" zone between 220- 230.
• Defined Support and Resistance Zones : Multiple significant horizontal support and resistance levels are identified. Stronger, more historical support zones are marked at 145−165 and 115−130. Overhead, a "Key Resistance Level" at $350 coincides with the cup's prior high, representing a major hurdle for further upside.
• Projected Price Pathways : The chart outlines an implied bullish continuation scenario (purple dotted path) where the price breaks out of the handle consolidation. This projected path targets immediate levels around 290−300, followed by a potential retest and breach of the $350 key resistance, with a subsequent "Long-Term Target" set at approximately $430 within the confines of the primary ascending channel.
Disclaimer:
The information provided in this chart is for educational and informational purposes only and should not be considered as investment advice. Trading and investing involve substantial risk and are not suitable for every investor. You should carefully consider your financial situation and consult with a financial advisor before making any investment decisions. The creator of this chart does not guarantee any specific outcome or profit and is not responsible for any losses incurred as a result of using this information. Past performance is not indicative of future results. Use this information at your own risk. This chart has been created for my own improvement in Trading and Investment Analysis. Please do your own analysis before any investments.

HelenP. I Gold can rise to resistance level and drop to $3325Hi folks today I'm prepared for you Gold analytics. After a steady climb, the price began to lose momentum and eventually corrected back to the trend line. This zone acted as dynamic support and initiated a new wave of upward movement. However, unlike the previous impulse, the price started consolidating within a symmetrical triangle, signaling indecision and weakening bullish pressure. Now the structure is tightening near the resistance zone, where the price has already been rejected multiple times. The market appears to be preparing for another interaction with the resistance level around 3430. Given the overall context, fading bullish energy, repeated rejections, and the triangle formation, I expect the price to test the resistance one more time before reversing downward. My goal is the trend line support, which aligns with 3325 points. This zone offers a logical area for the price to move next, especially considering the limited momentum above and the growing risk of breakdown inside the triangle. If you like my analytics you may support me with your like/comment ❤️
Disclaimer: As part of ThinkMarkets’ Influencer Program, I am sponsored to share and publish their charts in my analysis.

I have been waiting to get my signal on HBAR and finally got it!Trading Fam,
I know my crypto portfolio is getting destroyed as I prepare for a future altcoin run towards the latter half of this year. And it sucks. Bitcoin hodl'ers definitely look like the true champions at this point outpacing us altcoin traders by a huge margin. However, I've been through this before. Multiple times. And I know that when they run, altcoins will more than make up for our losses and pay massive dividends. We simply have to remain patient and stick to our strategy which is to continue to look for those great entries into some of our larger cap altcoins. So, that is what I'll do until one of two things occurs: A) either my portfolio dies completely or B) I am able to prove that altcoin traders can eventually beat the Bitcoin hodl'ers. It will be option "B". That's my final answer.
You get to watch all this unfold. And fortunately for you, I am the guinea pig. If you want to join me in these trades, you have that option. If you want to sit by and watch this entertainment, which admittedly hasn't been pretty as of late, you can do that too. But, in my heart of hearts, I believe our strategy will eventually pay off.
With that said, I've long been waiting for my indicator to give me the signal on this outstanding altcoin, HBAR. I mean, it's been months. The last time it flashed green for me we went from 12 cents to 24 cents. Unfortunately, my cash reserves were locked up in other trades. Today is different.
I've entered this trade at around 15 cents. My first target will be 17 cents. My final target will be 23 cents giving us more than 50% profit if achieved.
On the technical side, you can see that we have entered a beautiful area of large liquidity. This is where buyers typically step in. My bet is that they will do so again to break us to the upside of that descending trendline taking us at least to our VRVP point of control on this chart (yellow line).
I know that it is not easy trading alts in this volatile political/geopolitical global environment we have somehow sadly inherited. But I have to remain optimistic that the collective good in man will eventually prevail over the corrupt and mostly misanthropic characters we call "leaders". Once these tides begin to shift and show, massive energy will propel us onward and upward into the future. I believe cryptocurrency will help in this shift. What we will then witness will be like nothing we've seen before. This remains my hope as I continue to tread these perilous trading waters.
✌️ Stew

USDCHF Analysis – "Dollar Trying to Break Free from Downtrend"USDCHF is breaking out from a multi-week descending channel.
Structure shows a potential trend reversal from the June 12th low.
First bullish leg may target the 23.6% Fib level at 0.8266, followed by an extended move toward 0.8355.
Key resistance: 0.8266 and 0.8355 (Fib levels)
Stop loss: around 0.8093–0.8056 zone (previous support and breakout base)
Structure Bias: Bullish breakout after prolonged downtrend – confirmation depends on sustained move above 0.8200
📊 Current Bias: Cautiously Bullish
🧩 Key Fundamentals Driving USDCHF
USD Side (Mildly Bearish to Neutral):
FOMC held rates, Dot Plot showed only one cut expected for 2025, but Powell’s tone was less hawkish.
US Retail Sales soft, and PPI/CPI showed signs of inflation cooling.
Recent risk-off sentiment (Middle East, oil spikes, equity volatility) supports the USD.
Trump commentary and 2025 election anticipation bring long-term uncertainty.
CHF Side (Strong but potentially weakening):
SNB held rates steady, with cautious tone—no urgency to hike again.
Safe-haven flows still support CHF, but waning inflation and stronger global equity market might reduce CHF appeal.
SNB has hinted at FX intervention readiness, which could weaken CHF if necessary.
⚠️ Risks That May Reverse or Accelerate Trend
False breakout risk if 0.82 fails to hold → deeper pullback toward 0.8090
Stronger CHF demand on geopolitical fear (Israel–Iran, Ukraine)
Unexpectedly weak US data this week or renewed Fed dovish talk
🗓️ Important News to Watch
US: Core PCE, GDP revision (June 27), jobless claims
CHF: Swiss CPI, SNB FX intervention chatter
Risk sentiment: Iran/Israel tensions, equity volatility, Trump Fed commentary
🏁 Which Asset Might Lead the Broader Move?
USDCHF could mirror sentiment across CHF pairs—if risk-on resumes and CHF weakens across the board (EURCHF, NZDCHF also rallying), USDCHF may accelerate higher.

EURGBP: Bearish Forecast & Outlook
The charts are full of distraction, disturbance and are a graveyard of fear and greed which shall not cloud our judgement on the current state of affairs in the EURGBP pair price action which suggests a high likelihood of a coming move down.
Disclosure: I am part of Trade Nation's Influencer program and receive a monthly fee for using their TradingView charts in my analysis.
❤️ Please, support our work with like & comment! ❤️
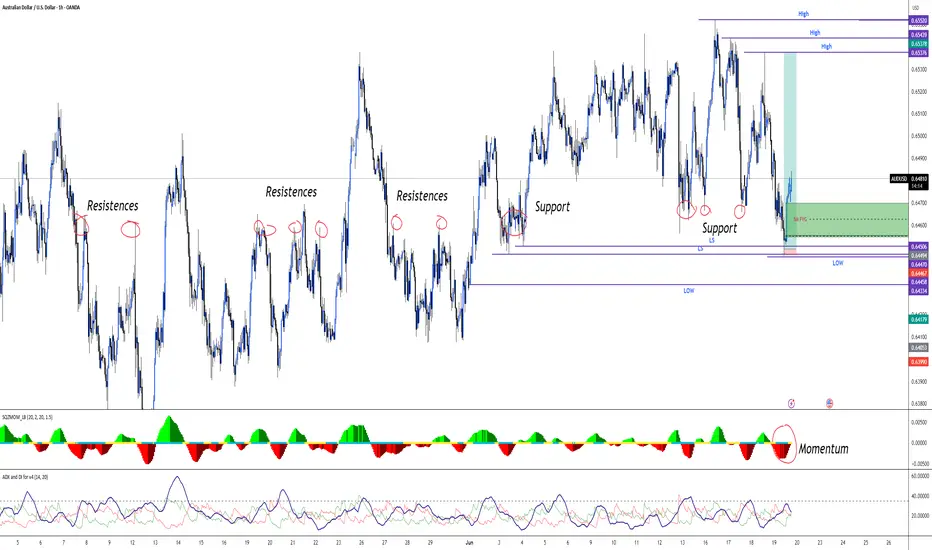
Institutional Manipulation or Perfect Setup? | AUDUSD🎯 This is a 🔥 setup no one’s talking about...
AUDUSD is quietly setting up for something big, and if we apply the VEP Trader – Liquidity Option Strategy, it could deliver a clean high-probability entry.
📍 Trend Overview (1D)
On the daily timeframe, AUDUSD shows a weak bullish trend, but here's what stands out...
The candle on June 18 swept liquidity from 5 previous days:
📅 June 3
📅 June 4
📅 June 13
📅 June 17
📅 June 18
This is a textbook case of institutional liquidity grab. 😮
💧 What Does VEP Trader Tell Us?
When price clears multiple daily lows/highs in a single candle, our strategy flags it as a potential reversal zone.
📸 If you switch to the 1-hour timeframe, you’ll notice something massive:
A huge institutional gap from 0.64554 to 0.64700, exactly where price left behind liquidity.
🚨 What Are We Watching For?
We’re looking for a potential pullback into that gap, alongside:
A bullish divergence on momentum
Support zones holding from previous reactions
Confirmation via Squeeze Momentum
If these align... the opportunity is 🔥.
🎯 Do You See What I See?
👉 Was this manipulation, or just clean price action?
Drop your thoughts in the comments.
Setups like this don’t show up every day — but when they do, you better be ready.
#AUDUSD
#VEPTrader
#LiquiditySweep
#FairValueGap
#SmartMoneyConcepts
#ForexSetup
#PriceActionTrading
#InstitutionalTrading
#CleanStructure
#ForexWatchlist
#GapTrading
#TradingBreakdown
#MomentumDivergence
#RiskRewardRatio
#TradeWhatYouSee
#LiquidityZones
#ForexReversal
#SqueezeMomentum
#TechnicalAnalysis
#ForexOpportunities
#ReversalTrade
#ScalpingSetup
#DayTradingForex
#ForexStrategy
#ForexTraderLife
Trading balanceTrading balance The price of the asset has rebounded from the balance zone. With the prospect of growth into the resistance zone.
BEMLNSE:BEML
Note :
1. One should go long with a Stop Loss, below the Trendline or the Previous Swing Low.
2. Risk :Reward ratio should be minimum 1:2.
3. Plan your trade as per the Money Management and Risk Appetite.
Disclaimer :
>You are responsible for your profits and loss.
>The idea shared here is purely for Educational purpose.
>Follow back, for more ideas and their notifications on your email.
>Support and Like incase the idea works for you.

ORDI/USDT – Bullish Falling Wedge Formation!!Hey Traders — if you're into high-conviction setups with real momentum, this one’s for you.
ORDI is forming a bullish falling wedge pattern and is currently consolidating near crucial support. The price is showing initial signs of breakout potential.
Here's the trade plan:
Entry: $7.20–$7.70
Targets: $9.20 / $10.50 / $11.90
Stop Loss: $6.50 (Strict)
Excellent risk-to-reward opportunity here. Keep your stops tight and manage your risk wisely.
