ETH: Hardly Any Volatility Not much has happened for Ethereum since yesterday. According to our primary scenario, wave B in turquoise should imminently push higher, theoretically up to resistance at $4,107. Once these corrective rises conclude, wave C should take over, driving ETH down to complete the large green wave in the Target Zone below ($935.82 – $494.15). The low of this multi-year correction should lay the foundation for subsequent wave increases, likely causing new record highs above the $10,000 mark, as the weekly chart suggests. In our alternative scenario, ETH would embark on this bullish journey earlier. Currently at 27% probability, this alternative assumes the corrective low was already established at $1,385, which would imply a direct breakout above $4,107.
📈 Over 190 precise analyses, clear entry points, and defined Target Zones - that's what we do.
Chart Patterns

TSLA JUNE 20 2025 READ NOTESThis is momentum based price targeting & Tesla can easily do $390 but before that 342 is a solid resistance. From there we can get a dip and then price can continue the up move further
ANY NEWS IS TO BE AVOIDED
Now price action which is way superior is clearly suggesting the same up move.
I fact RSI is saying $400++ can come but it would be super dafe to exit around $390
If you nave any doubts then you can leave a comment.

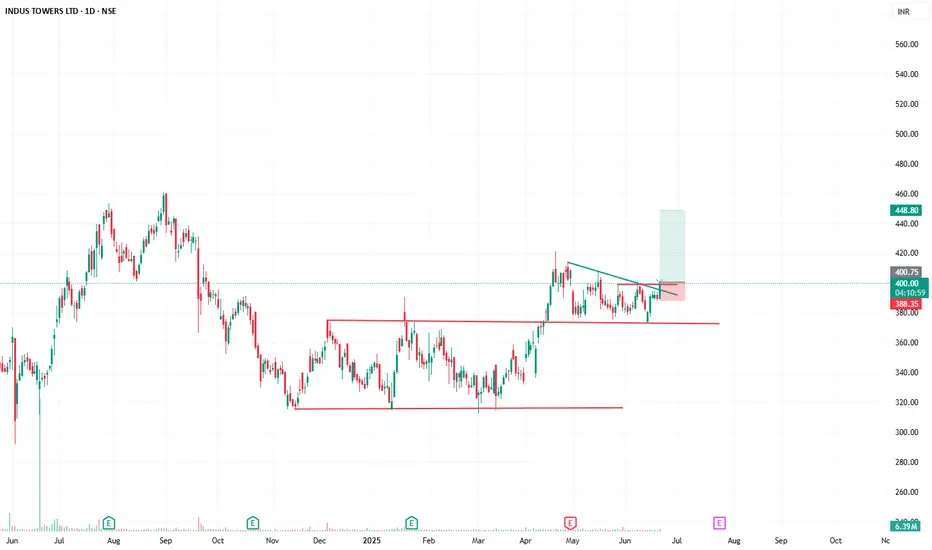
INDUSTOWER BULLISH PATTERN📡 "Tower Break! Signal Caught at ₹400"
🚀 Chart Pattern: Falling Trendline Breakout + Range Break
📈 Current Price: ₹400.25
🎯 Target: ₹448.80
🛡️ Stoploss: ₹388.15
📊 Risk:Reward ≈ 1:3.75
🔍 Volume Spike confirms breakout
🔻 Accumulation between ₹360–₹395 now acting as base
💡 Trade Setup:
After a long consolidation in a rectangular range, the price has broken out of both horizontal and descending resistance lines with strong volume. The price is above the breakout zone and retesting the level.
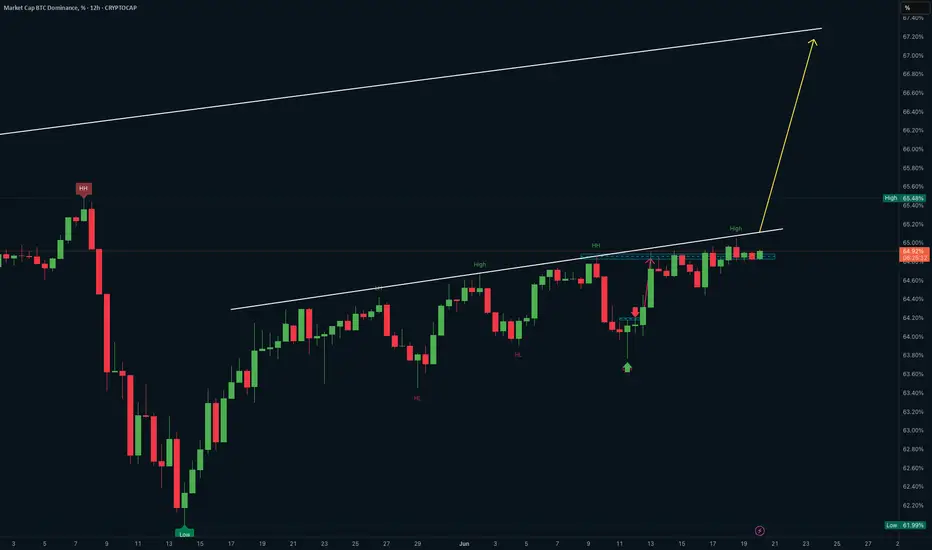
Bitcoin Dominance (#BTC.D) UpdateBTC.D building strength and is now sitting just below a key resistance level. The chart shows a series of higher highs and higher lows. Tha's a bullish sign. If it breaks above this range, we could see a strong push toward 67%.
This move would likely mean a massive ALTS sell off. Good to be safe if you're in a LONG! 😈
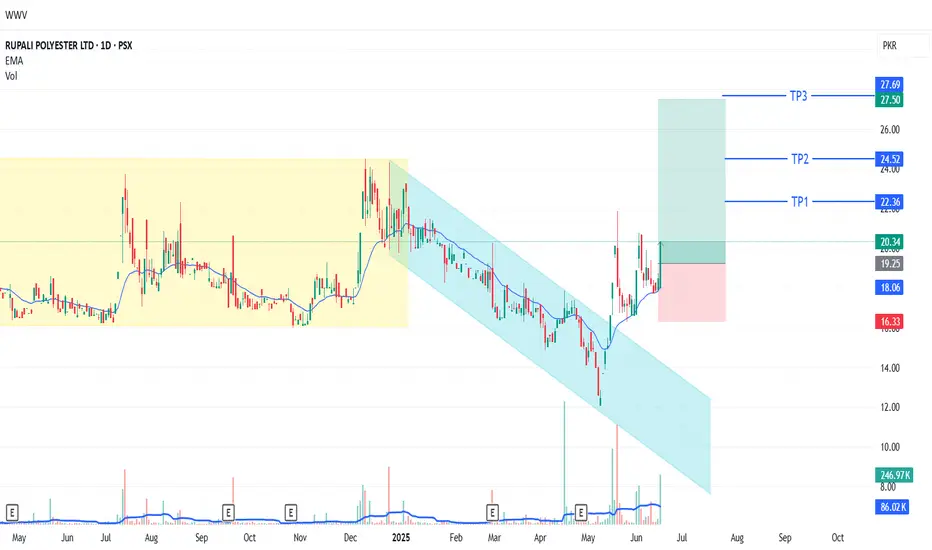
RUPL LONG TRADE 18-06-2025 (Synthetic & Ryon Sector)RUPL LONG TRADE
After hitting a low of 16.70, RUPL consolidated within a trading range (16.00 - 24.55) marked by a yellow channel. A breakdown followed, forming a bearish channel (light blue), which is essentially a bull flag. Recently, the stock broke out of this channel with a spike, signaling an upward move. After a pullback, RUPL formed bullish measuring gaps and a bullish IFDZ, indicating a safe entry point.
🚨 TECHNICAL BUY CALL – RUPL🚨
1. BUY1: 20.34 (Current Price)
2. BUY2: 18.9
3. BUY3: 17.8
TP1: 22.3
TP2: 24.5
TP3: 27.7
Stop Loss: Below 16.3 on closing basis
Risk-Reward Ratio: 2.83
Caution: Please buy in 3 parts in buying range. Close at least 50% position size at TP1 and then trail SL to avoid losing incurred profits in case of unforeseen market conditions.
PLEASE BOOST AND SHARE THE IDEA IF YOU FIND IT HELPFUL.
USDJPY Is Going Down! Short!
Please, check our technical outlook for USDJPY.
Time Frame: 12h
Current Trend: Bearish
Sentiment: Overbought (based on 7-period RSI)
Forecast: Bearish
The market is approaching a key horizontal level 145.574.
Considering the today's price action, probabilities will be high to see a movement to 144.101.
P.S
Please, note that an oversold/overbought condition can last for a long time, and therefore being oversold/overbought doesn't mean a price rally will come soon, or at all.
Disclosure: I am part of Trade Nation's Influencer program and receive a monthly fee for using their TradingView charts in my analysis.
Like and subscribe and comment my ideas if you enjoy them!

GBPUSD hit its 1D MA50. Perfect buy signal.The GBPUSD pair has been trading within a Channel Up pattern since the January 13 2025 market bottom. Yesterday it hit its 1D MA50 (blue trend-line) for the first time since April 08.
This is the most efficient buy entry as the 1D MA50 has been supporting since the February 13 break-out. Even the 1D CCI turned oversold and rebounded, which is consistent with all bottom buys inside the Channel Up.
The Bullish Leg can extend to as high as +5.05% but due to the presence of the Inner Higher Highs trend-line, we first target 1.3850 (+3.43% rise).
-------------------------------------------------------------------------------
** Please LIKE 👍, FOLLOW ✅, SHARE 🙌 and COMMENT ✍ if you enjoy this idea! Also share your ideas and charts in the comments section below! This is best way to keep it relevant, support us, keep the content here free and allow the idea to reach as many people as possible. **
-------------------------------------------------------------------------------
💸💸💸💸💸💸
👇 👇 👇 👇 👇 👇

$GOAT Eyes 165% PumpGOATUSDT is forming a falling wedge on the 12H chart, bouncing strongly from a key support zone.
A breakout above the wedge could trigger a move toward $0.25288, a potential 165% gain.
Watch for confirmation above resistance.
DYRO, NFA

Good moment for try to Buy BTCGood moment for try to Buy BTC. Very good down movement and now we make small step of the up. This point can be point for start to move new up trend with update local highest high. Stop to previous local low bar. Will see...

Monthly Closing is Important.PRL Closed at 32.21 (20-06-2025)
Monthly closing above 32 - 32.20 would
be a positive sign.
Upside immediate targets can be around 37 -38.
Breaking 31.50 may lead it towards 27 - 28

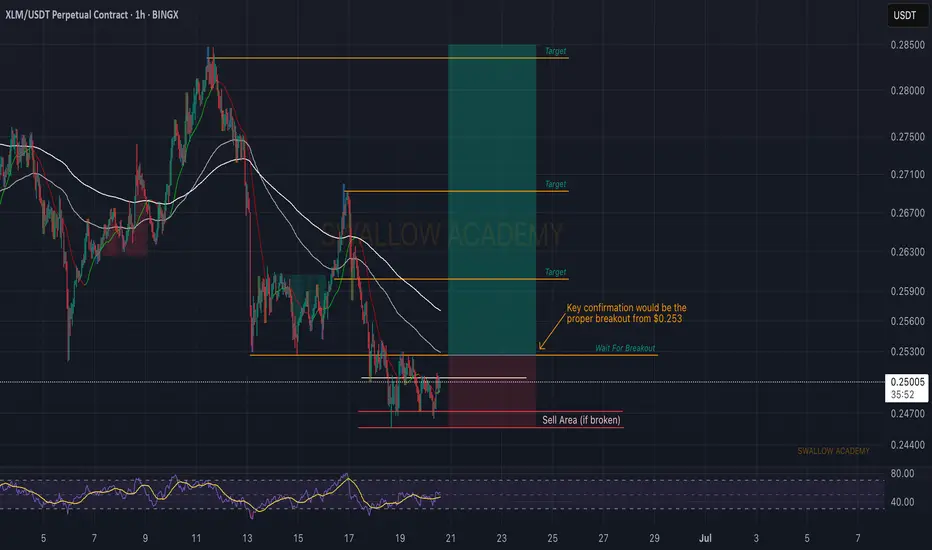
Stellar (XLM): Waiting For Breakout | Good Risk:RewardStellar coin is in an early stage for potential good upward movement from here. We see some kind of buyside volume forming here, which could give us a proper breakout, which we are waiting for.
As soon as we get it, we will be longing for $0.253.
Swallow Academy
magic usdtbuy 0.14 - 0.17
sell 0.3
almost 100% gain can get within 1 week.
STOP Loss 0.1034
Resistance broken with Daily Candle
RSI Divergence Daily candle
Spot trading only.

SHORT ON EUR/GPBWe have a rising channel (bearish reversal chart pattern) at a major level of resistance (confluence)
Price has given us a breakout of the channel to the downside and is currently respecting resistance.
I will be selling EUR/GBP to the next support level looking to catch over 120 pips.

Bitcoin– bearish momentum builds after rejection at $109KIntroduction
Bitcoin (BTC) is currently showing weakness after forming a lower high at $109,000. This level acted as a significant point of rejection, and since then, BTC has been moving lower. The price has broken through key support areas, indicating a possible shift in market structure. In this analysis, we’ll break down the recent price action, explain the technical signals behind the move, and discuss what could be expected in the short term.
Rejection from the 0.786 Fibonacci Level
The rejection at the $109,000 level aligns perfectly with the 0.786 Fibonacci retracement on the 4-hour timeframe. This level is often seen as a strong resistance point during corrective moves, and in this case, it held firmly. The precision of this rejection gives it more weight, and since hitting that point, BTC has been steadily declining. This move down suggests that buyers were unable to push through the resistance, leading to increased selling pressure.
Break of the 4H Bullish FVG
As BTC started its decline from $109,000, it broke through the bullish Fair Value Gap (FVG) that had formed earlier on the 4-hour chart. This gap previously served as a support zone but has now been decisively broken with strong volume. The loss of this level is significant, as it marks a breakdown of the bullish structure and opens the door for further downside movement. In the process of this move lower, BTC has created a new bearish FVG on the 4-hour timeframe. This gap remains open and could potentially act as a magnet for price to revisit, offering a possible short entry if price retraces into that zone. However, the clear break below the previous bullish FVG indicates a shift in momentum and supports a more bearish bias for now.
Downside Target at $102.7K
Given the recent breakdown, the next key level to watch is around $102,700. This area marks the wick low on the 4-hour timeframe and stands out due to the size and sharpness of the wick. Such large wicks often leave behind unfilled orders, which markets tend to revisit over time. The presence of these resting orders makes this level a likely target for the ongoing move down. It also acts as a strong area of potential support, where buyers might step back in if the price reaches that point.
Conclusion
With the rejection from the 0.786 Fibonacci level and the failure to hold the bullish 4H FVG, BTC has shown clear signs of weakness. The breakdown in structure suggests a continuation to the downside is likely, with $102.7k being the most immediate target. This level could serve as a strong support zone due to the unfilled orders left behind by the previous wick. Until BTC reclaims key support levels or shows a shift in momentum, the bias remains bearish in the short term, and traders should remain cautious while expecting further downside.
Thanks for your support.
- Make sure to follow me so you don't miss out on the next analysis!
- Drop a like and leave a comment!

XAUUSD | Short PositionThe price is in a downtrend in shorter time frame, making lower lows and lower highs. A short position has been taken, as indicated by the red (stop-loss) and green (take-profit) zones.

HolderStat┆BNBUSD coiling up for a breakoutBINANCE:BNBUSDT has emerged from a falling channel and entered a phase of consolidation, with price action now coiling up for a potential breakout. The chart shows a series of higher lows, and the current structure is forming a bullish pennant. The price is holding above key support, and the technicals suggest that a move above 680 USDT could trigger a rally toward the 720–740 zone. As long as BNB remains above 620, the bullish scenario is favored, with momentum building for the next leg up.

GateChain Slows Down Within An Impulsive Bullish TrendGateChain with ticker GTUSD came slightly lower, but we still see it trading in a higher degree wave »iv« correction that can resume the bullish trend for wave »v«. It can be actually finishing final subwave (c) of a three-wave (a)(b)(c) corrective decline, so keep an eye on strong support here at the former wave (iv) swing low and 38,2% Fibonacci retracement. If we get sharp rebound and impulsive rise back above channel resistance line near 20 bullish confirmation level, then we can easily expect further rally within final wave »v« of 5 this year, which can push the price even up to 35 – 40 target area.

Play on levelsMonthly closing above 66 is actually
an important Support.
Retest of Trendline done.
Weekly Support is around 71 - 68.
Immediate Resistance is around 91 - 92.
If this level is sustained, we may witness 96 - 97

EURUSD Breaks Structure: Bullish Continuation Opportunity💶 EUR/USD Analysis – Bullish Momentum Builds 📈
Taking a look at the EUR/USD on the daily chart, it’s clear the pair is currently in a strong bullish trend 🚀. Momentum has been building consistently, reflecting underlying euro strength and continued USD weakness.
🕓 On the 4H timeframe, we’ve now seen a clear shift in market structure to the upside, confirming bullish intent. Look for a continuation entry after a retracement back into equilibrium — ideally around the 50% level of the current price swing 🔄📐.
🎯 Trade Plan Idea:
Wait for price to pull back into equilibrium 🌀
Entry: Long from the discounted zone 🟩
Stop loss: Just below the recent swing low 🔻
Target: Previous high as a logical take-profit zone 🎯📊
⚠️ Disclaimer:
This content is for educational and informational purposes only and should not be considered financial advice. Always do your own research and consult with a qualified financial advisor before making any trading decisions. 📚💼

KDAUSDT 1W Analysis KDA ~ 1W Analysis
#KDA This is the lowest support for now. Buy if you still have confidence in this coin with a short term target of at least 15%+ from this support.

Silver (XAGUSD) Nears Key Support ZoneSilver (XAGUSD) has surged to a new 13-year high, decisively confirming the bullish trend in the precious metal. The ongoing rally, which began from the May 15, 2025 low, is unfolding as an impulsive Elliott Wave structure, characterized by strong upward momentum. From the May 15 low, wave 1 peaked at 33.69. A corrective pullback in wave 2 followed that concluded at 32.58. The metal then resumed its ascent in wave 3, demonstrating robust bullish sentiment.
Within wave 3, the internal structure is clear. Wave ((i)) reached 33.56 and a shallow pullback in wave ((ii)) followed to 32.67. The subsequent wave ((iii)) propelled silver to a high of 37.31, underscoring the strength of the uptrend. Currently, a corrective wave ((iv)) is unfolding as a double three Elliott Wave pattern. From the wave ((iii)) peak, wave (w) declined to 36.51, followed by a brief recovery in wave (x) to 36.78.
The ongoing decline in wave (y) is expected to find support between 35.45 and 35.96, potentially completing wave ((iv)). Once this correction concludes, silver is poised to either extend higher in wave ((v)) to a new peak or rally in at least three waves, reinforcing the bullish outlook.

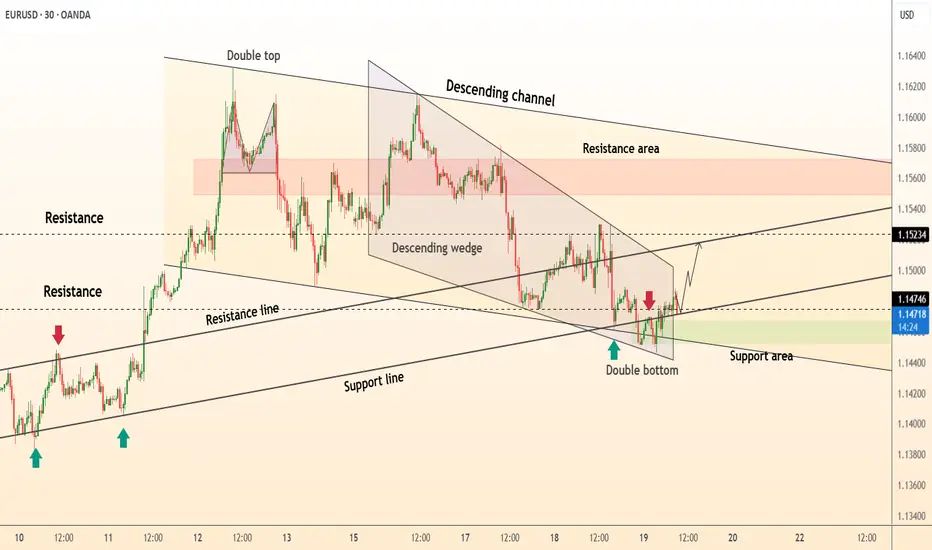
DeGRAM | EURUSD double bottom📊 Technical Analysis
● The price is currently testing the upper resistance of a descending wedge pattern after forming a clear double bottom formation. This double bottom occurred precisely at a confluence of support, where the long-term ascending support line intersects with the lower boundary of the wedge, indicating a strong potential for a bullish reversal from the 1.1450-1.1470 area.
● This recent bullish price action follows a prior "double top" pattern that initiated the corrective move downwards into the current wedge. A decisive breakout and hold above the wedge's resistance would invalidate the recent bearish pressure and confirm that buyers are taking control, with the first significant target being the horizontal resistance line near 1.1523.
💡 Fundamental Analysis
● Market attention is centered on the upcoming U.S. Federal Reserve policy meeting. While no rate change is expected, forward guidance is key. Current market sentiment, as noted by analysts at RoboForex and FreshForex, is pricing in the possibility of a Fed rate cut later this year, which could place downward pressure on the US Dollar.
● Conversely, the Euro is finding support from a comparatively hawkish European Central Bank (ECB). Recent reports indicate that the probability of an ECB rate cut has diminished, suggesting a policy divergence that favors EUR strength against the USD, underpinning the technical case for a move higher.
✨ Summary
Long entry on a confirmed 30-minute candle close above the descending wedge resistance (~1.1485); initial target 1.1523 → 1.1560. The bullish outlook is invalidated on a close below the double bottom support at 1.1450.
-------------------
Share your opinion in the comments and support the idea with a like. Thanks for your support