AUDUSD and GBPUSD Analysis todayHello traders, this is a complete multiple timeframe analysis of this pair. We see could find significant trading opportunities as per analysis upon price action confirmation we may take this trade. Smash the like button if you find value in this analysis and drop a comment if you have any questions or let me know which pair to cover in my next analysis.
Chart Patterns

AUDUSD Trading Opportunity! BUY!
My dear subscribers,
This is my opinion on the AUDUSD next move:
The instrument tests an important psychological level 0.6464
Bias - Bullish
Technical Indicators: Supper Trend gives a precise Bullish signal, while Pivot Point HL predicts price changes and potential reversals in the market.
Target - 0.6495
About Used Indicators:
On the subsequent day, trading above the pivot point is thought to indicate ongoing bullish sentiment, while trading below the pivot point indicates bearish sentiment.
Disclosure: I am part of Trade Nation's Influencer program and receive a monthly fee for using their TradingView charts in my analysis.
———————————
WISH YOU ALL LUCK

USD/JPY 4-Hour Forex Chart (June 20, 2025)4-hour candlestick chart from FOREX.com displays the USD/JPY currency pair's performance, showing a current value of 145.328 with a slight decrease of 0.112 (-0.08%). The chart highlights a recent downward trend following a peak near 145.950, with a shaded area indicating a potential resistance zone around 145.500-145.950. The time frame spans from early June to the present date, with key levels marked at 145.000, 144.478, and higher resistance points.

SMCI – Wedge Breakout Triggering Around 46 ZoneNASDAQ:SMCI – Wedge Breakout Watch with Intraday Setup Potential
Super Micro Computer ( NASDAQ:SMCI ) is working on a wedge breakout, and it's pressing right into the key $46 zone — the trigger area for a clean move higher.
🔹 Wedge Structure Clearing
Price has been compressing into a wedge, and it's now testing the upper trendline.
The $46 level is the key breakout point — if it clears and holds, this could unleash serious momentum.
🔹 Intraday Setup Developing
If NASDAQ:SMCI can hold this level intraday and consolidate, I’m watching for an entry signal right at or slightly above $46.
Volume confirmation will be key here — watching the tape closely.
🔹 My Trade Plan:
1️⃣ Entry: Watching for clean hold + setup at $46 zone.
2️⃣ Stop: Below yesterday’s low — keeps the trade tight and risk defined.
3️⃣ Add: If it breaks $46 with volume, I’ll build into the position.
Why I Like This Setup:
Breakout from compression = potential expansion
Clear risk level, clean structure — everything I want in a breakout trade
If it holds this level today, this could turn into a trend day.

AMAZON Local Short! Sell!
Hello,Traders!
AMAZON made a retest
Of the horizontal resistance
Around 219$ and the stock
Is already making a local
Bearish pullback so a further
Bearish correction
Is to be expected
Sell!
Comment and subscribe to help us grow!
Check out other forecasts below too!
Disclosure: I am part of Trade Nation's Influencer program and receive a monthly fee for using their TradingView charts in my analysis.

CHECK BTCUSD SIGNAL READ CAPTAINbtcusd buy now ✅
entry point (105800.00) (105700.00)
TAKE PROFIT 1: (106100.00)
TAKE PROFIT 2: (106500.00)
LAST TARGET (106900.00)
STOP LOSS (105300.00)

Bullish Divergence on Daily TimeframeBullish posible ! Strong confirmation for BTCUSDT.
Good luck and DYOR

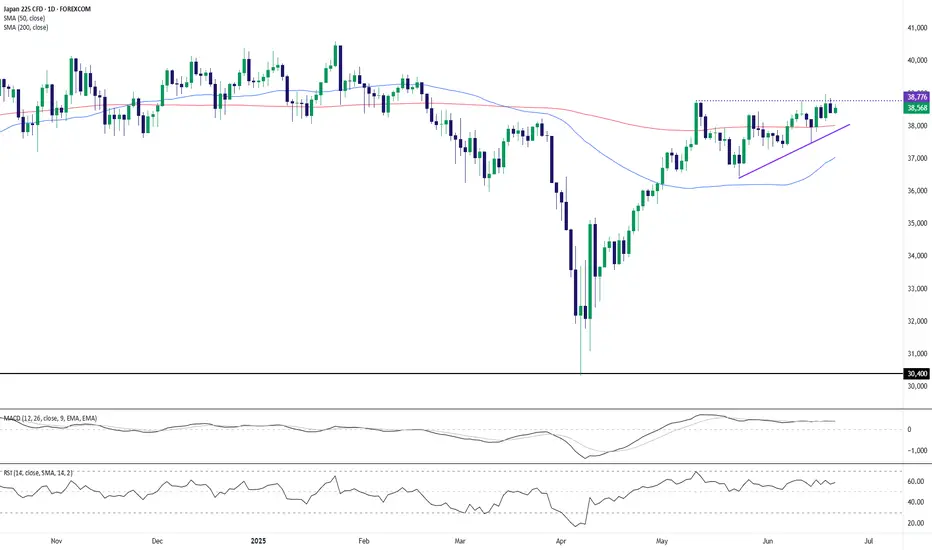
Nikkei 225 Coiling in Ascending Triangle – Breakout Imminent?The Japan 225 (Nikkei) is consolidating just beneath a major resistance level around 38,776, forming a classic ascending triangle pattern. Price has been compressing into higher lows while repeatedly testing the horizontal ceiling, hinting at a potential bullish breakout.
Key Technical Observations:
Pattern Structure: The ascending triangle, defined by rising trendline support and horizontal resistance, suggests bullish pressure is building.
Moving Averages: Price trades above both the 50-day and 200-day SMAs, reinforcing the medium-term bullish trend.
MACD: Remains flat but in positive territory, indicating underlying strength even amid consolidation.
RSI: At 58.7, RSI is neutral to bullish, showing room for further upside before entering overbought territory.
A confirmed breakout above the 38,776 resistance would validate the ascending triangle and potentially trigger a fresh bullish leg. Conversely, a break below the rising trendline would invalidate the pattern and suggest deeper consolidation or correction.
This setup favors bulls as long as the higher lows remain intact. A decisive daily close above resistance could accelerate momentum toward new highs.
-MW
MaxHealth might be the source of your wealthBeautiful Contractions at 50 DMA. Good Prior Uptrend, Rising RS over the last year. Sector is coming out of base as well. Look at the Price Volume action - lower volumes at every down move.

HYUNDAI - Moving above IPO priceAuto's are trying to make a come back and Hyundai is looking to lead it from the front. All time high was made recently. Ideal entry should be on a pullback

UPST Classic BUMBUM ReversalNASDAQ:UPST Classic Bumbum is a new term and I will probably file copyrights to it 😃
UPST has attempted to breakout of a cup and handle twice on the weekly chart and failed.
The second attempt is extended and recently broke upward from the handle.
The Bumbum simultaneously formed a saucer formation in the process which is a bullish reversal trend.
With increasing volume and momentum and favorable market conditions I expect this to to easily scale the immediate resistance of $59, then to $85. At $85 there is probably a pullback to the $70is range before any catalyst could push it beyond $85 to the $120 range.
With the fundamentals of the company aligning favorably, this is a long term buy.

Bearish Wolfewave target madeWhat I like about this pattern is the nice risk/reward it has.
The ideal pattern has a drastic and large move that quickly happen.
I added Fibonacci time that intersects the 1-4 target line for alternative targets for scaling out.
This chart has multiple SAR from different timeframes to track potential stop losses of other traders so that we can act accordingly.
Patterns can fail.
Do your own due diligence.

AUDNZD FORMING CONTINUING DOWNTREND STRUCTUREAUDNZD FORMING CONTINUING DOWNTREND STRUCTURE.
Market is currently trading near the important resistance level and latest High.
Market is showing rejection on breaking the key resistance level.
market may remain bearish bearish trend in upcoming trading sessions.
On lower side market may achieve the targets of 1.07500.
On higher side market may test the resistance level of 1.08400.

DowJones bullish consolidation supported at 41800Key Support and Resistance Levels
Resistance Level 1: 42890
Resistance Level 2: 43540
Resistance Level 3: 43940
Support Level 1: 41800
Support Level 2: 41400
Support Level 3: 41100
This communication is for informational purposes only and should not be viewed as any form of recommendation as to a particular course of action or as investment advice. It is not intended as an offer or solicitation for the purchase or sale of any financial instrument or as an official confirmation of any transaction. Opinions, estimates and assumptions expressed herein are made as of the date of this communication and are subject to change without notice. This communication has been prepared based upon information, including market prices, data and other information, believed to be reliable; however, Trade Nation does not warrant its completeness or accuracy. All market prices and market data contained in or attached to this communication are indicative and subject to change without notice.

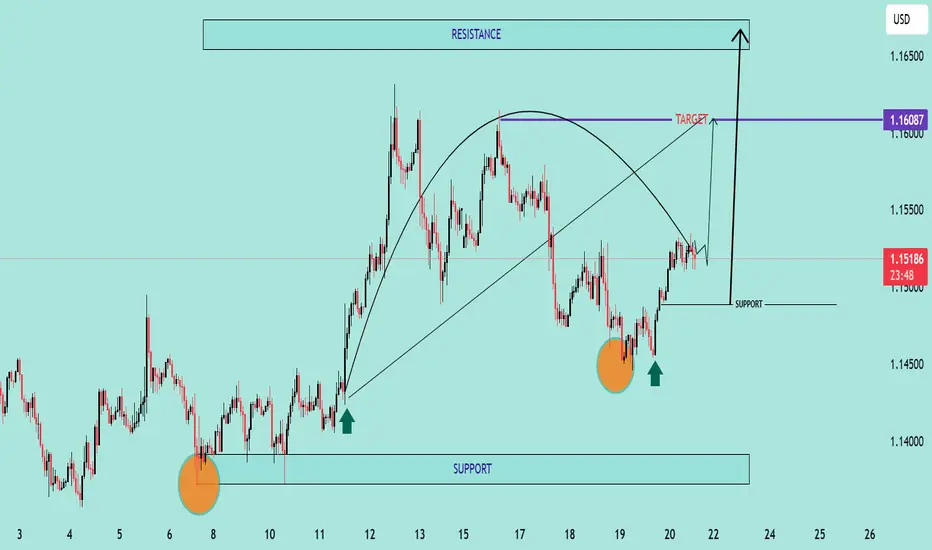
EUR/USD Bullish Reversal Breakout Pattern Technical Analysis Summary:
The chart illustrates a strong bullish reversal pattern forming on the EUR/USD pair:
🔹 Double Bottom Formation (🔶🔶):
Two clear bottom zones are marked with orange circles near the 1.14400–1.14500 area, indicating strong buying interest and support.
The second bottom confirms the double bottom pattern, often a precursor to an upward trend.
🔹 Support Zone (📉):
Firm support around 1.14450, as highlighted on the chart.
Price has respected this zone twice, bouncing back with bullish momentum each time.
🔹 Neckline Breakout (🔼):
Price is approaching the neckline zone at 1.16087, which acts as the bullish target.
A break and close above this neckline will confirm the reversal and open the way toward the resistance zone around 1.16500.
🔹 Projected Move (🎯):
If the neckline breaks, price is expected to surge towards 1.16500, aligning with the historical resistance.
This move completes the measured target projection from the double bottom structure.
🔹 Bullish Structure:
Higher lows and strong bullish candles are reinforcing the uptrend momentum.
Curved trajectory shows accumulation followed by a breakout phase.
📌 Key Levels to Watch:
Support: 1.14450 – 1.14500
Neckline/Target: 1.16087
Resistance: 1.16500
🛑 Invalidation:
A strong breakdown below support (1.14450) would invalidate this bullish setup.
SILVER Is Very Bullish! Long!
Take a look at our analysis for SILVER.
Time Frame: 4h
Current Trend: Bullish
Sentiment: Oversold (based on 7-period RSI)
Forecast: Bullish
The market is testing a major horizontal structure 3,603.0.
Taking into consideration the structure & trend analysis, I believe that the market will reach 3,697.2 level soon.
P.S
Overbought describes a period of time where there has been a significant and consistent upward move in price over a period of time without much pullback.
Disclosure: I am part of Trade Nation's Influencer program and receive a monthly fee for using their TradingView charts in my analysis.
Like and subscribe and comment my ideas if you enjoy them!

Gold Pullback: Bear Trap or Buy Dip?📊 Chart Analysis: A clear pullback within the established uptrend is visible, testing key support at —a healthy correction that reinforces the bullish structure.
🔍 News Contradiction🌍: Despite escalating Middle East tensions (typically a gold-positive catalyst), prices are trending lower—a classic bear trap scenario 🚫📉. This divergence underscores the importance of buying dips amid emotional sell-offs.
💡 Trading Framework:
Fed policy statement yesterday failed to spark volatility, as markets had already priced in dovish expectations 💨;
Weekly pattern: Asian sessions have consistently seen rallies 📈, followed by profit-taking pullbacks in later sessions 📉;
Tactical entry: Use intraday highs from Asian trading as resistance references for long positions 🎯.
Technical Confirmations:
Risk Warning: Geopolitical bullish signals being ignored suggests deliberate bearish manipulation (bear trap 🚫);
Timing Strategy: Asian session highs serve as ideal resistance markers—look to enter on retracements to 38.2% Fib levels 🎯
⚡️⚡️⚡️ XAUUSD ⚡️⚡️⚡️
🚀 Buy@ 3335 - 3345
🚀 TP 3360 - 3370
Accurate signals are updated every day 📈 If you encounter any problems during trading, these signals can serve as your reliable guide 🧭 Feel free to refer to them! I sincerely hope they'll be of great help to you 🌟 👇

GBPUSD Will Fall! Sell!
Here is our detailed technical review for GBPUSD.
Time Frame: 6h
Current Trend: Bearish
Sentiment: Overbought (based on 7-period RSI)
Forecast: Bearish
The market is approaching a significant resistance area 1.349.
Due to the fact that we see a positive bearish reaction from the underlined area, I strongly believe that sellers will manage to push the price all the way down to 1.341 level.
P.S
The term oversold refers to a condition where an asset has traded lower in price and has the potential for a price bounce.
Overbought refers to market scenarios where the instrument is traded considerably higher than its fair value. Overvaluation is caused by market sentiments when there is positive news.
Disclosure: I am part of Trade Nation's Influencer program and receive a monthly fee for using their TradingView charts in my analysis.
Like and subscribe and comment my ideas if you enjoy them!

NSDQ100 bullish continuation supported at 21300Markets & Geopolitics:
Investors are holding back as Trump may try diplomacy before acting against Iran. Oil prices dropped, European stocks rose, and the dollar slipped.
Tensions remain high: Israel hit Iranian missile and nuclear sites, and Iran’s president demanded Israel stop unconditionally. Iran’s foreign minister is in Geneva for talks, and the country is speeding up oil exports.
Technology:
SoftBank’s founder Masayoshi Son wants to partner with TSMC to build a huge AI and robotics hub in Arizona. It’s unclear if TSMC will join, as it’s already investing $165 billion in the US.
US Politics & Immigration:
A court backed Trump’s use of the National Guard during LA protests, despite pushback from California’s governor. A deeper report looks at how immigration raids affect workers.
Trade & Business:
Canada may raise tariffs on US steel and aluminum if trade talks stall. Meanwhile, Temu’s US sales are falling as it cuts back on ads. A Fidelity manager says markets have likely priced in Trump’s tariff threats and sees opportunity in mid-sized companies.
Key Trading Levels:
Resistance Level 1: 22070
Resistance Level 2: 22370
Resistance Level 3: 22780
Support Level 1: 21300
Support Level 2: 21060
Support Level 3: 20820
This communication is for informational purposes only and should not be viewed as any form of recommendation as to a particular course of action or as investment advice. It is not intended as an offer or solicitation for the purchase or sale of any financial instrument or as an official confirmation of any transaction. Opinions, estimates and assumptions expressed herein are made as of the date of this communication and are subject to change without notice. This communication has been prepared based upon information, including market prices, data and other information, believed to be reliable; however, Trade Nation does not warrant its completeness or accuracy. All market prices and market data contained in or attached to this communication are indicative and subject to change without notice.

EURCHF Analysis – “Euro Inches Higher, But Safe-Haven CHF LurksEURCHF is breaking out from a symmetrical triangle, indicating potential bullish momentum.
Key resistances to watch:
0.9445 – local swing high
0.9498 – potential measured target from the triangle breakout
Entry on retest of the triangle may offer a favorable risk-reward opportunity.
However, upside could be capped if CHF regains strength.
Structure Bias: Bullish breakout, confirmation needed with a clean retest and sustained move above 0.9440
📊 Current Bias: Cautiously Bullish
🧩 Key Fundamentals Driving EURCHF
EUR Side (Neutral to Slightly Bearish):
ECB remains cautious: June’s Economic Bulletin showed soft patches in core inflation and weak consumer activity.
German & French PMIs are mixed; services weaker than expected.
Political uncertainty (France snap elections) weighs on EUR sentiment in the medium term.
CHF Side (Fundamentally Stronger):
SNB is cautious but hawkish: Monetary policy assessment showed a steady hand, maintaining rates with no clear signal of easing.
Safe-haven flows persist due to:
Middle East risk (Israel–Iran escalation)
Russia–Ukraine tensions
Weak equity sentiment
CHF remains supported on global risk aversion, even with SNB standing pat.
⚠️ Risks That May Reverse or Accelerate Trend
Breakout fails to hold → Bearish fakeout leads to drop toward 0.9290 again
Renewed CHF strength from geopolitical shocks
Eurozone political turbulence (especially France & ECB doves)
🗓️ Important News to Watch
🇨🇭 Swiss CPI, SNB statements
🇪🇺 Eurozone PMI Flash (June 21), CPI (June 28), and political updates
Global market risk sentiment (VIX, bonds, oil, Iran/Israel news)
🏁 Which Asset Might Lead the Broader Move?
EURCHF is lagging behind EURUSD and USDCHF, but provides clean geopolitical risk signals. If markets stabilize, this pair has upside potential. However, if fear returns, CHF may quickly regain control, trapping long trades.

GBP/AUD 1H The pair is currently trading within a consolidation zone after forming a new higher low near the 2.07000 level. I’ve identified a liquidity trap and small resistance zone between 2.07850–2.08050, just below a larger resistance block at 2.08305, where price was previously rejected.
We have a clear break of structure (BOS) suggesting bullish momentum, followed by a support creation and potential re-test zone forming a bullish flag-type structure.
📌 Entry Idea:
I’m watching for a pullback to the 2.07300–2.07000 area (highlighted zone) for a potential long entry (3-tap setup). A bullish engulfing or momentum confirmation in this area would increase confidence.
🎯 Targets:
• TP1: 2.08300 (minor resistance)
• TP2: 2.08800
• TP3: 2.09120 (strong supply/resistance zone from previous rejection)
🛑 Stop Loss:
Below 2.06700 (beneath recent low and BOS confirmation zone)

Silver Pulls Back After Multi-Year HighSilver fell 2% to $35.60 per ounce, marking its third straight session in the red. The decline followed a powerful rally to 13-year highs, as traders took profits and sold off precious metals to offset losses from geopolitical turmoil.
The Fed’s steady-rate stance and warning on inflation risks tied to Trump’s new tariffs also weighed on sentiment. Adding pressure, a massive metals discovery in Argentina was confirmed, estimated to contain over 80 million ounces of gold and silver, one of the largest finds in decades.
First resistance is at 37.50, while support starts at 35.40.

NZDCHF Analysis – “Kiwi Faces Uphill Battle Against Safe-Haven FNZDCHF Price has formed a bearish pennant / triangle after a strong drop from the highs around 0.4960.
Rejection seen from the trendline resistance at ~0.4900, suggesting limited bullish momentum.
Bearish targets are mapped to:
0.4847 (first support)
0.4819 (deeper bearish target)
Two bearish scenarios drawn, both suggesting downside pressure is likely if support breaks.
Structure Bias: Bearish as long as below ~0.4905
📊 Current Bias: Bearish
🧩 Key Fundamentals Driving NZDCHF
NZD Side (Mixed to Weak):
RBNZ held rates at 5.50%, but no additional hawkish surprises. Kiwi is underperforming against safe-havens despite resilience.
Mixed Chinese influence: Some recent recovery in China’s retail/consumption data (e.g., 618 festival) but not strong enough to fuel Kiwi strength.
Risk sentiment: Global geopolitical tensions (Israel-Iran, Ukraine) are pressuring high-beta currencies like NZD.
CHF Side (Strengthening):
Swiss Franc bid on risk-off: CHF is strengthening as a safe-haven due to escalating geopolitical concerns and volatile global markets.
SNB not cutting yet: Recent SNB assessment indicates gradual, patient stance. The central bank may ease later in 2025, but no urgency.
European proximity flows: CHF benefits from proximity to EU and low volatility in domestic economy.
⚠️ Risks That May Reverse the Trend
Surprise RBNZ hawkish speech or inflation spike
Risk-on reversal boosting NZD
Unexpected SNB rate cut or dovish surprise
🗓️ Key News to Watch
🇳🇿 NZ Trade Balance and inflation expectations
🇨🇭 Swiss inflation data and SNB commentary
Global sentiment drivers: Middle East headlines, equity volatility
🏁 Which Asset May Lead?
NZDCHF may lag behind NZDJPY or AUDCHF in volatility but offers a cleaner risk-off signal. If CHF strength and Kiwi weakness persist, this pair can trend with limited noise.
