BtcusdCurrently we are on a triangle thats awaiting breakout but with my expectations I'm expecting a strong bull run
Chart Patterns

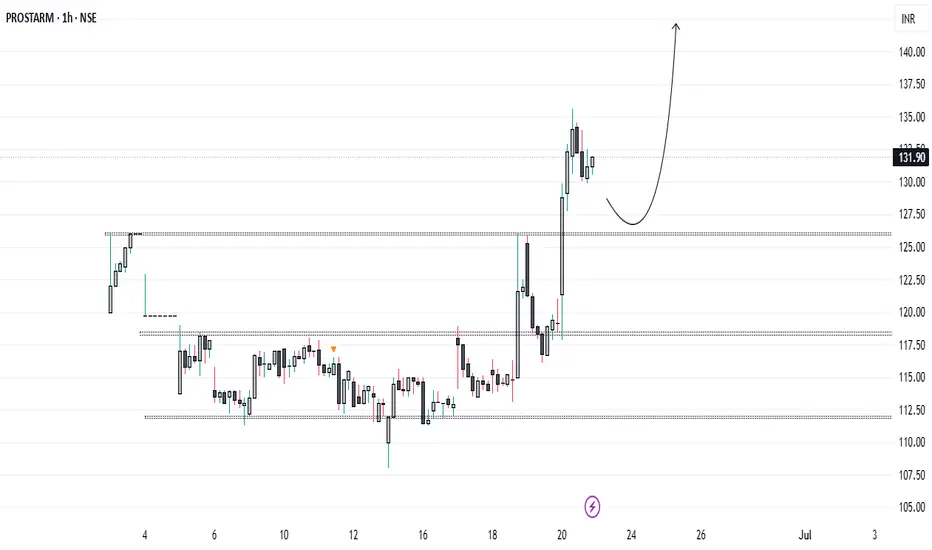
What’s Next for PROSTARM Investors...?Prostarm has decisively broken its all-time high. Since its IPO on June 3rd, it has successfully surpassed the major resistance level of 126 and is holding strong above it. We should take advantage of this opportunity and establish a long position on the retest of the 126 level.
Ethereum Rejected By Strong Resistance, A Bearish OutlookFenzoFx—Ethereum is consolidating around $2,525 after being rejected by the $2,813.0 resistance, a strong supply zone. Immediate support lies at $2,446.0. If ETH closes below this level, a move toward $2,080 is likely.
The bearish outlook is invalidated if ETH stabilizes above $2,813.0.

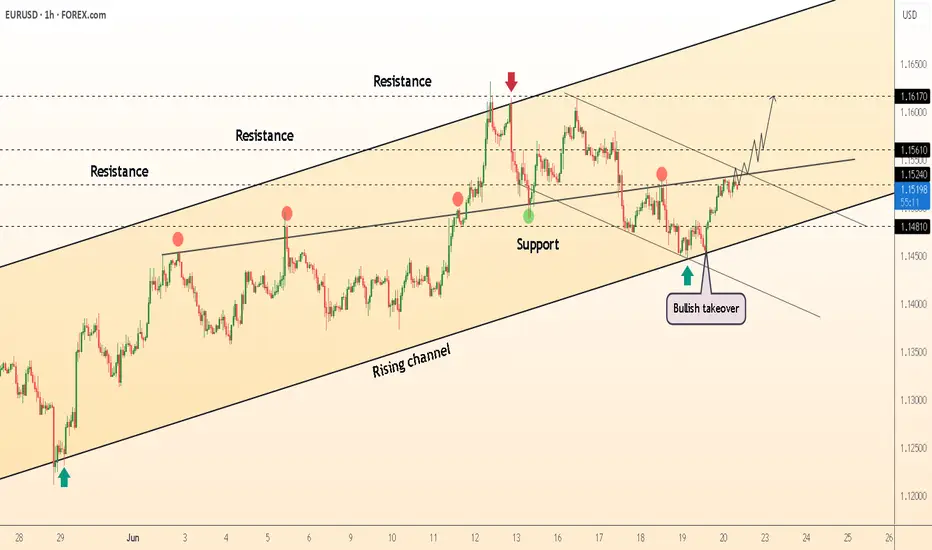
DeGRAM | EURUSD reached the resistance level📊 Technical Analysis
● Bulls defended the rising-channel mid-line (≈1.1480), turning it into support and snapping the intraday falling wedge; hourly closes now print higher highs above the reclaimed 1.1520 pivot.
● A tight bull flag is forming against 1.1560; its 1.618 swing coincides with the upper rail / 1.1617 resistance, keeping the channel’s momentum bias pointed north.
💡 Fundamental Analysis
● Softer US housing starts and a slide in 2-yr yields pulled the DXY to two-week lows, while ECB’s Knot warned “premature cuts risk inflation flare-ups,” widening the short-rate gap in the euro’s favour.
✨ Summary
Long 1.1515-1.1530; flag break >1.1560 targets 1.1617, stretch 1.1670. Bias void on an H1 close below 1.1480.
-------------------
Share your opinion in the comments and support the idea with a like. Thanks for your support
The Crypto PlayHello traders,
Beautiful PA shaping up on BTC, ETH and XRP.
Looking for short term sells into the buys.
Explained my thesis in the video.
Stay sharp chads and stay safe!
Onwards
CRYPTO:ETHUSD
CRYPTO:BTCUSD
CRYPTO:XRPUSD

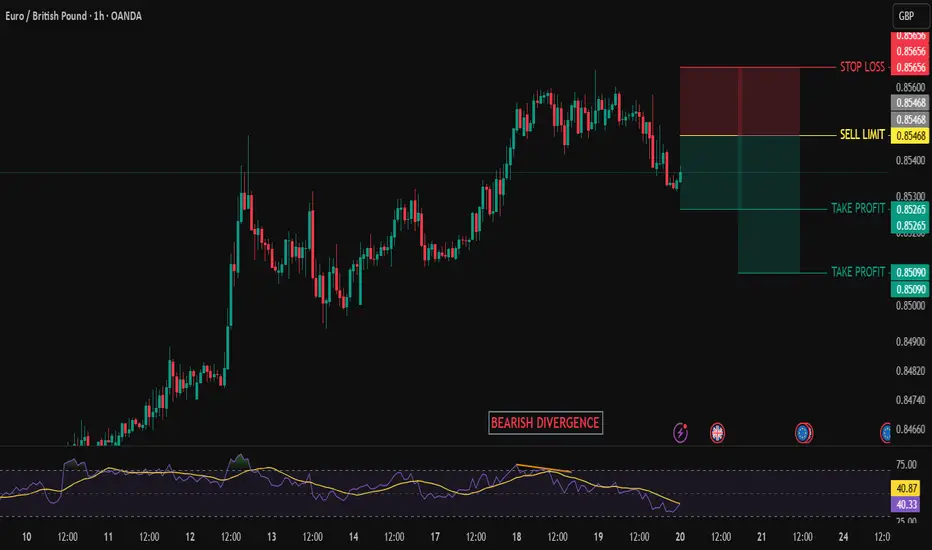
EURGBP BEARISH SETUPEURGBP has been a bullish trend.
At rsi bearish divergence formed.
And also price break previous HL, i would like to take entry with sell limit order at fib level 0.382.
Manage your trade accordingly.
Silver sideways consolidation support at 3500Silver – Technical Analysis
The Silver price action continues to exhibit a bullish sentiment, underpinned by a prevailing rising trend. However, recent intraday moves indicate a corrective pullback, reflecting short-term consolidation within the broader uptrend.
Key Technical Levels:
Support:
3,500 – Primary support and previous consolidation zone; critical for maintaining bullish structure.
3,450 – Secondary support; potential downside target if 3,500 fails.
3,390 – Key lower support; aligns with a broader demand area.
Resistance:
3,720 – Immediate upside resistance; first target on a bullish bounce.
3,790 – Intermediate resistance; aligns with recent swing highs.
3,850 – Long-term resistance target; marks the upper boundary of the current bullish channel.
Scenario Analysis:
Bullish Continuation (Base Case):
A bounce from the 3,500 level would affirm the corrective pullback as temporary, with potential for a bullish continuation targeting 3,720, followed by 3,790 and 3,850 over a longer timeframe.
Bearish Reversal (Alternative Scenario):
A daily close below 3,500 would undermine the current bullish outlook and signal a deeper retracement, with downside risk toward 3,450 and potentially 3,390, where structural support may stabilize price.
Conclusion:
Silver remains structurally bullish, with the current pullback offering a potential entry point within the trend. The 3,500 level is the key pivot—holding above it supports further upside continuation, while a breakdown below would raise the risk of a deeper correction. Traders should watch for price action confirmation at this level to validate the next directional move.
This communication is for informational purposes only and should not be viewed as any form of recommendation as to a particular course of action or as investment advice. It is not intended as an offer or solicitation for the purchase or sale of any financial instrument or as an official confirmation of any transaction. Opinions, estimates and assumptions expressed herein are made as of the date of this communication and are subject to change without notice. This communication has been prepared based upon information, including market prices, data and other information, believed to be reliable; however, Trade Nation does not warrant its completeness or accuracy. All market prices and market data contained in or attached to this communication are indicative and subject to change without notice.

Ethereum (ETH): Seeing Bounce From 200EMA | Buyers AccumilateEthereum is showing some signs of recovery, where buyers might be into something here. If we keep same volume momentum until the end of the day, we might see another attempt to go for the $3000, which is our major target as of now.
Swallow Academy

HolderStat┆AVAXUSD held the trend lineBINANCE:AVAXUSDT is rebounding from the 19 support after a falling-wedge break, flipping the pullback into bullish continuation. Holding the trend-line keeps Avalanche pressed north; clearing 22.8 unlocks 25 and fresh-highs narrative 📈

Bitcoin (BTC): Buyers Are Accumulating | Breakout Incoming?Buyers have finally shown dominance near the 200EMA, where now we are heading for for the resistance zone, which will be tested.
As we are entering the friday with that kind of buyside volume we might be seeing strong pump during the weekends so that's what we are looking for now.
Swallow Academy

ALAB - EASY SHOT UPGood Morning,
Hope all is well. As you can see ALAB has built some momentum on the news of strategic partnerships for AI technologies with NVIDIA. The next resistance is easily broken, with this momentum there is no reason for ALAB to not hit above 140$.
ENJOY!

EURUSD Bullish trend breakdown ahead selling possible shortEUR/USD Technical Breakdown 🚨
The bullish trendline has been broken, along with the descending triangle support — signaling a potential shift in momentum. 📉
🔍 Entry Level: 1.14800 (Previous Resistance)
🎯 Target Zones: 1️⃣ 1.14300 – Key Demand Zone
2️⃣ 1.14000 – Next Demand Area
3️⃣ 1.13800 – Bullish Order Block (OB)
📊 Timeframe: 1H
We're watching price action closely as it approaches these zones — expect reactions! ⚠️
💬 Drop your thoughts in the

ANL LONG TRADE (SECOND STRIKE) 14-06-2025ANL Second Strike (1H TF)
ANL has been in an accumulation zone (blue channel) and recently touched the top at Rs. 9.6 in December 2024. After a down leg (pink channel) with a selling climax and false breakdown, the stock reversed upwards. Having achieved previous targets, ANL is nearing completion of its pullback, making it a potential entry point for a second strike long trade near 1-hour IFDZ.
🚨 TECHNICAL BUY CALL – ANL🚨
- Buy 1: Rs. 8.0
- Buy 2: Rs. 7.9
- Buy 3: Rs. 7.7
- TP 1: Rs. 8.31
- TP 2: Rs. 8.99
- TP 3: Rs. 9.8
- *Stop Loss*: Below Rs. 7.4
- *Risk-Reward Ratio*: 1: 3.94
Caution: Please buy on levels in 3 parts. Close at least 50% position size at TP1 and then trail SL to avoid losing incurred profits in case of unforeseen market conditions.

DAAG LONG TRADE 16-06-2025DAAG Long Trade
Rationale : DAAG has been in a bearish channel (bull flag) since Dec 2024. Recently, the stock trended at the upper level of the channel, absorbing overhead supply. Today, it broke out of the channel with a huge volume metric imbalance and gradient, taking price above the axis line.
🚨 TECHNICAL BUY CALL – DAAG🚨
- Buy 1: Current level (Rs. 92)
- Buy 2: Rs. 86.5
- Buy 3: Rs. 82.2
Target Prices
- TP 1: Rs. 100
- TP 2: Rs. 116.8
- TP 3: Rs. 129.8
Stop Loss - Below Rs. 76 closing basis
Risk-Reward Ratio1:- 3.25
Caution: Close at least 50% position size at TP1 and then trail SL to avoid losing incurred profits in case of unforeseen market conditions.
PLEASE BOOST AND SHARE THE IDEA IF YOU FIND IT HELPFUL.

Destiny Tech100 Inc (DXYZ)The stock continues to form higher lows, reflecting strong buying power. However, it has closed just below the key resistance level at $46.80. A decisive breakout above this level is needed to confirm the bullish continuation, triggering further rises near $50.00 - $55.38 - $57.50 - $60.90 - $67.70.
the stop loss is below the last higher bottom at 38.51$, as a break below it, will invalidate the current bullish scenario and suggest a possible trend reversal.
Technical indicators, particularly the MACD, are trending positively and support the bullish outlook, adding further confidence to the upward scenario.
Disclaimer: This analysis is for informational purposes only and does not constitute financial, investment, or commercial advice or recommendations.

AMD IS READY FOR A STRONG BULLISH MOVENASDAQ:AMD Right now, am extremely bullish on AMD.
I expect AMD to give a good bullish run to trail NVIDIA.
Technically, AMD is supper bullish right now, having had a multiple bullish break of structure on the daily time frame.
I took a long entry on the bullish break of structure on daily time frame. Stop loss is below the recent structure swing low.
What do you see on your chart?

XBR/USD Chart Analysis: Oil Price Falls After Trump’s DecisionXBR/USD Chart Analysis: Oil Price Falls After Trump’s Decision
As shown on the XBR/USD chart, the price of Brent crude oil has pulled back from yesterday’s 4.5-month high following a statement from the White House that President Donald Trump will make a decision within the next two weeks on whether the United States will take part in the Israel-Iran conflict.
According to Reuters, the US President is facing backlash from some members of his team over the prospect of launching a strike against Iran, which could drag the US into yet another prolonged war.
Technical Analysis of the XBR/USD Chart
From a technical standpoint, Brent crude oil price is developing within an upward channel (marked in blue), though several bearish signals are appearing on the chart:
→ a bearish gap that formed overnight;
→ a false bullish breakout (indicated by an arrow) above the $76.50 level, drawn from the 13 June high;
→ bearish divergence on the RSI indicator;
→ a break of the recent local ascending trendline (marked in orange).
Given the steep angle of the rising blue channel, it is reasonable to assume that bears may attempt to break through its lower boundary, which is currently acting as support. Whether this scenario materialises in the oil market will largely depend on developments in the Middle East.
This article represents the opinion of the Companies operating under the FXOpen brand only. It is not to be construed as an offer, solicitation, or recommendation with respect to products and services provided by the Companies operating under the FXOpen brand, nor is it to be considered financial advice.

BTCUSDT-– Symmetrical Triangle Breakout LoadingBitcoin is currently consolidating inside a Symmetrical Triangle, forming higher lows and lower highs – a classic sign of volatility compression.
🔹 Structure: Symmetrical Triangle
🔹 Support Holding Strong – bulls defending the zone
🔹 Breakout Expected Soon
🔹 Major Resistance: $110,200
🔹 Breakout Target: $112,000+
Price is coiling up. Break above the triangle = strong bullish continuation likely.

Choppy Gold Action Hides a Bigger Drop on Weekly Chart?After Monday’s correction, Gold continued lower – but the drop has been extremely choppy, making swing trading nearly impossible in this environment.
🔄 Short-term vs. Weekly Picture
On the 1H chart, price action is messy and directionless. However, the weekly chart tells a clearer story – which is not bullish at this moment.
❗ Let’s not rush into the “new ATH” narrative
Last week, I pointed out around the 3360 zone that we may get a rise above 3400. That move happened – but it seems more driven by Middle East tensions than by any structural strength in Gold itself.
📉 Why I’m leaning bearish on higher timeframes at this moment:
• This week’s price action almost fully negates last week’s strong green candle
• A close near the bottom of the range could form a Dark Cloud Cover pattern – a strong bearish signal
• Unless we see a reversal above 3400, downside remains the higher probability
📌 Next Target?
If the weekly close confirms this bearish setup, a drop to 3150 is not only possible – it’s becoming likely.
Disclosure: I am part of TradeNation's Influencer program and receive a monthly fee for using their TradingView charts in my analyses and educational articles.

KFINTECHKFINTECH
Watch this stock very carefully at current price 1243, Ready for Target 1300, 1350 in few weeks..

BTCUSD – Double Bottom Breakout Signals Bullish ReversalBitcoin has formed a Double Bottom pattern on the 30-min chart, indicating a potential bullish reversal from recent lows. Price has broken above the neckline with confirmation, triggering a long setup with a clearly defined target and stop-loss.
🔹 Pattern: Double Bottom
🔹 Current Price Zone: ~105,043
🔹 Target: 107,856
🔹 Stop Loss: Below 104,544 – 103,787 zone
🔹 Technical Outlook: Break above neckline and Ichimoku cloud signals bullish momentum
🔹 Fundamental Context: Bullish sentiment supported by rising institutional interest and positive macro news
Trade Active – Buy bias remains strong while price holds above breakout support. 📈🚀
Note : If you found this helpful, like and follow for more trade ideas!
Share My Idea With Your Firends Mention Your Feed back Comment Section
This is not financial advice. Please conduct your own research and manage risk accordingly.

Gold to ATH After rejection H4, Gold will go to previous top.
The trend still uptrend, weekly candle still also bullish. I predict there will be continuation uptrend

LQTY - Buy - buy - bye bye- Volume in volume
- Divergence in volume
- Completed 5th wave of growth
I don't know what else to write.
If you like the idea, please put a ‘like’. It's the best ‘Thank you!’ 😊 P.S. Always do your own analysis before a trade. Set a stop loss. Capture profits in instalments. Withdraw profits in fiat and make yourself and your friends happy.
