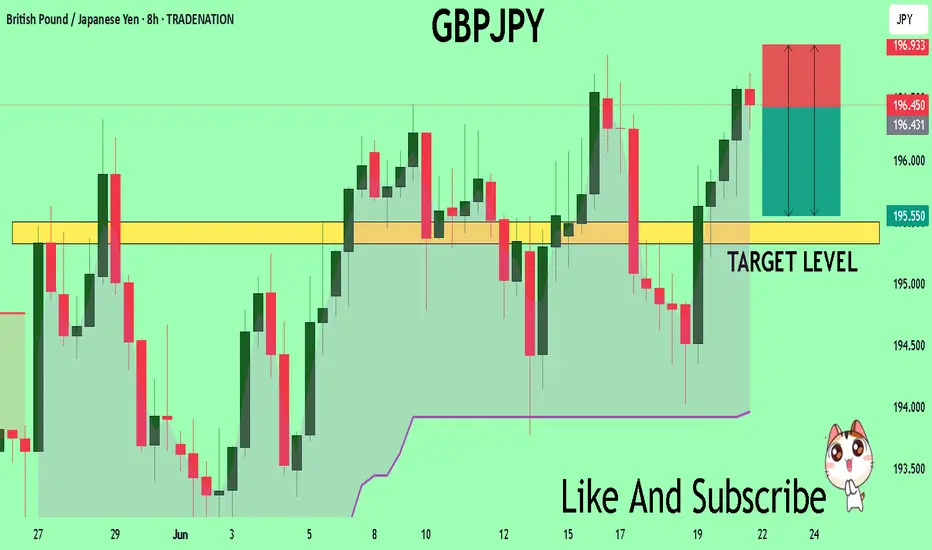
GBPJPY Massive Short! SELL!
My dear subscribers,
This is my opinion on the GBPJPY next move:
The instrument tests an important psychological level 196.43
Bias - Bearish
Technical Indicators: Supper Trend gives a precise Bearish signal, while Pivot Point HL predicts price changes and potential reversals in the market.
Target - 195.50
My Stop Loss - 196.93
About Used Indicators:
On the subsequent day, trading above the pivot point is thought to indicate ongoing bullish sentiment, while trading below the pivot point indicates bearish sentiment.
Disclosure: I am part of Trade Nation's Influencer program and receive a monthly fee for using their TradingView charts in my analysis.
———————————
WISH YOU ALL LUCK
Chart Patterns
GBPUSD Analysis Today: Technical and Order Flow !In this video I will be sharing my GBPUSD analysis today, by providing my complete technical and order flow analysis, so you can watch it to possibly improve your forex trading skillset. The video is structured in 3 parts, first I will be performing my complete technical analysis, then I will be moving to the COT data analysis, so how the big payers in market are moving their orders, and to do this I will be using my customized proprietary software and then I will be putting together these two different types of analysis.

BTC & USDT.D => Bullish Correction Incoming?Hello TradingView Family / Fellow Traders. This is Richard, also known as theSignalyst.
Both BTC and USDT.D are sitting around key rejection zones.
💰 BTC is hovering near the $100,000 level — a major previous low and a psychological round number.
📊 Meanwhile, USDT.D is testing the 5% resistance — a supply zone and another critical round number.
As long as $100,000 holds as support on BTC and 5.1% holds as resistance on USDT.D, we could expect a bullish correction across the crypto market.
What do you think? Will these levels hold or break? 🤔
📚 Always follow your trading plan regarding entry, risk management, and trade management.
Good luck!
All Strategies Are Good; If Managed Properly!
~Rich

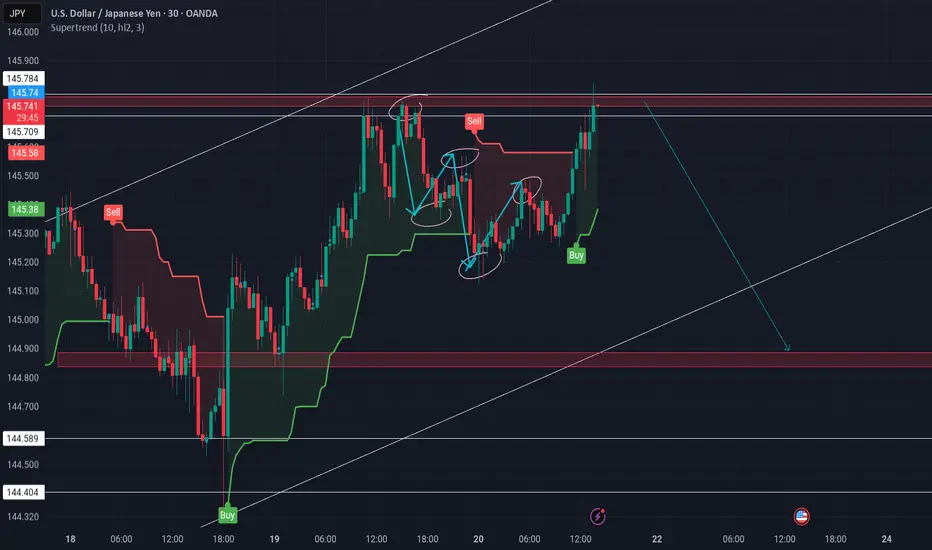
Reason for SELL (USDJPY M30)1. [Strong Resistance Zone
Price reached a key resistance (red zone) that was rejected multiple times before.
AUDJPY SELL TRADEBase on key zone level
Am seeing a sell opportunity on AUDJPY NOW
ENTRY: 94.500
SL: 94.600
TAKE PROFIT: 93.800
Comment your opinion
For fund management. INBOX ME ON X @shajudeakinoba1

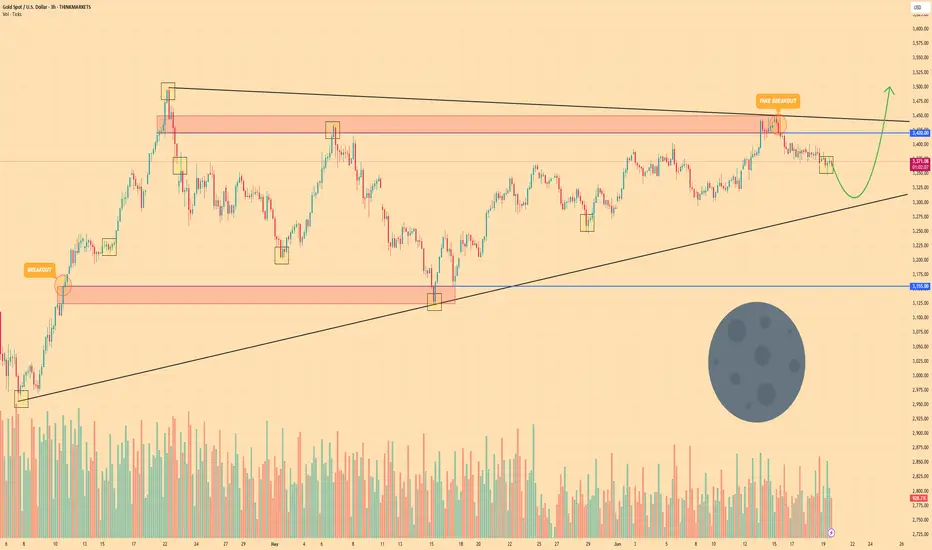
GOLD - Price may bounce up from wedge to $3500 points Hi guys, this is my overview for XAUUSD, feel free to check it and write your feedback in comments👊
A few moments ago, price entered to wedge, where it at once made an upward impulse from the support line.
Price broke $3155 with $3420 level and reached resistance line, but soon turned around and started to decline.
After this, Gold broke the $3420 level one more time and later tried to grow, but when it reached the resistance zone, it dropped.
Next, price bounced from support line of wedge and started to grow and in a short time rose to $3420 level.
Recently, it declined below, making a fake breakout of the resistance level, and now it continues to decline.
In my mind, Gold can decline a little more and then bounce up to $3500, breaking the resistance level.
If this post is useful to you, you can support me with like/boost and advice in comments❤️
Disclaimer: As part of ThinkMarkets’ Influencer Program, I am sponsored to share and publish their charts in my analysis.
EUR/USD analysis and pending orderTwo days ago, there was a FED meeting, where it was stated that the benchmark interest rate will be kept at 4.25-4.50% level.
What is important is what they told - the expectations - economicp rojections are lower, and inflation is higher.
Maybe they’ll decrease rates in future?
Right now, it’s not so important. It’s summer already, and by the old “Sell in May, and go aways” mentality, I don’t expect some huge impact on the market.
I know… Iran, Israel, Trump, maybe even Putin? Anybody can do some stupit stuff and everything can go to Hell.
And it’s Friday, not very smart time to open trades, so I’m putting pending order.
I decided for EUR/USD.
Timeframe is 4h.
On my chart I can see clear uptrend in the last couple of weeks, especially in the last 3 months.
Also, I see lower highs.
Upward trend is breached… Where it could stop?
Overall, I don’t expect the pair will come near parity, even though ECB lowered rates before FED did.
But some “selloff”, probably.
I used good old Fibonacci, draw it, and the price could potentialy drop to 50% level or even ideal 61…8%-78.6% zone.
Pending entry: 1.15577
TP: 1.12645
SL: 1.1671
If it activates today, I’ll leave it over the weekend.

Become Rich Trading Bitcoin Strategy Simplified Correction NullIs this a shakeout or a rejection?
A rejection implies no bullish action short-term thus lower prices. It is still early on the current move.
A shakeout implies a bear-trap and bullish action soon to follow, as soon as the shakeout is complete.
Daily and weekly close
Let's be fair and honest, it is too early to say. To determine if the current move is either a rejection or a shakeout we have to wait for the close today.
Price action
Why are these two in question? Because the daily session moved higher today reaching $106,500 followed by lower prices. The low hit $102,309, lower than 13-June but higher than 5-June, a higher low. More information can be acquired once the trading session closes but, we can move ahead and see what the chart has to say based on other signals.
The volume is low on the bearish side, on all sides. The higher low so far is strong. As long as $102,000 holds Bitcoin is ultra-hyper bullish, very strong. Even if we are considering the short-term it doesn't matter, if the action is happening above this level the bulls are wining and that's what we have.
If the action is happening above $100,000 we already know what this means and this level is not in question right now. Being price oriented that is why I say is still early, do you agree?
So, more shakeouts, more sideways, more retrace—a non-event; short-term noise.
We are looking for the next major move, not the next $1,000 drop.
Market conditions do not change
Rest easy, Bitcoin will continue bullish even if it wicks below 100K. As long as it trades above this level, or the $100,000 to $102,000 price range, the action is safe (coming from the bulls).
If the week closes above this range but starts red next week and goes below, no need to panic because the week can start red just to recover and this would only be a continuation of the shakeout; we take information from the weekly close and not the intra-week action makes sense?
Questions —Leave a comment
So, what is your take?
Just let me know truly, what is your belief?
Do you think Bitcoin is bearish or bullish?
It can be looked at in many different ways.
The bull market
The trend is bullish, mid- to long-term. The action is happening above 100K.
The altcoins market is weak but we all know from the bottom we grow, we are entering the summer now... Ahhh, the beautiful summer, bring the heat. With the summer prices tend to grow.
You can call it a relief rally but that will be only the start. The relief will turn into a major bullish wave and this wave will transform into a major bull run.
Motivation
I love you again wishing you the best forever more.
You deserve the best now and always.
Keep at it and keep trying, persistence is the key. As long as we continue to trade, in the end we are sure to win.
Invest in Crypto, it is very easy.
Think of all the people that joined us (the market) 10 years ago. What are their holdings worth now? Millions upon millions... Now, think of yourself 10 years into the future. Put whatever money in you can afford and watch it grow.
The way to riches is not through frugality or savings, the way to riches is through buying and investing. This is the right market for us. It is fast, it is volatile, it is young; just like most of us. If not young of age, we are young at heart.
Namaste.

Gold (XAU/USD) Technical Analysis – Bearish Breakdown in Play📉 Gold (XAU/USD) Technical Analysis – Bearish Breakdown in Play | June 20, 2025 🟡
🕒 Timeframe: 4-Hour
📍 Asset: Gold Spot / U.S. Dollar (XAU/USD)
🖼️ Chart Source: TradingView by AngelaFxTrading
🔍 Chart Overview
The 4H chart displays a clear bearish breakdown from an ascending trendline (blue), followed by a rejection at a key horizontal resistance zone (highlighted in purple).
🧠 Key Technical Insights
📌 1. Resistance Zone Rejection
Price Level: ~$3,370 - $3,390
Price attempted multiple breakouts above the resistance zone but consistently failed, indicating strong seller presence. The red arrow marks a lower high, suggesting waning bullish momentum.
📈 2. Trendline Break
The rising blue trendline has been decisively broken. This signals a potential trend reversal from bullish to bearish.
🧭 3. Support Levels to Watch
Minor Support: $3,294.43 (short-term reaction zone)
Major Support: $3,244.87 (target of the projected drop)
🔮 4. Bearish Projection
Blue arrows indicate a measured move expectation, targeting the $3,244.87 level.
A bearish flag/pennant formation post-break suggests continuation lower.
⚠️ Key Considerations
Fundamentals: Note the icons at the bottom — upcoming USD-related news/events 📅 could inject volatility.
Confirmation: For bears, a clean rejection from the resistance retest would confirm entry zones.
🧭 Trading Bias:
🔻 Short-term Bearish
As long as price remains below the purple resistance and under the broken trendline, selling pressure dominates.
🛑 Invalidation Zone
A daily close above ~$3,390 would invalidate this bearish setup and suggest a return to bullish momentum.

Buy AUDNZDaudnzd as been netrual compared to the marke, a very low beta. But there are more risk on the set up.

EUR/AUD BEARS ARE GAINING STRENGTH|SHORT
Hello, Friends!
EUR/AUD is making a bullish rebound on the 12H TF and is nearing the resistance line above while we are generally bearish biased on the pair due to our previous 1W candle analysis, thus making a trend-following short a good option for us with the target being the 1.762 level.
Disclosure: I am part of Trade Nation's Influencer program and receive a monthly fee for using their TradingView charts in my analysis.
✅LIKE AND COMMENT MY IDEAS✅

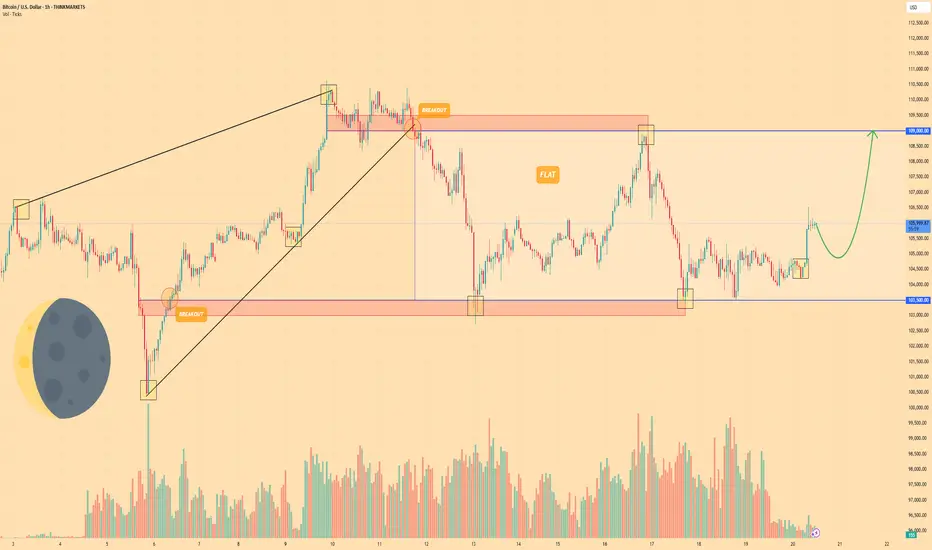
BITCOIN - Price can continue grow inside flat to $109000 levelHi guys, this is my overview for BTCUSD, feel free to check it and write your feedback in comments👊
A few days ago, the price entered a wedge, declining below the $103500 level and then making a strong impulse up.
Next, price broke $103500 level one more time and rose to resistance line of wedge, after which started to decline.
BTC broke $109000 level and started to trades inside a flat, where it declined to support level and then bounced up.
Price rose to resistance level, which is top part of flat, and then at once dropped back and started trading close.
But some time later, price bounced from this level and started to grow, and even now it continues to grow.
So, I think that BTC can make a small correction movement and then continue to grow to $109000 level.
If this post is useful to you, you can support me with like/boost and advice in comments❤️
Disclaimer: As part of ThinkMarkets’ Influencer Program, I am sponsored to share and publish their charts in my analysis.
GOLD Bullish Breakout from Falling Channel | Retest Entry Plan 📊 Analysis Summary:
Gold (XAUUSD) has broken out of a falling channel on the 1H timeframe with strong bullish momentum. After the breakout, price retested a minor bullish order block, providing a solid confirmation for potential continuation to the upside.
🔍 Technical Confluences:
Falling channel breakout
Bullish engulfing breakout candle
Retest of minor bullish order block (acting as support)
Clear bullish Break of Structure (BOS)
📌 Trade Plan:
Entry: 3365 (OB retest zone)
Stop Loss: 3345 (20 points below OB zone)
Take Profit 1: 3399 (Key intraday resistance)
Take Profit 2: 3451 (Swing high target)
📈 Risk-Reward: Approximately 1:4
📌 Expectation:
If the order block support holds, we can expect a bullish continuation toward 3400+ and possibly 3450 in the coming sessions.

BTC is Bearish again?BTC 1W Overview
BTC is still trading above 100k despite the macro situation and ww3 situation in the Middle East , which is fine for the BTC maxis and institutions.
Weekly structure starting to shift in a bearish direction considering the weekly close below the structure and daily range is just a chop fest around the 104k area and so does the other assets getting chopped.
BTC.D is now over 1000 days uptrending and this is wild and not at all what many were expecting this point in the cycle.
Big concern on my mind is that what if BTC pulls back to the 90k area as I think may happen which I marked in the chart then altcoins will leg down another 20-30%.
Obviously everything is not about technical and the fundamental side is simply that there is an ongoing conflict in the middle East and the whole crypto market is waiting for a resolution one way or the other and crypto market lacks patience and even we do get the uncertainty then it still doesn't address the deeper market issues of altcoin weakness and continued dominance of BTC (BTC outperformed every single alt except MKR).
My best bet for LONG maxis will be around the 92k area Weekly FVG and Yearly Open, if we get more bad news from the middle East or Russia-ukraine or Sir powell comes with a bad news then this zone will be fast forwarded
And for short maxis or Beras my best bet will be S\R of 104k or monthly open is area to look for
All this planning will go down the drain if TRUMP comes with a good news regarding Tarrifs with china or other countries or any other news from the TRUMP because he's unpredictable
On the short time frame Scalps are possible on both sides and 100k is a psychological level to long but in bearish scenerio or war news will just wreck it
Final bias shifting Bearish
For alts instead of trying to long every dead cat bounce or predict the bottom we have to wait for it to happen and then react accordingly because reaction and execution is better than drawing predictions and getting chopped

USDCAD - H1 SELL setup USDCAD got rejected twice at H4 major resistant.
Expecting more of a downward movement than upwards movement.

Pullback before next leg up
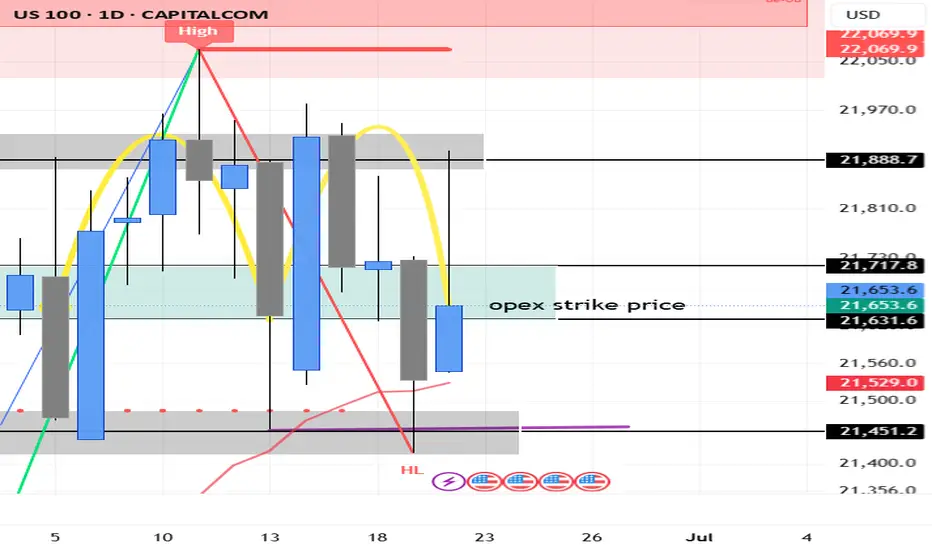
NASDAQ’s looking weak short term. We’ve seen multiple rejections from the highs, an M pattern forming on the daily, and RSI divergence creeping in on the daily — momentum is clearly fading. I already took profit around 21980. And a few small swings between the range since 3rd of June.
The rally off the tariff drop was sharp, but it feels mechanical. Bulls look tired here. You can see price is stalling — pushing into the same highs but getting nowhere. Classic signs of distribution.
That said, this isn’t the start of a full-blown bear market. The long-term trend remains bullish. AI investment is still piling into the U.S., tech’s still leading globally, and structurally we haven’t broken down yet. Some weakness is starting to show though.
But short term, I think we see a pullback. The Fed’s still sitting on the fence with rate cuts, which is creating uncertainty. Add that to the current geopolitical tensions, and there’s enough on the table to justify a temporary risk-off move.
If price breaks and closes above 21,860, I’ll reassess and potentially shift back to a bullish bias. Until then, I’m leaning short and letting price action do the talking.
My key downside levels:
TP1: 21,483 — scale out and protect.
TP2: 21,322 — potential bounce from this area.
TP3: 21,145 — structure starts to weaken.
TP4: 20,894 — bears starting to control and a deeper flush, I’ll reassess bias at this level.
SL @ 21850 on my second entry short
Short term: pullback likely.
Big picture: still bullish — but bulls need to reset before any next leg up.
XAUUSD - 23 Jun to 28 Jun 2025#XAUUSD UPCOMING WEEK:
I’m bearish on M candle 🕯️ — potential for monthly flip.
🎯 DOL: 3393
🗓️ Expect Mon/Tue to sweep BSL first at 3387 / 3403 before SSL come into play
Judas swing scenario - Mon/Tue need to sweep major BSL , else invalid
#Forex #FXTrading #WeeklyOutlook

EURUSD RangeThe PO3/ model 1 accumulation i was talking about played out perfectly. I can't tell yet, but the purpose of this accumulation could have been to come back up into supply and redistribute from there to then go lower. I will look for a valid model in case this plays out like that. (I would want to see a better model, i don't like the first deviation)

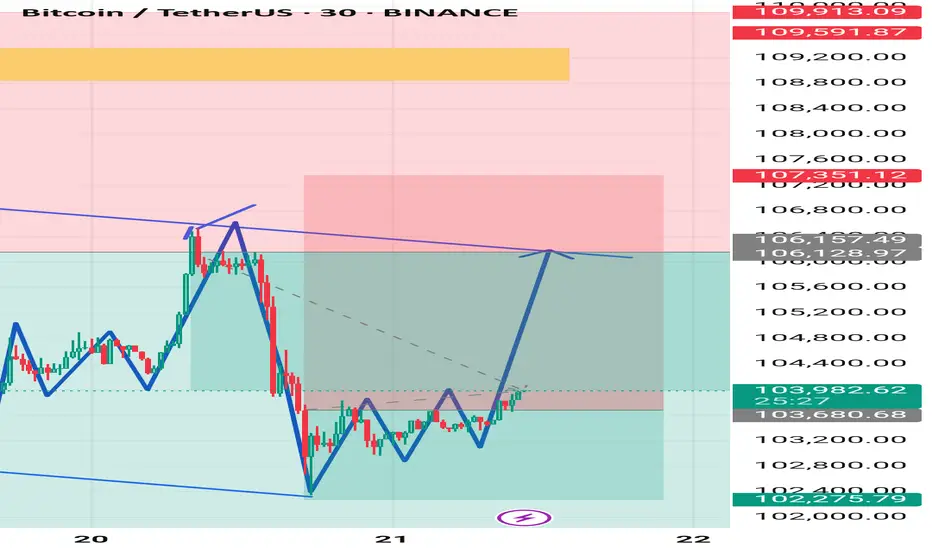
Xauusd market This chart is a 30-minute BTC/USDT (Bitcoin/Tether) technical analysis from Binance, showing a potential bullish setup. Here's a breakdown of the key elements:
1. Descending Broadening Wedge
The blue trendlines forming a broadening wedge indicate a reversal pattern.
Price has been moving within this structure and recently broke out from the bottom back toward the upper resistance line.
This pattern typically ends with a bullish breakout, especially after consolidation near the lower boundary.
2. Key Zones
Support Zone: Around $102,275 – $103,680 (light green zone).
Resistance Zone: Between $106,128 – $107,351 (light red zone), with an extended resistance up to ~$109,591 (dark red line).
3. Pattern Suggestion
The blue zigzag lines suggest a possible Inverse Head and Shoulders pattern near the current price area, indicating a bullish reversal.
A projected price path (in dotted grey) hints at a bullish move targeting the upper trendline near $106,128–$106,157, potentially a 16th–21st June breakout setup.
4. Price Action
Current price: $103,982.63, with moderate momentum (+0.66%).
The arrow projection suggests a bullish move targeting the upper resistance zone.
---
Summary:
Bias: Bullish short-term outlook.
Target Zone: $106,100–$107,300.
Invalidation: Drop below $102,275 may negate the bullish setup.
Let me know if you'd like an entry/exit plan, risk/reward analysis, or a trading strategy based on this setup.
ETHUSDT UPDATE 1DETH slipped below channel support (~ 2.45k). Weekend volume is thin—need 2 daily closes (Mon/Tue) to confirm. Hold-below sets sights on 2.2–2.0k (Fib 61-78 %). Reclaim 2.5-2.6k invalidates.

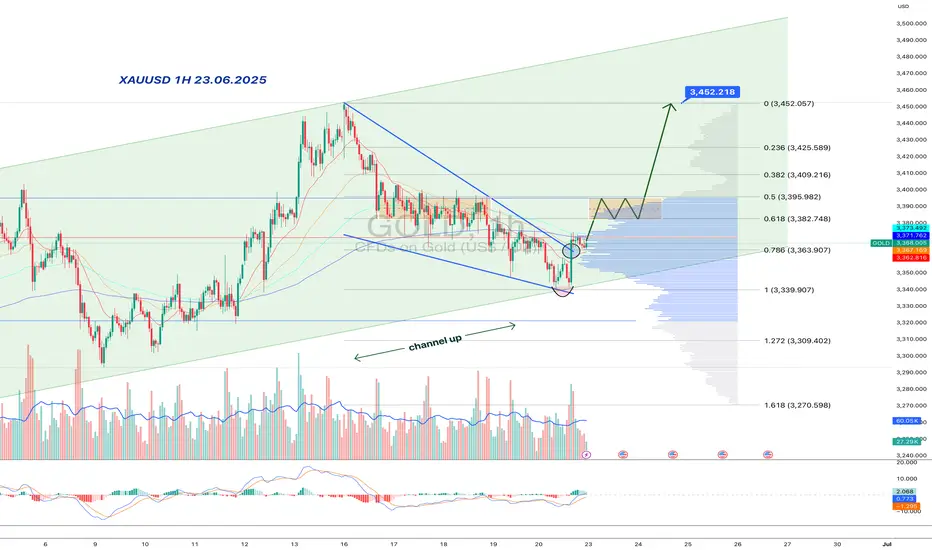
Gold:bullish wedge inside a rising channel-double trap for bearsInside the major upward channel, gold formed a falling wedge — and, of course, faked a breakdown. But the move reversed quickly: price reclaimed the wedge, surged on volume, and held above the key 3363–3368 area. This isn't just a bounce — it's a structural reclaim in line with the broader trend.
Price is now in the upper part of the rising channel and has broken a local downtrend line, reinforcing the bullish signal. Consolidation around 3380–3395 might be the last pause before acceleration. Above that lies a volume gap — no resistance until 3452.
MACD is flipping bullish, RSI turning upward, and volume confirms smart money presence. Classic: trap below, breakout above. As long as 3363 holds — longs remain in control.
Short term sell into buying zone.USDJPY is at a prime zone... Where everyone is glued and carried away with the bullish move, let me point you out to the market structure.

My btcusd analysis based on demand & supply , and central areaFirst of all btcusd in down trend , then i follow demand supply rule, from my observation.
Second point look the pressure in the hammers , it tells where the price heading, and for more confirmation wait for hammer failure and retest in the price, then you see the momentum in the price.
