PACE LONG TRADE 16-06-2025PACE LONG TRADE
Rationale
PACE recently completed an ABC correction within a bearish channel, which acted as a bull flag. The stock broke out of this channel with significantly high volumes (5x) and strong follow-through, indicating potential upside.
🚨 TECHNICAL BUY CALL – PACE🚨
- Buy 1: Current level (Rs. 6.32)
- Buy 2: Rs. 5.9
- Buy 3: Rs. 5.7
- TP 1: Rs. 6.7
- TP 2: Rs. 7.0
- TP 3: Rs. 7.4
- TP 4: Rs. 7.8
Stop Loss - Below Rs. 5.5 closing basis
Risk-Reward Ratio- 1:3.2
Caution: Close at least 50% position size at TP1 and then trail SL to avoid losing incurred profits in case of unforeseen market conditions.
PLEASE BOOST AND SHARE THE IDEA IF YOU FIND IT HELPFUL.
Chart Patterns

#NIFTY Intraday Support and Resistance Levels - 20/06/2025A flat opening is expected in Nifty today. After the open, all eyes will be on the 24,700 level, which has acted as a key support zone recently.
🔽 If Nifty starts trading below 24,700, downside momentum may pick up, with potential targets at 24,650 → 24,600 → 24,550-. Sustained weakness below 24,700 could attract short positions.
🔼 On the upside, if Nifty reclaims 24,750–24,800 and sustains, a bullish move may trigger toward 24,850 → 24,900 → 24,950+. However, 24,950 remains a strong resistance area from the past sessions.
⚠️ Strategy Note:
Market remains in a range-bound zone; wait for a decisive breakout for positional trades.
Use strict stop-losses and manage risk actively.
Ideal approach: scalp the range with quick profit booking unless a directional move confirms.

CRWV high tight flag pattern we have a breakout setting up at 162 ive taken a position at the open with a stop under 154 this is the best pattern in the market.
WE have huge momo the last month now we have the first consolidation in the run. It shoudl get bought as the fomo kicks in,

GBPUSD London Session | Live Forex Analysis & Trade ideasIn today’s London session, we conducted a detailed intraday analysis on the GBPUSD currency pair using wave structure analysis on the 5-minute (M5) timeframe.
Price action confirmed a break below bullish market structure that had previously formed the Asian session high, signalling a potential shift in market sentiment to the downside. This breakdown confirmed short-term bearish momentum shift.
Following the completion of the bearish wave, the price retraced to form a structural pullback (trend reset), providing a discounted price zone for new short positions and offering profit-taking opportunities for earlier sellers.
Our trading plan for this session is to sell GBPUSD at 1.3488, anticipating a move below the midline (ML) support at 1.3462. The technical target for this trade, based on our London-New York session projection, is set at 1.3417.
The stop-loss for this setup is placed above MH of the bearish structure at 1.3505, maintaining proper risk management.
This trade idea aligns with our trend-following strategy and is supported by real-time price action analysis.
📉 Short Bias Confirmed
🎯 Entry: 1.3488
🛑 Stop Loss: 1.3505
✅ Take Profit: 1.3417
Trade safe, manage your risk, and stay blessed.

KFINTECHAlmost 35%+ corrected from Top Line: 1641, There are good buildup showing in 1day chart frame from bottom line 1034...
Keep it on radar, it will surely blast in few weeks... Strong fundamental and Q3FY25 result was excellent..

CHECK XAUUSD SIGNAL READ CAPTAINxauusd buy now ✅
entry point (3355) (3353)
TAKE PROFIT 1: (3360)
TAKE PROFIT 2: (3370)
LAST TARGET (3378)
STOP LOSS (3345)

EURUSD Sell/ShortFundamental Analysis
EURUSD rates is being influenced by the current Eurozone's economic performance, driven by key economies like Germany and France, continues to be shaped by industrial output, consumer confidence, and inflation trends. The European Central Bank (ECB) has likely maintained a cautious monetary policy, with interest rates possibly held steady or adjusted slightly to combat inflation while supporting growth. On the U.S. side, the Federal Reserve's stance on interest rates, potentially in a tightening phase to address persistent inflation plays a critical role. Recent U.S. economic data, including GDP growth, employment figures, and consumer spending, may indicate a robust dollar, putting downward pressure on EURUSD. Additionally, geopolitical tensions, energy prices (affecting Eurozone energy imports), and trade balances between the U.S. and EU are likely contributing to volatility. Given the current date, recent ECB and Fed statements or data releases for June 2025 inflation reports.
Technical Analysis:
Based on the provided EURUSD 1D chart (covering mid-2024 to mid-2025), the following technical observations can be made:
Trend and Moving Averages:
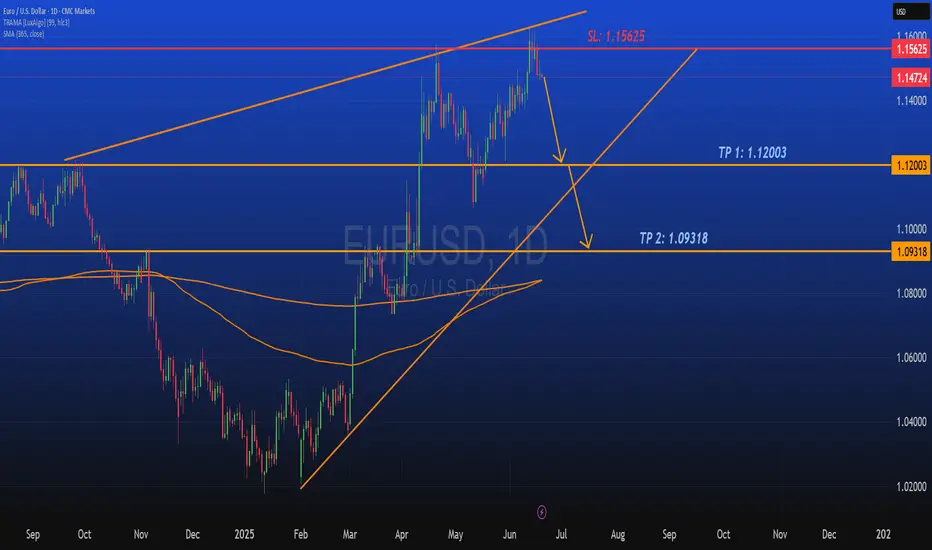
For EURUSD it shows a descending trend from a peak around 1.48 in mid-2024, with a potential reversal or consolidation forming in mid-2025. The 50-day and 200-day moving averages (depicted as orange lines) are sloping downward, with the price recently testing these levels around 1.12-1.13. A break above the shorter-term moving average could signal bullish momentum, while a failure to hold might confirm a continuation of the downtrend. Looking for key support levels here are identified at 1.09318 (TP 2) and 1.08000, with the current price hovering near 1.12003 (TP 1). Resistance is notable at 1.15625 (SL) and the previous high near 1.4800. The price action suggests a potential bounce from the recent low, with the next target being the resistance zone around 1.15625 if bullish momentum persists. Candlesticks and volume patterns are showing a recent green candlesticks indicate buying pressure, potentially forming a reversal pattern near the 1.12 level. Volume analysis would confirm the strength of this move, with higher volume on upticks supporting a breakout.
Overall Bias:
The technical setup suggests a short-term bullish correction within a broader bearish trend, contingent on breaking and holding above 1.15625. A drop below 1.09318 would invalidate the bullish case and resume the downtrend toward 1.08000 or lower.
Sentiment Analysis
Market sentiment as of June 2025 likely reflects heightened interest in EUR/USD due to recent economic data and central bank policies. Traders and analysts are closely watching for signs of ECB rate cuts or Fed rate hikes, which could sway the pair. On social platforms and financial forums, there may be a mix of caution and optimism looking out for caution due to the Eurozone's economic challenges (energy costs, political uncertainty), and optimism if U.S. data softens, weakening the dollar. The chart's visibility on trading platforms suggests retail and institutional traders are actively monitoring this pair, with a focus on the 1.12-1.16 range as a critical decision point. Sentiment could shift rapidly based on upcoming economic releases or geopolitical developments.
Conclusion
The EUR/USD pair is at a pivotal juncture, with fundamentals pointing to a stronger USD due to Fed policy, while from a technical standpoint suggest a short-term bounce toward 1.15625 if support at 1.12003 holds. Sentiment indicates active trader interest, with eyes on central bank moves. A break above resistance could target 1.4800 (long-term), while a failure might see a decline to 1.08000. Monitor upcoming data for confirmation.
$COIN 30% Pullback Confirms if we Fakeout Recent 15%+ Rally 🧨 COIN SHORT TRADE IDEA — FAKEOUT TRAP IN PLAY
Ticker: NASDAQ:COIN
Date: June 20, 2025
Thesis: Breakout trap setup — expecting a rug pull / red reversal tomorrow to confirm.
🔍 Context
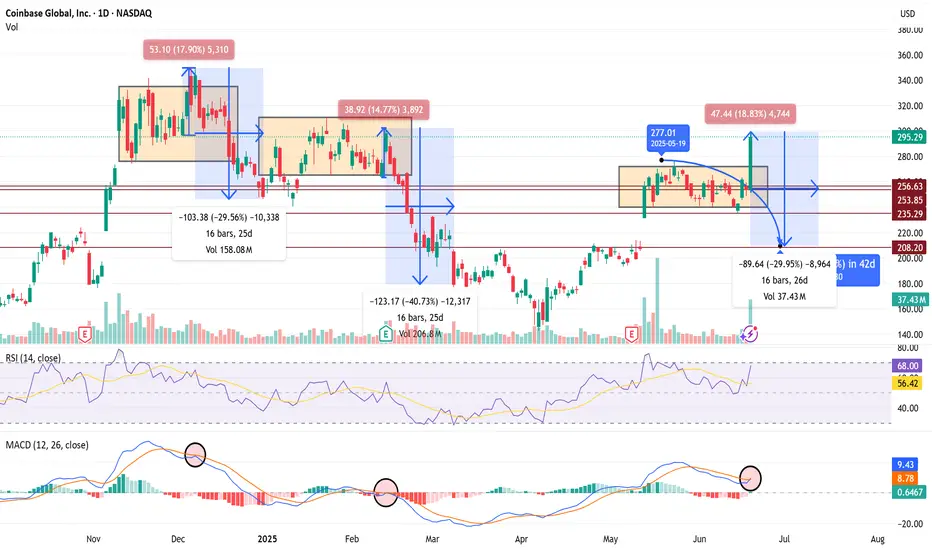
Price broke above range today with a big +18.8% candle to $295 — but...
Volume spike may signal exhaustion, not strength.
RSI = 68 → near overbought
MACD curling into a bearish cross — same signal preceded the last -30% and -40% drawdowns.
History: Same range-break setups in Dec and Feb collapsed hard (-30 to -40%) over 16–25 days.
💣 Trade Plan (Short Setup)
Entry Trigger:
🔻 Enter short if price closes below $277 tomorrow — confirms breakout trap.
Targets:
🎯 Target 1: $253 (top of old range)
🎯 Target 2: $235 (mid-range support)
🎯 Target 3: $208 (full breakdown move, matches last 2 cycles)
Stop Loss:
🛑 Above $297 (breakout highs)
Timeframe:
1–3 weeks (16–26 bars historically)
🧠 Bias
Bearish unless bulls hold $280+. If we get a big red daily candle tomorrow, fakeout confirmed — high-probability follow-through expected.
USD/JPY(20250620)Today's AnalysisMarket news:
The Bank of England kept interest rates unchanged at 4.25%, and the voting ratio showed that internal differences were increasing. Traders expect the bank to cut interest rates by another 50 basis points this year.
Technical analysis:
Today's buying and selling boundaries:
145.32
Support and resistance levels:
146.35
145.96
145.72
144.93
144.68
144.30
Trading strategy:
If the price breaks through 145.72, consider buying, and the first target price is 145.96
If the price breaks through 145.32, consider selling, and the first target price is 144.93

Xauusd Still on bearish mode towards 3330H4 Timeframe Analysis
Gold is currently holding the falling wedge pattern on H4 and Range of 3330-3380 .im still expecting one more Drop then Upside move.Last sell trade is successfully 280 pips TP Hit
if gold sustained with this falling wedge pattern with drop of Accumulation behaviour if market remains bearish my 1st target is 3330 then 3320 on intraday.i
3325-3320 is the optimal structural support below area and potential buyying area ,if The H4 & H1 candle closes above 3330-3332 I will took buy and my Targets will be 3350 then 3365.
#XAUUSD

ETH/USDT Key Levels Reclaimed on 4HOn the 4H, price has closed above the 5D + 3D, and W resistance levels.
Will these levels hold and become a launchpad for new higher highs—and possibly counter the 200MA?
We can’t know for sure, but we can make educated guesses.
Always take profits and manage risk.
Interaction is welcome.

Bitcoin Cash price action is interestingBINANCE:BCHUSDT price action in comparison with BTC and the remaining crypto assets price action is signaling that the coin is on to something, I expect this outperformance to continue. Anticipate price action is shown on the chart, long on the pullback towards 10 days moving average, stop level 450$.
PS. My views only, not financial advice!

GOLD: Move Up Expected! Long!
My dear friends,
Today we will analyse GOLD together☺️
The in-trend continuation seems likely as the current long-term trend appears to be strong, and price is holding above a key level of 3,348.30 So a bullish continuation seems plausible, targeting the next high. We should enter on confirmation, and place a stop-loss beyond the recent swing level.
❤️Sending you lots of Love and Hugs❤️

EURUSD: Move Down Expected! Short!
My dear friends,
Today we will analyse EURUSD together☺️
The market is at an inflection zone and price has now reached an area around 1.15208 where previous reversals or breakouts have occurred.And a price reaction that we are seeing on multiple timeframes here could signal the next move down so we can enter on confirmation, and target the next key level of 1.15133..Stop-loss is recommended beyond the inflection zone.
❤️Sending you lots of Love and Hugs❤️

USOIL:Waiting to go long
The impact of the news is still continuing, the situation did not ease in a short period of time, there is still a rise, the above large space to see 76-77, trading ideas on the long space and advantages are greater. Intraday short - term trading to consider low long.
Trading Strategy:
BUY@72.8-73.2
TP: 74.5-75
More detailed strategies and trading will be notified here ↗↗↗
Keep updated, come to "get" ↗↗↗

EURUSDLarge speculators are heavily long EUR while USD longs are mild.
EUR (base) is fundamentally stronger than USD (quote), giving bullish bias for EUR/USD.

Gold XAUUSD Possible Move🚨 Trade Setup Alert
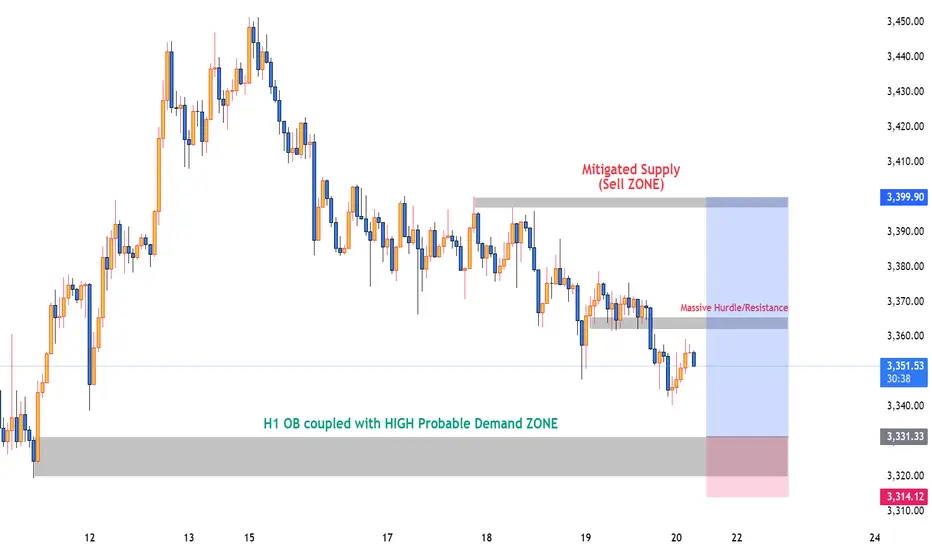
📍 H1 Orderblock Zone at 3330–3320
🔑 High-probability BUY setup after liquidity sweep 🟢
🎯 Target: 3362 and possibly 3396+
🛑 SL below 3315
📍 Mitigated Supply Zone at 3396–3400
🔻 Possible SELL setup if price rejects that level 🔴
🎯 Target: 3365 / 3340
🛑 SL above 3412
⚠️ Key Level: 3362–3365 must break to reach upper supply zone.
✅ A level viz. 3340 shared yesterday, I bought from 3340 and bagged +180 pips 💸
👀 Watch price action closely near these zones for confirmation.
📊 Trade with proper risk management! 💼
BITCOIN BEARS WILL DOMINATE THE MARKET|SHORT
BITCOIN SIGNAL
Trade Direction: short
Entry Level: 105,952.89
Target Level: 102,605.64
Stop Loss: 108,184.39
RISK PROFILE
Risk level: medium
Suggested risk: 1%
Timeframe: 4h
Disclosure: I am part of Trade Nation's Influencer program and receive a monthly fee for using their TradingView charts in my analysis.
✅LIKE AND COMMENT MY IDEAS✅

NH : An upcoming entry Will be looking forward for an entry in this scrip if price retests the ATH. The entry will be taken with 1% risk. The target levels might vary depending on the momentum in the coming days.
Entry is invalid if the current high is taken out.
📢📢📢
If my perspective changes or if I gather additional fundamental data that influences my views, I will provide updates accordingly.
Thank you for following along with this journey, and I remain committed to sharing insights and updates as my trading strategy evolves. As always, please feel free to reach out with any questions or comments.
Other posts related to this particular position and scrip, if any, will be attached underneath. Do check those out too.
Disclaimer : The analysis shared here is for informational purposes only and should not be considered as financial advice. Trading in all markets carries inherent risks, and past performance is not indicative of future results. It’s essential to conduct your own research and assess your risk tolerance before making any investment decisions. The views expressed in this analysis are solely mine. It’s important to note that I am not a SEBI registered analyst, so the analysis provided does not constitute formal investment advice under SEBI regulations.

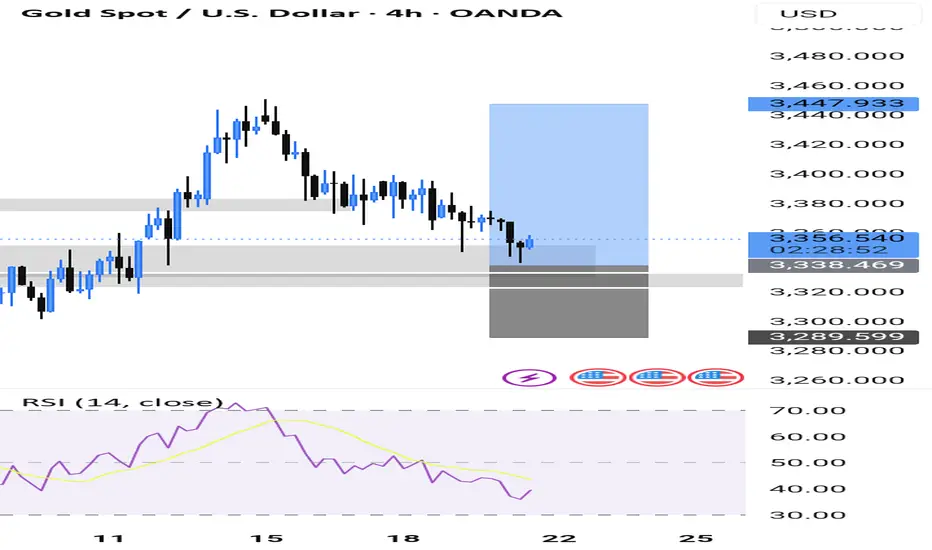
Bearish Technicals prevailedTechnical analysis: Despite the strong Bearish candle sequence on the DX (few percents down), Gold remains on losses however above my Support for the session as the U.S. session approaching and geo-political tensions resurfacing. However, #3,395.80 is new Resistance zone made by the Hourly 4 candlestick configuration. Gold is pulling back again after it failed to break above it’s Resistance variance (#3,388.80 - #3,395.80 - #3,402.80) on the Hourly 4 chart, while #3,352.80 benchmark configuration is protecting the eminent downtrend. This sequence is similar to the September #24 - #28 pattern when a Double Bottom was made before the strong rebound. Also current Gold's impulse and rejection was Highly correlated with the side Swings on the Bond Yields market, happening on Hourly basis. As discussed, Gold is Trading within Descending Channel and that fractal is Buying back every dip and postponing the downtrend and pointing me that Gold should be timed for consolidation session (regarding Short-term). I am looking to complete a full oscillation towards #3,327.80 if #3,342.80 - #3,352.80 gives away, in the same time my main point of interests. I am expecting recovery however within #1 - #3 sessions if DX extend the Selling sequence and remain with a Daily chart proportions decline. My practical suggestion would be to wait for a break-out and then make a move, since at the moment - there is a clash between Bearish Technicals on Gold and Fundamental war escalation uncertainty which could make Investors park their capital from Gold into more riskier assets - and vice versa. Consequently the current consolidation and another Bearish wave should come as no Technical surprise, only if Fundamentals do not arise Buyers of the market.
My position: As my Profit quota for the week / Month is already acquired, I will not take any more orders for today's session. I lean of course more to Bearish side Intra-day, however even if I engage, will be Scalp order rather than positioning myself for #10 - #20 point move.

Squeeze Building in BTC – Targeting 100,500 ShortPrice is coiling between interest zones above and a heap of liquidity below. Expecting an impulsive break—looking to short down to ~100,500.

GOLD IS READY FOR PUMPGold after printing a high it reverse and print higher low at fib level 0.618 and 0.782 which is golden key level for reverse and mostly likely print new high