TIME and PRICE Structure for BTC (Intraday)Vertical lines represent cycle clusters.
The price tends to change direction or breakout/accelerate around these timelines.
The right-hand table shows cycle intensity for the next days.
Chart Patterns

EURUSD H1 I Bearish Reversal Based on the H1 chart, the price is rising toward our sell entry level at 1.1548, a pullback resistance that aligns with the 50% Fib retracement and the 127.25 Fib extension, providing a significant level for a potential bearish reversal.
Our take profit is set at 1.1487, a pullback support.
The stop loss is set at 1.1602, a swing high resistance.
High Risk Investment Warning
Trading Forex/CFDs on margin carries a high level of risk and may not be suitable for all investors. Leverage can work against you.
Stratos Markets Limited (tradu.com ):
CFDs are complex instruments and come with a high risk of losing money rapidly due to leverage. 63% of retail investor accounts lose money when trading CFDs with this provider. You should consider whether you understand how CFDs work and whether you can afford to take the high risk of losing your money.
Stratos Europe Ltd (tradu.com ):
CFDs are complex instruments and come with a high risk of losing money rapidly due to leverage. 63% of retail investor accounts lose money when trading CFDs with this provider. You should consider whether you understand how CFDs work and whether you can afford to take the high risk of losing your money.
Stratos Global LLC (tradu.com ):
Losses can exceed deposits.
Please be advised that the information presented on TradingView is provided to Tradu (‘Company’, ‘we’) by a third-party provider (‘TFA Global Pte Ltd’). Please be reminded that you are solely responsible for the trading decisions on your account. There is a very high degree of risk involved in trading. Any information and/or content is intended entirely for research, educational and informational purposes only and does not constitute investment or consultation advice or investment strategy. The information is not tailored to the investment needs of any specific person and therefore does not involve a consideration of any of the investment objectives, financial situation or needs of any viewer that may receive it. Kindly also note that past performance is not a reliable indicator of future results. Actual results may differ materially from those anticipated in forward-looking or past performance statements. We assume no liability as to the accuracy or completeness of any of the information and/or content provided herein and the Company cannot be held responsible for any omission, mistake nor for any loss or damage including without limitation to any loss of profit which may arise from reliance on any information supplied by TFA Global Pte Ltd.
The speaker(s) is neither an employee, agent nor representative of Tradu and is therefore acting independently. The opinions given are their own, constitute general market commentary, and do not constitute the opinion or advice of Tradu or any form of personal or investment advice. Tradu neither endorses nor guarantees offerings of third-party speakers, nor is Tradu responsible for the content, veracity or opinions of third-party speakers, presenters or participants.

XAUUSD – Is a Trend Reversal Brewing Amid US Debt Fears?While gold continues to hover within a tight trading channel for the sixth consecutive week, a major macroeconomic alarm has just been sounded — Goldman Sachs has flagged rising concerns over the trajectory of US debt. For Indian market participants, this could mark a turning point worth close attention...
🌐 MACRO PERSPECTIVE: US DEBT REACHING UNSUSTAINABLE LEVELS
America’s fiscal landscape is approaching a critical threshold. The national debt is projected to exceed previous wartime levels, and interest payments alone may cross $1 trillion by 2025 — eclipsing even core sectors like defense and healthcare.
Goldman Sachs has raised concerns that if no corrective fiscal steps are taken soon, the US could be forced into abrupt austerity measures — possibly shrinking GDP without significantly reducing the debt burden.
Key drivers: unchecked government expenditure, surging borrowing costs, and ongoing political polarization.
📌 For Indian gold traders, such economic vulnerability tends to weigh on the US dollar, fueling renewed interest in gold as both a safe haven and a strategic inflation hedge — assets long favored by Indian investors.
📉 TECHNICAL INSIGHT (M30/H1 UPDATE)
Price action on gold continues to respect a defined descending channel. The zone near 3,338.422 serves as a short-term pivot, while resistance looms at the upper channel line near 3,368.048.
The EMA ribbon alignment is pointing downward, reinforcing bearish momentum in the short term.
Should price fail to breach 3,368, we anticipate a retracement toward the Fair Value Gap (FVG) around 3,325.783, potentially extending deeper to the 3,309.256 zone.
✅ ACTIVE TRADING LEVELS
🟢 Buy Zone: 3310 – 3308
Stop: 3303
Targets: 3314 → 3318 → 3322 → 3326 → 3330 → 3340 → 3350 → 3360 → ...
🟢 Buy Scalp: 3325 – 3323
Stop: 3318
Targets: 3330 → 3334 → 3338 → 3342 → 3346 → 3350 → 3360 → 3370 → ...
🔴 Sell Zone: 3418 – 3420
Stop: 3424
Targets: 3414 → 3410 → 3405 → 3400 → 3396 → 3390 → 3385 → 3380
🔴 Sell Scalp: 3396 – 3398
Stop: 3403
Targets: 3392 → 3388 → 3384 → 3380 → 3375 → 3370
💬 INDIAN TRADERS – KEY TAKEAWAYS
As the week draws to a close, post-holiday volatility from the US market may introduce unexpected price moves. Be prepared for sudden spikes that could signal either a clean breakout or a smart money trap.
✅ Maintain discipline with your stop-loss and take-profit levels. Don’t chase the market — let it confirm your strategy. Gold remains technically bearish, but any fundamental catalyst — especially from US fiscal instability — could reverse the trend sharply.
Stay ready. Stay smart. Let the charts lead the way.

GJ-Fri-20/06/25 TDA-Will weekly candle close above WR 195.834?Analysis done directly on the chart
Follow for more, possible live trades update!
Feedback from you guys:
1) Is daily posting really helpful or better focus on
less posts?
2) Is there any way to improve more the quality
of posts?
Comment down below, really appreciate the responses!
Active in London session!
Not financial advice, DYOR.
Market Flow Strategy
Mister Y

USDJPY – Bearish Pressure Builds Amid Fed Dovish ExpectationsFX:USDJPY is trading around the 145.300 mark and showing signs of weakness, as the US dollar comes under pressure from growing expectations that the Federal Reserve may begin cutting interest rates in September. This sentiment is fueled by recent soft US data, including weaker retail sales and industrial production.
Meanwhile, the Japanese yen is regaining some strength, supported by safe-haven demand amid geopolitical tensions in the Middle East and possible intervention signals from the Bank of Japan.
In the short term, I lean toward a corrective pullback scenario while awaiting clearer signals from the Fed.

Gold Outlook: Sharp Breakout or Pullback Ahead?Despite heightened geopolitical tensions alongside a weak US Dollar, gold's price action remains in pullback mode below the $3,400 level, awaiting a catalyst.
Technically, gold remains at the upper boundary of a long-term ascending channel, anchored by the 2016 and 2020 highs. It also sits just beneath the projected breakout zone of a large cup-and-handle pattern, with a potential target near $4,000.
If gold manages a firm close above $3,500 and clears the upper boundary of the channel, bullish momentum could lift prices toward $3,700, and possibly $4,000, during the second half of 2025.
Conversely, sustained weakness below the $3,300 level would open the door to near-term support zones at $3,290, $3,240, $3,100, and $2,800, which may offer "buy-the-dip" opportunities along its primary uptrend.
- Razan Hilal, CMT

Bitcoin Consolidates Liquidity Around $105,000FenzoFx—Bitcoin is trading sideways near $104,650 after a sharp drop from $109,000, forming a high-liquidity zone with potential for a breakout.
The $102,746–105,266 range shows strong accumulation, offering support. BTC remains bullish above the previous week's low, but must close above the previous day's high to resume its uptrend.

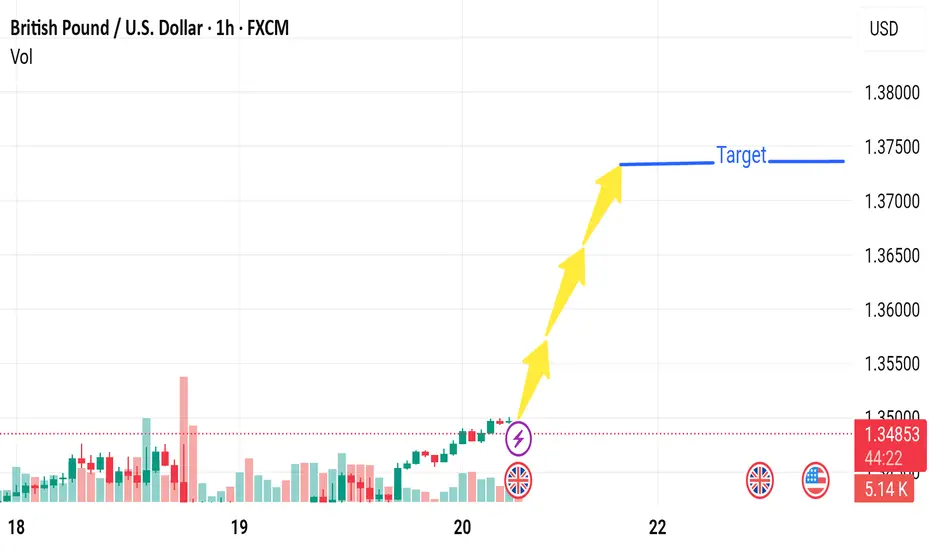
Market next target
🔻 Bearish Disruption Analysis
1. Overbought Conditions / RSI Exhaustion
The recent bullish momentum appears strong, but it could be entering overbought territory, especially on the 1-hour chart.
A correction may follow if technical indicators like RSI or MACD start diverging.
2. Resistance Zone at 1.35000 - 1.35500
The price is nearing a historical resistance area around 1.3500–1.3550, where sellers have previously stepped in.
Without strong volume or a news catalyst, this zone may reject further upside movement.
3. Low Volume Breakout
The breakout visible before the arrows is accompanied by relatively moderate volume, which can indicate a false breakout or bull trap.
4. Fundamental Uncertainty
Upcoming U.S. or UK economic data (indicated by the flags on the chart) could disrupt the expected bullish move.
Example: A strong USD labor report or hawkish Fed comment could reverse the GBP/USD rally.
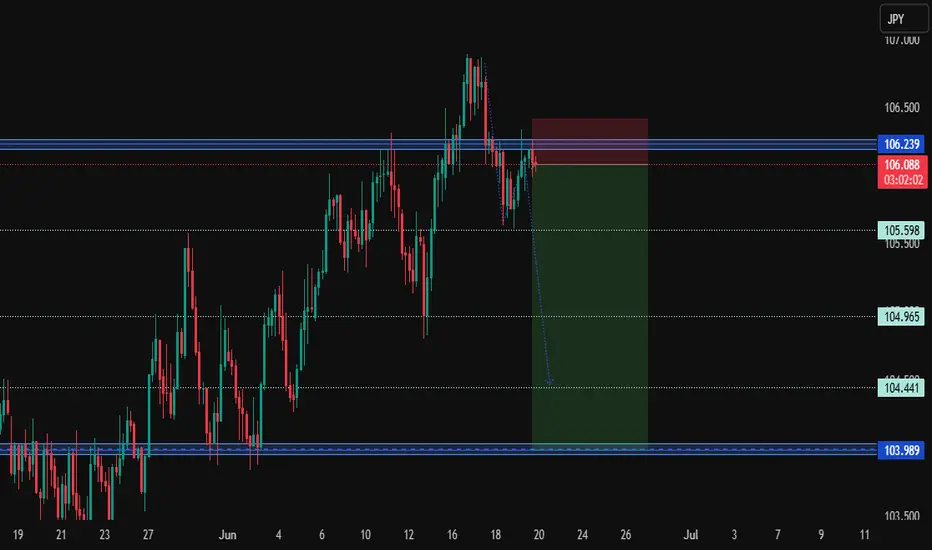
CADJPY Rejected from Resistance – Bearish Setup UnfoldingHey Traders,
CADJPY has reacted sharply to the 106.20 resistance zone, forming a potential lower high and setting the stage for a short-term bearish reversal. The price appears to be respecting the previous structure, and a drop toward the 105.00 and 104.00 regions may be on the cards if downside momentum builds.
Current Market Conditions:
Strong rejection at the 106.20–106.30 resistance level, which has historically acted as a supply zone.
Price is now hovering just below resistance and may confirm a bearish structure on lower timeframes.
Clean downside path if 105.60 is broken, potentially opening space down to 104.40, with extended downside support at 103.98.
Risk-reward ratio looks favorable from current levels if resistance holds.
Fundamental Analysis/Outlook:
The Canadian dollar has been under pressure as crude oil prices retreat, reducing demand for the CAD due to its strong correlation with oil. Additionally, the Bank of Canada’s recent rate guidance hinted at a more dovish stance compared to the Fed and BoJ, limiting CAD upside.
Meanwhile, JPY is drawing strength from rising demand for safe-haven assets amid ongoing geopolitical concerns and recent risk-off sentiment triggered by global growth worries. With central banks showing policy divergence and investor caution rising, CADJPY may face continued downward pressure.
Targets:
TP1: 105.60
TP2: 104.44
TP3: 103.98
Risk Management:
Stop-Loss: Above 106.40 to protect against bullish continuation
Confirm bearish price action (e.g., break and retest of intraday lows) before fully committing
Maintain proper lot size to manage drawdown across correlated yen pairs
Technical Outlook:
Price failing to sustain above key resistance
Lower high formation evident
Clean liquidity zones to the downside provide favorable structure for bearish continuation
Conclusion:
CADJPY looks poised for a potential reversal after rejecting major resistance. Watch for confirmations below 105.60 to increase conviction. The setup aligns with both technical and fundamental bias for yen strength.
Sign-off:
"In trading, the most dangerous words are 'it’s different this time.' Trust the chart, trust the process."
I would love to hear your thoughts in the comment section, and please hit boost and follow for more ideas. Thank you, and profitable trading to you all!
AUDCAD SHORT FORECAST Q2 W25 D20 Y25AUDCAD SHORT FORECAST Q2 W25 D20 Y25
Professional Risk Managers👋
Welcome back to another FRGNT chart update📈
Diving into some Forex setups using predominantly higher time frame order blocks alongside intraday confirmation breaks of structure.
💡Here are some trade confluences📝
✅Weekly 50 EMA
✅Weekly order block rejection
✅Daily order block rejection
✅15’ order block identification
🔑 Remember, to participate in trading comes always with a degree of risk, therefore as professional risk managers it remains vital that we stick to our risk management plan as well as our trading strategies.
📈The rest, we leave to the balance of probabilities.
💡Fail to plan. Plan to fail.
🏆It has always been that simple.
❤️Good luck with your trading journey, I shall see you at the very top.
🎯Trade consistent, FRGNT X

Reversal in Play or Institutional Continuation? | NAS100USDCritical Zone with VEP Trader ⚠️
Nasdaq 100 (NAS100USD) is showing mixed signals — and it’s exactly in these types of setups that our VEP Trader strategy shines. Here's what I'm seeing and how we're breaking it down step by step.
🔍 1. Trend Confirmation (1D)
On the daily timeframe, NAS100USD is showing a weak bullish trend based on the Support & Resistance and the Squeeze Momentum indicators.
📉 However, the most recent daily candle swept liquidity from two key days:
📅 June 6
📅 June 13
This triggers an alert in our VEP strategy: liquidity taken = institutional zone possibly in play.
💧 2. Liquidity Sweep + FVG (Fair Value Gap)
After the sweep, switching to the 1-hour timeframe (1H) reveals a large Fair Value Gap (FVG) just below the cleared liquidity zone.
This offers a potential setup — only if price returns to that FVG, and the structure validates the trade:
Retest the FVG zone
Show signs of reversal structure
Confirm with bullish Squeeze Momentum on lower timeframes
🛠️ 3. Execution with VEP Trader
🎯 If price pulls back into the FVG, we’ll be watching for:
Bullish reaction after liquidity has been swept
Clear bullish divergence in momentum
Previous support and EMA alignment in 5M/2M charts
🟢 If all conditions align → possible CALL entry based on VEP structure.
⛔ Stop Loss & 🎯 Take Profits (VEP Guidelines)
Suggested SL: below the FVG or last clean low
TP1: immediate reaction zone or recent high
TP2: next liquidity zone above. Up to four TP
Or target the last pullback for a more secure exit
✅ Final Thoughts
This is a classic scenario where we don’t guess — we wait for institutional confirmation.
The VEP Trader Strategy guides us with Vision, Execution, and Precision.
👉 What do you think?
Is NAS100USD gearing up for a new leg up — or was that just a liquidity flush before a deeper move?
Drop your take in the comments 👇
#NAS100USD
#VEPTrader
#FairValueGap
#LiquiditySweep
#SmartMoneyConcepts
#PriceAction
#TechnicalAnalysis
#InstitutionalTrading
#MarketStructure
#CleanSetup
#DivergenceSetup
#MomentumAnalysis
#GapTrading
#TradeWhatYouSee
#ScalpingForex
#AlgoPro
#ForexNAS100
#LiquidityZones
#SqueezeMomentum
#IntradaySetup
#BreakdownStrategy
#SupportResistance
#ReversalWatch
#PrecisionTrading
#TradingPlanReady

GBPUSD(20250620)Today's AnalysisMarket news:
The Bank of England kept interest rates unchanged at 4.25%, and the voting ratio showed that internal differences were increasing. Traders expect the bank to cut interest rates by another 50 basis points this year.
Technical analysis:
Today's buying and selling boundaries:
1.3439
Support and resistance levels:
1.3526
1.3494
1.3473
1.3406
1.3385
1.3353
Trading strategy:
If it breaks through 1.3473, consider buying, and the first target price is 1.3494
If it breaks through 1.3439, consider selling, and the first target price is 1.3406

Five investment in Fusion Energy EFT'sFusion generation is coming on line in the next five years. This is a list of ETF's which track the Fusion generation companies.

SILVER $ GOLD UpdateYou can follow us for more Analysis(Images and Videos) with Precise definition of the Financial Market.ENJOY!!!

Gold hits bottom again and is waiting to reboundAs of today, Friday, gold is still fluctuating and adjusting in the lower range, but from the 4-hour market trend, the gold trend is still dominated by bulls. In the short term, gold fluctuates at a low level. Today, Friday, we will first focus on the support level of 3347-53 below, which is also the starting point of the rebound yesterday. If this position is not broken today, Friday, we will mainly focus on the rebound and bullish closing. From the 4-hour analysis, the support below focuses on 3347-53, and the short-term resistance above focuses on the 3380-83 level. Focus on the suppression of 3408-3415. Continue to rely on this range to maintain the main tone of high-altitude low-multiple cycle participation. In the middle position, watch more and move less and be cautious in chasing orders, and wait patiently for key points to enter the market.
Gold operation strategy:
Go long on gold when it falls back to 3347-53, stop loss 3338, target 3380-3383, and look at 3408-15 if it breaks;

ABC Bullish Hello awesome traders, hope you're having a great week!
We’ve got a clean ABC bullish setup unfolding beautifully on EURUSD 4H:
🔶 Pattern: ABC Bullish
🕓 Timeframe: 4H
⚡️ Structure: AB=CD completion at 61.8% with PRZ confluence
📍 Entry Level: 1.15058 (confirmed breakout + retest)
🎯 Target 1: 1.16006 (AB=CD)
🎯 Target 2: 1.16561 (extended projection)
🛑 Invalidation: Below 1.13717 (D-point)
Technical Highlights:
✅ 61.8% retracement support at D
✅ 78.6% BC retracement
✅ Price bounced cleanly and is consolidating above EL
✅ Momentum build above structure, higher lows in play
📊 Watching for continuation toward 1.1600 and beyond if structure holds.
Trade smart, protect capital, and let the pattern do the work!

GOLD/USD Trade setup is a SHORT POSITIONndicates a long entry based on breakout/reversal from a previous level.
Entry near support/volume spike indicates an expectation of downward momentum.
Volume profile analysis supports the thesis by identifying liquidity zones.

XAU/USD Technical Analysis 📊 XAU/USD Technical Analysis (June 18, 2025)
🟢 Current Market Overview
Price: $3,381.19
The market is currently trading within a defined range, showing consolidation above a strong support zone.
🔍 Key Technical Levels
Support Zone: $3,360 – $3,375
This level has been tested multiple times and held firmly, indicating strong buying interest 📈.
Resistance Zone: $3,435 – $3,455
Price has previously rejected this zone, suggesting active sellers in this area ⚠️.
🧠 Price Action Insight
The recent price structure shows a pullback into support after a strong bullish move.
The current consolidation suggests accumulation before a potential breakout.
A bullish reversal pattern seems to be forming near support, pointing toward a possible rally toward resistance.
📈 Projected Move
📍 Scenario: Bounce from support zone → Break toward resistance.
The marked projection curve suggests price may retest support, then rally to the $3,440–$3,455 resistance area.
🧾 Trading Outlook
Bias: Bullish (above $3,360)
Entry Zone: $3,365 – $3,375
Target: $3,440 – $3,455
Invalidation: Break and close below $3,355 (would indicate weakness) 🚫
📅 Fundamental Context
Multiple high-impact USD events are approaching 🇺🇸 (noted at the bottom of the chart). These could cause volatility and may act as catalysts for the breakout.
✅ Conclusion
The market is currently in a bullish accumulation phase above strong support. As long as this level holds, a move toward the resistance zone remains the high-probability scenario. Monitor closely for confirmation via bullish candlesticks or volume increase.

GOLD/USD Price fails to break above, showing strong selling 1. Supply Zone (Top-Right):
Multiple bearish reactions.
Price fails to break above, showing strong selling pressure.
2. Demand Zone (Lower-Mid):
Previous bullish reaction zone.
Price is currently testing this demand area again for a potential long setup.
3. Liquidity Zones:
Equal lows and equal highs suggest liquidity resting below and above, potential for stop hunts before real move.
---
📌 Trade Setup
Entry: Long trade initiated from demand zone.
Stop Loss: Tightly placed below the refined demand zone.
Take Profit: Extended to prior structure highs near the supply zone.
Risk-Reward: Approx. 1:4+ — strong RRR (Risk-to-Reward Ratio), indicating disciplined execution.
---
🔧 Technical Tools Used
Imbalance Zones: Highlighted areas where price moved too quickly (FVG - Fair Value Gaps).
Mitigation Blocks: Zones where previous supply/demand has been mitigated, aligning with institutional concepts.
Refined OBs (Order Blocks): Marked for sniper entries.
---
🎯 Professional Insights
This chart demonstrates smart money concepts: price respecting refined institutional levels and reacting to liquidity zones.
The bullish setup from demand aligns with a potential market reversal or deeper pullback in a larger bearish leg.
The trader is executing with precision, aiming for maximum efficiency in entry and risk control.

EURUSD on the riseYesterday, EURUSD failed to continue its pullback and has already recovered the drop caused by the news.
This suggests the correction might be over, and we could be seeing the start of a new bullish move.
The target is a breakout above the previous highs, aiming for 1,1706.
All positions we’re looking for are only in the direction of the main trend.

Market next move 🟥 Disrupted Analysis: Bearish Divergence on EUR/USD (1H)
Weak Support Zone:
The price labeled as "Support" was never a well-tested zone. It appears to be a minor structure, and the bounce lacks strong confirmation or significant volume.
Volume Decline During Rise:
The recent upward candles show shrinking volume, a sign that the buying momentum is weakening, not strengthening. Bulls are losing energy.
Potential Double Top Formation:
If price action near current levels stalls, a double top could form, which is a classic bearish reversal pattern. Watch for rejection below 1.1550.
Bearish Target Zone (if reversal begins):
First target: 1.1450 (minor support)
Break below that opens 1.1370 zone (volume support area)
---
📉 Disrupted Price Path (Opposing the Yellow Arrow)
Rejection
↓
┌─────────┐
│ ▼
│ Pullback to "Support"
▼ │
Breakdown │
▼ │
Target Zone ▼

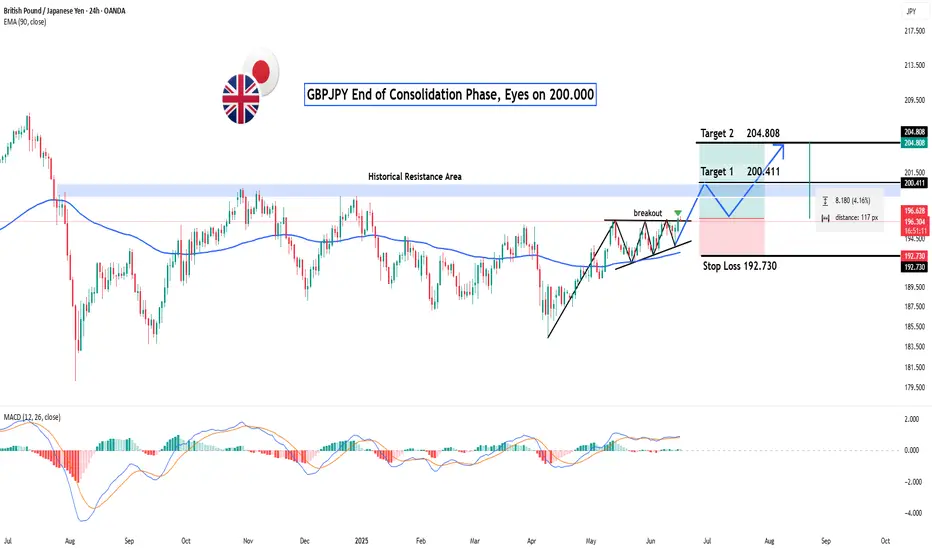
GBPJPY: End of Consolidation Phase, Eyes on 200.000?Hey Realistic Traders!
Could this be the beginning of a major bullish wave ?
Let’s Break It Down..
On the daily timeframe, GBPJPY has formed a Symmetrical Triangle Pattern, followed by a bullish breakout, a classic technical signal that typically marks the end of a consolidation phase and the start of a new bullish trend. This move is further confirmed by the appearance of a strong bullish candlestick, reflecting a surge in buying momentum.
Supporting this bullish scenario, the MACD indicator has also formed a bullish crossover, where the MACD line crosses above the signal line. This crossover is widely regarded as a momentum shift from bearish to bullish, strengthening the case for continued upward movement.
Given these technical signals, the price is likely to advance toward the first target at 200.411, with a potential extension to 204.808.
This bullish outlook remains valid as long as the price holds above the key stop-loss level at 192.730.
Support the channel by engaging with the content, using the rocket button, and sharing your opinions in the comments below.
Disclaimer: "Please note that this analysis is solely for educational purposes and should not be considered a recommendation to take a long or short position on OANDA:GBPJPY ".
Xauusd market update This chart shows the Gold Spot vs. U.S. Dollar (XAU/USD) on the 2-hour timeframe, and it's suggesting a potential bullish breakout setup based on the following elements:
---
📊 Chart Analysis Summary:
🔷 Pattern Formed:
A falling wedge pattern has developed (highlighted in the final descending channel).
Falling wedges are typically bullish reversal patterns, especially when formed after a downtrend.
🔽 Prior Movement:
The price initially rose in an upward channel until around June 16.
After that, a corrective downtrend began, forming the wedge.
📈 Current Action:
The wedge is narrowing, and the price appears to be consolidating near support, with the potential to break out upward soon.
The upward arrow and shaded box indicate the projected target zone if a breakout occurs.
🎯 Target Levels:
If a breakout happens, the target range is marked between ~3,466.83 and ~3,537.17.
This is in line with the height of the wedge projected from the breakout point.
---
🧭 Key Support & Resistance:
Support levels: 3,327.707 → 3,304.348 → 3,264.135
Resistance levels: 3,466.831 → 3,511.496 → 3,537.167
---
🔔 Indicators & Signals:
The purple lightning bolt and U.S. flag icons likely denote upcoming economic events/news, which could act as catalysts for volatility and breakout confirmation.
---
📌 Conclusion:
This setup suggests bullish momentum could be building, especially if price breaks above the wedge’s upper trendline with volume. If confirmed, it may rally toward the 3,466–3,537 resistance area.
---
Would you like a detailed trade plan (entry, stop-loss, take-profit), or are you analyzing this setup for educational purposes?
