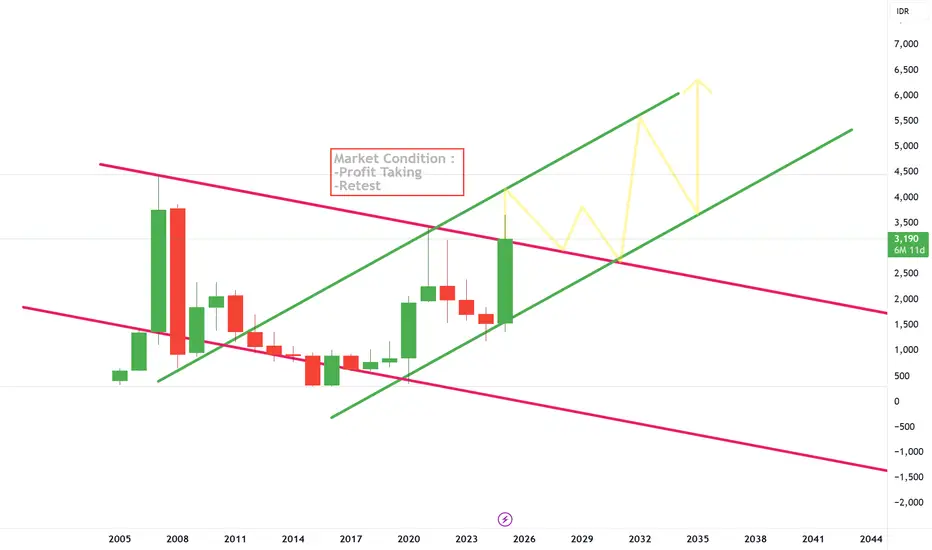
ANTM"There may be an initial phase of profit-taking, leading to a retest. If the breakout turns out to be false, the price is likely to revert to a bearish trend along the red line. However, if the breakout is confirmed, an uptrend may develop. The previous ATH must be broken first to validate the move."
Chart Patterns
NXPCUSDT → The coin is being killed. Searching for a new bottomNXPCUSDT is testing the bottom at 1.1675 while Bitcoin and the top 10 cryptocurrencies are in a global/local bullish trend...
NXPCUSDT is showing its weakness in the cryptocurrency market. There is no potential or driver for the coin, and it continues to be killed... Against the backdrop of a growing market and Bitcoin forming a bullish trend, the NXPC coin is testing the bottom...
After a strong and long-term decline, the NXPC coin is forming a flat (consolidation) in the range of 1.5637 - 1.1675. A pre-breakdown base is forming relative to support, which could lead to the price breaking out of consolidation downwards...
Resistance levels: 1.2532
Support levels: 1.1675
Focus on support for the range and bottom in the current coin at 1.1675. This is a risk zone and a panic zone. If the price breaks out of this consolidation, there are no obstacles below and the fall could be aggressive. A breakout of the consolidation support could trigger a continuation of the rally or a decline with the aim of forming a new bottom...
Best regards, R. Linda!

Holiday yesterday so no play! can we get it today?As we get ready to close out the week we are looking for the reversal to play out. We have been in a casual consolidation all week. Just looking for price to step outside of value one more time so that we can get a entry for it to continue pushing bullish.

Short term bearish on BTC until 92K USDPurely looking at current dealing range and the fact that price is holding in 'bearish flag' pattern, which may a false signal, when at ALH.

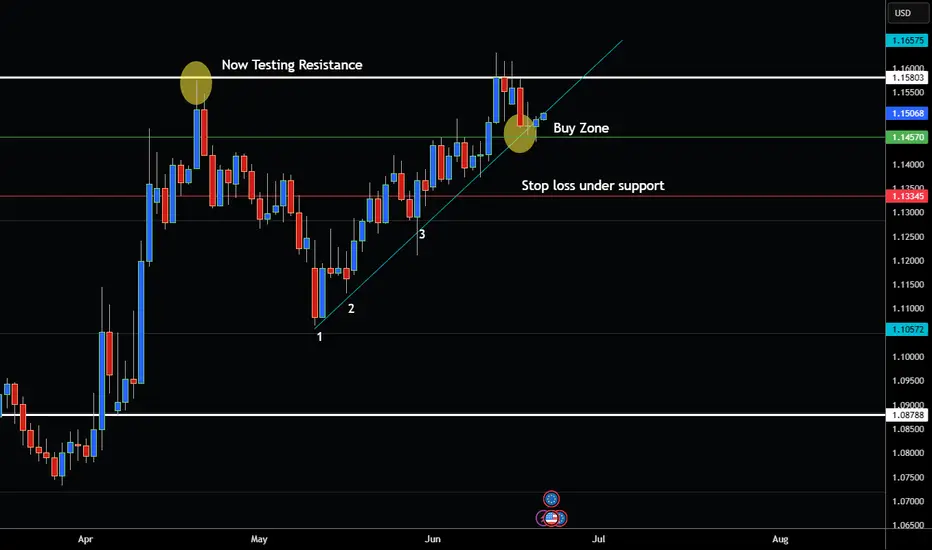
EUR/USD NOW IN BUY ZONE!Looking very bullish Plus bounced off support recently at 1.457.
However watch out for resistance at 1.158 it could pause, reverse or break through.
Of course daily close above resistance would be a very strong bullish trend continuation sign.
Always use Risk Management!
(Just in case your wrong in your analysis most experts recommend never to risk more than 2% of your account equity on any given trade.)
Hope This Helps Your Trading 😃
Clifford
APX Rebound in Play?📈 “APX Rebound in Play? Eyeing the AUD 1.55 Resistance”
Appen (APX) has shown a significant uptick today, closing at AUD 1.040 (+5.58%) with a sharp volume spike (8.96M shares) that could suggest accumulation. After a long downtrend, price appears to be consolidating above key support near AUD 1.00, forming a potential base for reversal.
🔍 Chart Highlights:
Support Zone: AUD 1.000 – strong historical level holding.
Resistance Targets: → AUD 1.555 → AUD 1.655 → AUD 1.785
R/R Setup: Defined green zone shows potential upside if momentum continues; red zone clearly marks invalidation below support.
🧠 Thesis: If APX maintains momentum and holds above AUD 1.00, we may be witnessing a structural shift with upside potential toward AUD 1.78 in stages. Breakout traders might watch for confirmation via volume and price action at each resistance.
💬 “Could we be looking at an early-stage reversal or just a dead-cat bounce? Watching the 1.00 level closely.”
#ASX #APX #APPEN #MJTRADING #TRADING #SHARE #STOCKMARKET #BUY #CHART #MONEYMANAGEMENT

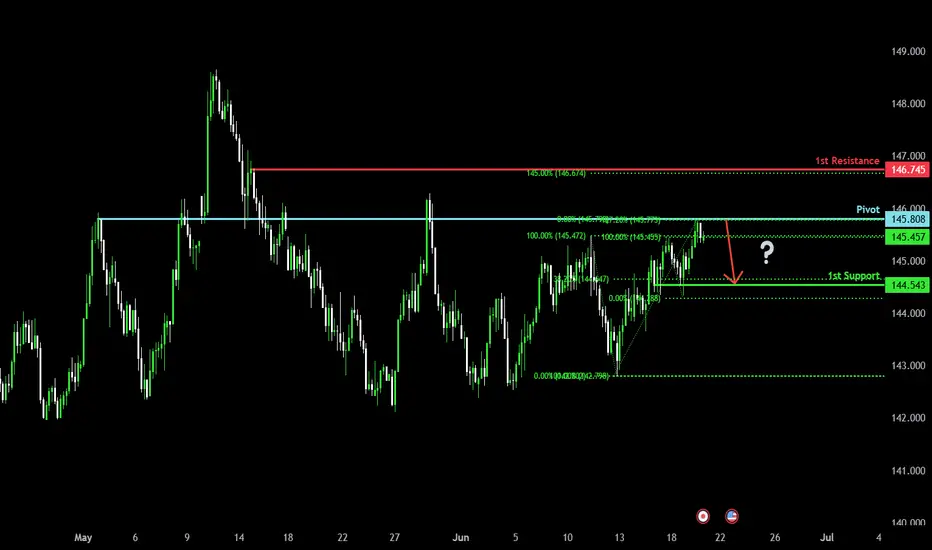
Bearish reversal?USD/JPY has reacted off the pivot and could drop to the 1st support which is a pullback support.
Pivot: 145.80
1st Support: 144.54
1st Resistance: 146.74
Risk Warning:
Trading Forex and CFDs carries a high level of risk to your capital and you should only trade with money you can afford to lose. Trading Forex and CFDs may not be suitable for all investors, so please ensure that you fully understand the risks involved and seek independent advice if necessary.
Disclaimer:
The above opinions given constitute general market commentary, and do not constitute the opinion or advice of IC Markets or any form of personal or investment advice.
Any opinions, news, research, analyses, prices, other information, or links to third-party sites contained on this website are provided on an "as-is" basis, are intended only to be informative, is not an advice nor a recommendation, nor research, or a record of our trading prices, or an offer of, or solicitation for a transaction in any financial instrument and thus should not be treated as such. The information provided does not involve any specific investment objectives, financial situation and needs of any specific person who may receive it. Please be aware, that past performance is not a reliable indicator of future performance and/or results. Past Performance or Forward-looking scenarios based upon the reasonable beliefs of the third-party provider are not a guarantee of future performance. Actual results may differ materially from those anticipated in forward-looking or past performance statements. IC Markets makes no representation or warranty and assumes no liability as to the accuracy or completeness of the information provided, nor any loss arising from any investment based on a recommendation, forecast or any information supplied by any third-party.
Potential bullish rise?The Cable (GBP/USD) has bounced off the pivot which is an overlap support and could rise to the 1st resistance.
Pivot: 1.3403
1st Support: 1.3319
1st Resistance: 1.3517
Risk Warning:
Trading Forex and CFDs carries a high level of risk to your capital and you should only trade with money you can afford to lose. Trading Forex and CFDs may not be suitable for all investors, so please ensure that you fully understand the risks involved and seek independent advice if necessary.
Disclaimer:
The above opinions given constitute general market commentary, and do not constitute the opinion or advice of IC Markets or any form of personal or investment advice.
Any opinions, news, research, analyses, prices, other information, or links to third-party sites contained on this website are provided on an "as-is" basis, are intended only to be informative, is not an advice nor a recommendation, nor research, or a record of our trading prices, or an offer of, or solicitation for a transaction in any financial instrument and thus should not be treated as such. The information provided does not involve any specific investment objectives, financial situation and needs of any specific person who may receive it. Please be aware, that past performance is not a reliable indicator of future performance and/or results. Past Performance or Forward-looking scenarios based upon the reasonable beliefs of the third-party provider are not a guarantee of future performance. Actual results may differ materially from those anticipated in forward-looking or past performance statements. IC Markets makes no representation or warranty and assumes no liability as to the accuracy or completeness of the information provided, nor any loss arising from any investment based on a recommendation, forecast or any information supplied by any third-party.

Bullish bounce off pullback support?The Fiber (EUR/USD) has bounced off the pivot and could rise to the 1st resistance.
Pivot: 1.1444
1st Support: 1.1369
1st Resistance: 1.1587
Risk Warning:
Trading Forex and CFDs carries a high level of risk to your capital and you should only trade with money you can afford to lose. Trading Forex and CFDs may not be suitable for all investors, so please ensure that you fully understand the risks involved and seek independent advice if necessary.
Disclaimer:
The above opinions given constitute general market commentary, and do not constitute the opinion or advice of IC Markets or any form of personal or investment advice.
Any opinions, news, research, analyses, prices, other information, or links to third-party sites contained on this website are provided on an "as-is" basis, are intended only to be informative, is not an advice nor a recommendation, nor research, or a record of our trading prices, or an offer of, or solicitation for a transaction in any financial instrument and thus should not be treated as such. The information provided does not involve any specific investment objectives, financial situation and needs of any specific person who may receive it. Please be aware, that past performance is not a reliable indicator of future performance and/or results. Past Performance or Forward-looking scenarios based upon the reasonable beliefs of the third-party provider are not a guarantee of future performance. Actual results may differ materially from those anticipated in forward-looking or past performance statements. IC Markets makes no representation or warranty and assumes no liability as to the accuracy or completeness of the information provided, nor any loss arising from any investment based on a recommendation, forecast or any information supplied by any third-party.

Nightly $SPY / $SPX Scenarios for June 20, 2025🔮 Nightly AMEX:SPY / SP:SPX Scenarios for June 20, 2025 🔮
🌍 Market-Moving News 🌍
🏦 Fed Holds Rates, Warns on Tariffs
Fed kept interest rates steady on June 19, cautioning that tariffs could stoke inflation and slow growth. Inflation projections were raised from 2.7% to 3.0%, while growth estimates were revised lower to 1.4%
🌍 Middle East Risk Drags Markets
Global stocks fell and safe-haven assets surged after U.S. futures weakened amid heightened tensions in the Israel–Iran conflict. Yields were mixed: gold weakened and bonds gained, while oil held steady near seven-week highs
📈 Treasury Yields Edge Higher
Despite safe-haven demand, U.S. 10‑year yields ticked up as markets absorbed the Fed’s updated rate outlook. The yield curve remains elevated ahead of next week’s $38 bn auction of long-dated notes
📊 Key Data Releases 📊
📅 Friday, June 20:
(No major U.S. economic reports)
Markets will be driven by Fed commentary follow-ups and geopolitical headlines over the weekend.
⚠️ Disclaimer:
This information is for educational and informational purposes only and should not be construed as financial advice. Always consult a licensed financial advisor before making investment decisions.
📌 #trading #stockmarket #economy #geopolitics #fixedincome #inflation #charting #technicalanalysis


PDYN on WatchLooking for breakout over previous high at $9.16
Why:
Price reacting to .50 fib levels as marked in the orange circles
Rounded bottom on daily/weekly
More above average volume on green days than red days in the past week
MACD Bullish
Price above all EMAs

Bullish bounce?US Dollar Index (DXY) is falling towards the pivot and could bounce to the 1st resistance.
Pivot: 98.48
1st Support: 97.62
1st Resistance: 99.47
Risk Warning:
Trading Forex and CFDs carries a high level of risk to your capital and you should only trade with money you can afford to lose. Trading Forex and CFDs may not be suitable for all investors, so please ensure that you fully understand the risks involved and seek independent advice if necessary.
Disclaimer:
The above opinions given constitute general market commentary, and do not constitute the opinion or advice of IC Markets or any form of personal or investment advice.
Any opinions, news, research, analyses, prices, other information, or links to third-party sites contained on this website are provided on an "as-is" basis, are intended only to be informative, is not an advice nor a recommendation, nor research, or a record of our trading prices, or an offer of, or solicitation for a transaction in any financial instrument and thus should not be treated as such. The information provided does not involve any specific investment objectives, financial situation and needs of any specific person who may receive it. Please be aware, that past performance is not a reliable indicator of future performance and/or results. Past Performance or Forward-looking scenarios based upon the reasonable beliefs of the third-party provider are not a guarantee of future performance. Actual results may differ materially from those anticipated in forward-looking or past performance statements. IC Markets makes no representation or warranty and assumes no liability as to the accuracy or completeness of the information provided, nor any loss arising from any investment based on a recommendation, forecast or any information supplied by any third-party.

OSCR on WatchLooking for a pullback.
Why:
Riding the hourly 9EMA
High volume green days
MACD bullish cross
Green lines are 1.618 extensions on the daily and weekly charts.
White lines are previous highs.
Looking to see how OSCR reacts to these levels.

Market Structure AnalysisMarket Structure Analysis
HH (Higher High) and HL (Higher Low) labels indicate the prior uptrend structure.
The recent price action shows consolidation and potential trend reversal or correction.
🟦
Highlighted Zones
Supply Zones (resistance): Marked in light teal rectangles near the top of price action (e.g., around 3,400).
Demand Zones (support): Marked below the current price (e.g., around 3,360 and lower near 3,320).
🔄
Ch0CH (Change of Character)
A “Ch0CH” label is marked — this typically signals a potential shift in market structure (e.g., from bullish to bearish).
This is further supported by the price breaking below a previous higher low.
📉
Trade Setup
Red Zone: Indicates the stop-loss region.
Green Zone: Indicates the take-profit target.
A short (sell) position is implied here, expecting price to drop from the current level to the lower demand zone.
🔁
Projected Price Path
A dotted white line projects a potential bearish move, with a minor retracement before continuation down to ~3,328.


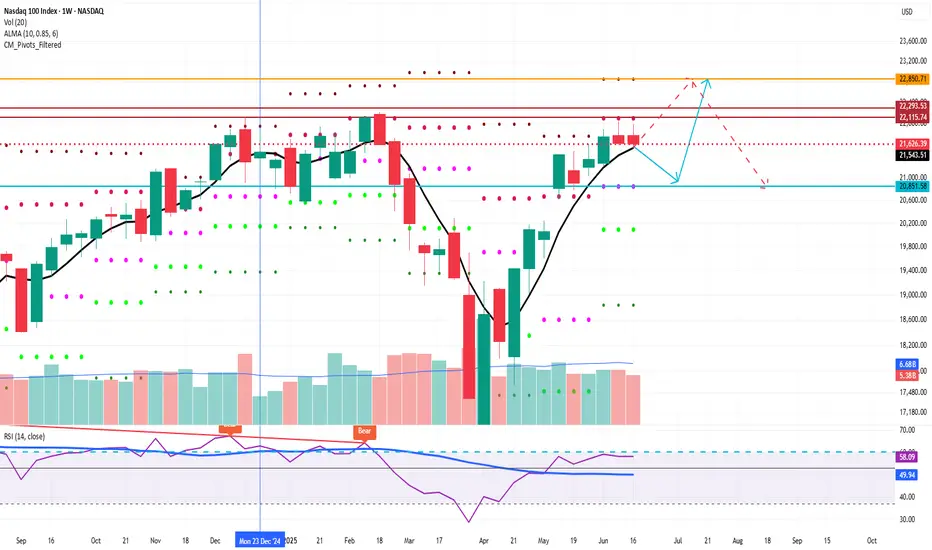
NASDAQ might retrace till 26850 before making an upmove NASDAQ may retrace till 26850 before making an upmove that can be round 22850 in next week.
This is not a recommendation, but a study.
Bitcoin and the descending channel it consistently followsAccording to the UTC+3 time zone, there is a Bitcoin channel between the 23:00 and 03:00 candles on May 21, which uses the width of the channel (the yellow channel). If we copy the same channel and place it at the upper wick of the 15:00 candle on May 27, we get the green channel. Similarly, by copying the yellow channel and aligning it with the lower wick of the 03:00 candle on May 22, which is one of the first two white candles at the start of the channel, we get the orange channel. The blue channel, on the other hand, is my prediction. In addition, not only the 0 and 1 points (solid line) of the channels but also the 0.5 (short line), 0.25, and 0.75 (dotted lines) levels act as support and resistance.

Bitcoin (BTC/USD) Technical Forecast🧭 Market Snapshot:
Bitcoin is showing signs of short-term weakness with price hovering around $102,800. The daily candle is forming an inside bar, suggesting indecision — typically a setup for a larger move ahead.
🔮 Forecast:
📅 1-Day Outlook:
BTC is expected to remain in a narrow consolidation range between $102,200 and $104,000. A breakout from this inside candle could push price toward $105K, but risk remains skewed slightly lower if support fails.
📅 1-Week Outlook:
With daily and 4H RSI trending under 45 and price below key EMAs, downside risk builds. If $100K fails, BTC may test the $98.5K zone, potentially down to EMA 144 near $96.5K.
📅 1-Month Outlook:
If BTC can base between $96.5K–$106K and reclaim the $105K resistance cluster, momentum may shift bullish. Until then, price action is likely to remain choppy and rangebound.
⚠️ Key Technicals:
Support Zones: $102,600 (EMA 55), $99,950 (EMA 89), $96,648 (EMA 144)
Resistance Zones: $105,000–106,000 (EMA 21/34 cluster)
Momentum: RSI < 50 across all timeframes → no bullish momentum yet
Volatility: Moderate, with ATR (14) = 2795
📌 Conclusion:
The bulls need a clear reclaim above $105K to regain control. Until then, expect range trading and possible tests toward $98K–$96K. Stay nimble, watch RSI and EMA reactions closely.

Chart Pattern Analysis Of Bitcoin
K5 close below K2,
It verified the resistance or the bear gap at K2.
It seems that the following candles will fall to test 0.382-0.5fib area.
I will try to buy it there.
I don’t think the three years bull market will be terminated here,
I am expecting another bull run to test or break up the resistance again.
On the other hand,
If K6 or the following candles finally close below 0.5fib line or the uptrend line,
A potential double top bear market will finally come up.
Long-96888/Stop-95888/Target-115K

bitcoin btc shortshort entry :107.300 , STOP LOSS: 108.400 , PROFIT TARGET 101.000
RR 1:5 BINANCE:BTCUSDT.P

SOLANA SOL to 3800$ nextSolana is in mid range, 61.8% retracement bottom, similar to TSLA at 19 Aug 19,
since Sol is the most used cypto (90% of blockchain usage) i expect a massive bullrun.
Sol will outperform bitcoin

TRBUSDT - at CUT n REVERSE Area? What's next??#TRBUSDT - market just reached at his ultimate supporting region and below that we can expect a further straight drop.
So we will cut n reverse below our mentioned region that is around 35 (region neck line)
Good luck
trade wisely
