The Bears and the Bulls So Bitcoin is consolidating from 101K to 109K, from an uptrend which is probably but not certainly a continuation pattern. BTC is still above the 10 EMA means bullish short-term, confluent with market structure, and above 200 EMA long term bullish. BTC might cycle back up in the flag pattern or break below the 10 EMA, which could possibly (not certainly) send it probably to the 50 EMA in purple and the trendline and a Demand zone. The bulls would love for BTC to close above the flag pattern and resistance and make HH and HL from there; and the bears would love to see rejection and a return back to the Demand levels.
Chart Patterns

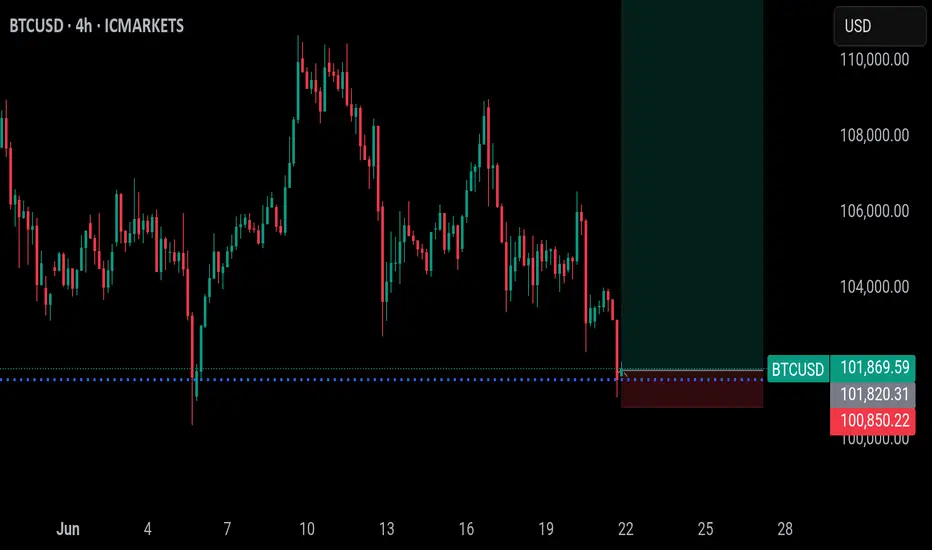
BTC to new ATH, wanna bet?The only objection I have on this trade is 100400 level. If price comes there, I will buy more but for now, I think it will push up from here.
Entry is below 101800 if stoploss is still holding...
TP1 @ 112k
TP2 @ 120k
Enjoy
Follow me as my trades are mainly market orders, so you will see the trades on time and enter on time.
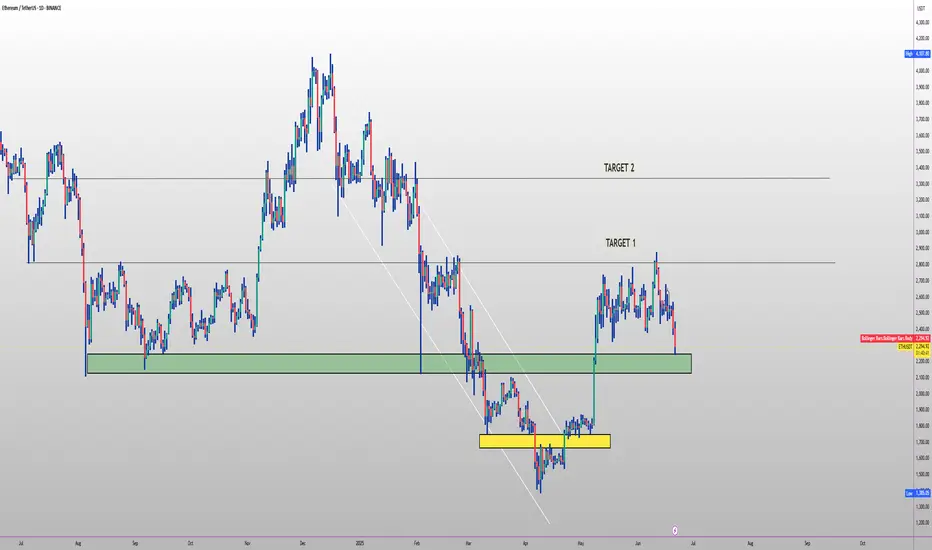
ETH PLAN FOR 2025🔥 CRYPTOCAP:ETH long setup (1D) 🚀
✅ Entry Zone: $2 280 – $2200 (multi-month demand)
🎯 Targets
• TP-1: $3 000 (macro range mid)
• TP-2: $3 400 (2024 breakdown line)
⛔ Stop-Loss
Daily close < $2050
📊 Thesis
• SEC-approved spot-ETH ETFs now trade on NYSE/Nasdaq 🏛️
• >35 M ETH staked (≈29 % supply) tightening float
• Dencun’s EIP-4844 slashed L2 fees ~90 % ⚡
• EigenLayer restaking TVL > $20 B 📈
• Pectra upgrade brings account abstraction & wallet UX overhaul
• ETH supply net-deflationary since EIP-1559 🔥
• Danksharding next → massive roll-up throughput
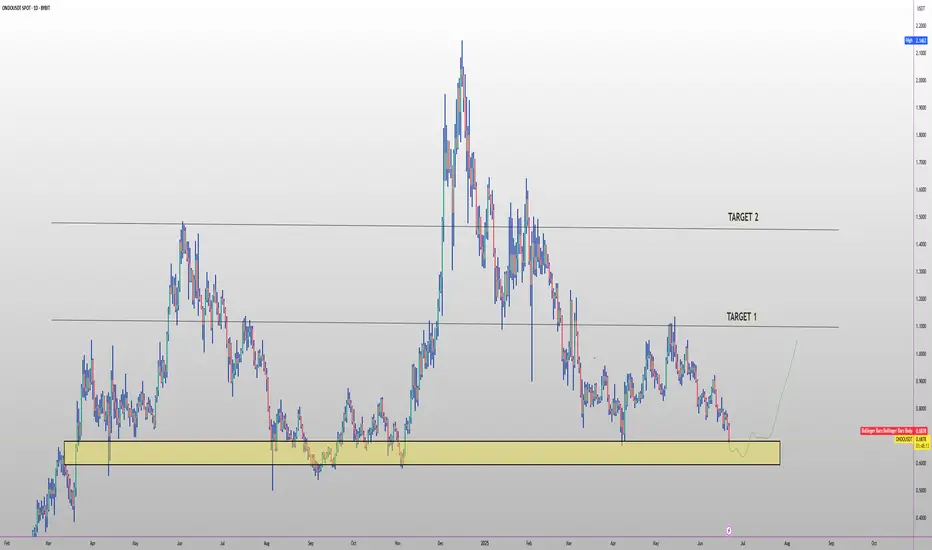
ONDO LONG FOR 2H 2025🔥 LSE:ONDO long setup (1D) 🚀
✅ Entry Zone: $0.62 – $0.685 (year-to-date demand)
🎯 Targets
• TP-1: $1.30 (post-IPO mid-range)
• TP-2: $1.70 (liquidity vacuum test)
⛔ Stop-Loss
Daily close < $0.54
📊 Thesis
• $95 M OUSG now settles via BlackRock’s BUIDL 🏦
• USDY hit $350 M TVL & 7 chains in 12 mo 📈
• Ondo Chain (omnichain RWA hub) launching 2025 🔄
• Coinbase roadmap + expanding Arbitrum, Solana support
• Tokenised Treasuries narrative heating up (Goldman, GSIBs) 🔥
GBPNZD BUY OR SELL IDEAHope y'all caught the 300 pips buy move last week. Mehn, that was fast. Well, price is a major resistance and is currently retracing. The question is whether price action is retracing for a further move upwards or a fall back to the support level at 2.2233?
The chart pattern is showing a falling wedge. A break of resistance 2.25 and retest would be confirmation for an entry for buys, or a break of the 61.8 & 50 fib zone/formation of lower highs and lower lows would be confirmation for a sell entry. The market always gives a signal, so we watch once the market opens

BTC.D: 1M chart still looking bullish for nowAs above.
BTC.D still looking to continue to slowly inch higher in the near future. No ALT season yet, unfortunately for those anticipating this event.
Stronger case for BTC.D to get to 70% range once 65% range is entered. I am not sure this is going to be a rapid BTC.D event given the historic trend and current economic climate. Might see ALTs bleed again a little more than BTC to achieve this 70% level rather than BTC going parabolic. Would have cash on hand for potential start of ALT season to get those basement discount prices on ALTs if that should happen as I anticipate some kind of ALT season down the road..the question is when and how big...
Will follow.
Good luck traders!

You won't see ETHUSD cheaper than this, I'm buying at 3290Any price below 3300 is okay if the stop loss is still in place. The probability of this trade playing out is very high. Almost everybody is also bearish now. So I'm very comfortable in this trade
TP1 @ 2700
TP2 @ 3000
TP3 @ 5000

WTI USOIL WEEKLY CHARTKey Offshore Oil and Gas Installations at Risk of Iranian Attack
Based on recent escalations and Iran's retaliatory capabilities, the following offshore installations are most vulnerable:
Strait of Hormuz Infrastructure
Why at risk: A critical global chokepoint handling 21 million barrels of oil daily. Iran has repeatedly threatened closure if provoked.
Potential targets: Tanker routes, underwater pipelines, and monitoring stations.
Qatar’s North Field Gas Facilities
Why at risk: Directly adjacent to Iran’s South Pars field (recently attacked by Israel). Shared reservoirs mean disruptions could cascade.
Vulnerability: Iran could target Qatari platforms to amplify global gas shortages.
Saudi/UAE Offshore Fields
Key sites:
Saudi Arabia’s Safaniya (world’s largest offshore oil field).
UAE’s Upper Zakum oil field.
Why at risk: Iran views Gulf states as Israeli allies; striking them would disrupt U.S.-aligned economies.
Israeli Mediterranean Gas Rigs
Leviathan and Tamar fields:
Provide 90% of Israel’s electricity.
Already targeted by Iranian proxies (e.g., Hezbollah rockets in 2023).
Bahrain/Kuwait Offshore Facilities
Strategic value: Proximity to Iran enables rapid drone/missile strikes. Past attacks (e.g., 2019 Aramco) demonstrate capability.
Why These Targets?
Retaliatory logic: Iran’s energy infrastructure (e.g., South Pars) was damaged by Israeli strikes. Targeting adversaries’ assets aligns with its "escalate to deter" strategy.
Global leverage: Disrupting Hormuz or major fields could spike oil prices 30–50%, pressuring Western governments.
Technical feasibility: Iran’s naval drones, cruise missiles, and mines can penetrate offshore defenses.
Immediate Threats
Target Risk Level Potential Impact
Strait of Hormuz Critical Global oil prices surge; 20% of LNG shipments halted
Qatar’s North Field High 10% of global LNG supply disrupted; Europe/Asia energy crisis
Israeli Gas Rigs High Israel’s energy security crippled; regional conflict escalation
Conclusion
Iran’s most likely retaliation targets are offshore installations in the Strait of Hormuz, Qatar, and Israeli Mediterranean fields, leveraging proximity and asymmetric tactics. Such attacks would aim to inflict maximum economic damage while avoiding direct confrontation with the U.S. or NATO. Global energy markets face severe disruption if hostilities escalate further.
A successful breakout above this descending trendline and resistance zone (near $74–$75) would confirm a bullish reversal, potentially opening the way for further upside toward $80 and $100 as next target.
US crude inventories have declined recently, reducing oversupply fears and supporting prices.
Global oil demand is forecast to grow by 720,000 barrels per day in 2025, while supply increases are more modest.
OPEC+ decisions to maintain production cuts or limit increases have also contributed to price support.
Summary
Oil prices are testing and potentially breaking out of a long-term descending trendline formed since mid-2022.
breakout will be long buy hope that we see 80$ per barrel.
#usoil #oil

PRM on WatchLooking for a breakout over $13.50, previous high of day.
Why:
Consolidating with rounded bottom
9EMA acting as support
Uptrend
Target is 1.618 fib level (green line)

TME on WatchLooking for a breakout over white resistance line or an entry once near the close of the gap.
Target is 1.618 fib level (green line) which also happens to be an even number...$20
Why:
Consolidating
MACD looking ready to turn bullish
Price could also drop to close the gap (yellow line) which also could line up with the 20EMA if it consolidates for a couple more days.

symmetrical triangle in progressBitcoin has been consolidating at this level for several weeks, easing some of the pressure in order to push above 120K. As of today, we have a clear formation—a large symmetrical triangle—which confirms the continuation of the upward trend and rules out any possibility of returning to lower levels.

Trend line vs Trend lineRivian (RIVN) is currently at a binary decision point, sitting just above the 50-week EMA and a key uptrend line. Price is testing a strong confluence zone near $13.38–$13.57, with rejection seen from the $15.49 resistance. A break below this area could lead to a drop toward the $12.43–$11.54 demand zone. You can refine your entry using the high-wave candle by boxing its high and low on the 1-hour chart. A break above the box with volume would signal early bullish momentum; a break below suggests further downside. Confirm the move with hourly RSI above 50 and Stochastic RSI curling up. This setup offers a high-probability directional move as the next few candles decide the trend.(Break down by AI Chat gpt except For Chart)


Stock Market Forecast | TSLA NVDA AAPL AMZN META MSFTStock Market Forecast | !nq1! !es1! SPY QQQ
Mag 7 Forecast | NASDAQ:TSLA NASDAQ:NVDA AAPL AMZN META MSFT GOOG

ETH/BTC Just broke major support.This could be the last shake out before the alt season starts. One final capitulation and alt coins might find their lows against BTC for the long run. I am looking for a double bottom here on ETH/BTC this could be the last nail in the coffin of the BTC dominance.

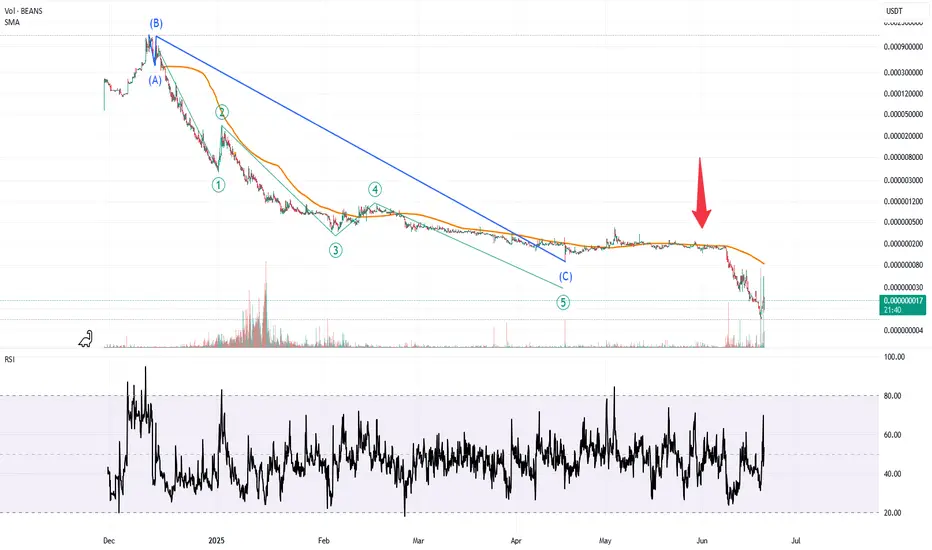
WARNING: Potential SCAM Involving GATE.IO and Affiliated BrokersI have tracked this coin, and many similar ones, closely since its launch, applying reliable wave analysis techniques. After a textbook completion of Wave C — accompanied by millions (in $) in daily trading volume — the price was poised for a corrective move upward.
Instead, GATE.IO suddenly announced a delisting, and the chart was abruptly pulled, preventing any further analysis or exits. This is a clear red flag.
This pattern appears to be a deliberate tactic: list the coin to appear legitimate, attract investor interest and capital, and then delist once enough funds are locked in — triggering a collapse. Other brokers, possibly working in coordination, follow by delisting the coin as well, completing the trap.
I've observed similar suspicious activity with other coins such as PRMX, NOOB, BPT, CRE, PICASU, ALITA, and more.
This particular coin is still listed on MEXC , but I remain skeptical about whether MEXC is also part of this coordinated scheme. Time will tell.
Be extremely cautious trading such coins on GATE.IO and/or its affiliated platforms (you can easily find them by looking at similar coins). What looks like a promising listing could be part of a well-executed scam.
GBPJPY BUY IDEA- This is a continuation of the buy trade last week. The price has broken above the major resistance on the H4 chart and is now slightly above the previous high on the daily chart.
- We're looking at a retest of the broken resistance for entries for further buys.
For those who missed my previous analysis on it, please revert to my previous idea on GBPJPY buys.

USDMXN | 21.06.2025BUY 19.1500 | STOP 18.7500 | TAKE 19.7000 | The Bank of Mexico is expected to continue its rate easing cycle next week, despite recent reports on Mexican inflation suggesting risks are skewed to the upside. Inflation in May exceeded the bank's 3% target, raising concerns that the central bank will continue to cut rates. From a technical perspective, the price is moving upwards within a long-term channel in the medium term and is pushing away from the strong support level of 18.8200.

META an opportunity to add on this dip
Traded from that flag consolidation and was able to make some money on it.
now NASDAQ:META looks like a double top on the daily
but very bullish chart and can be added back between 660-665
that's it

BTC - SHORTBitcoin will do this in the next days, in a long term vision and i see it touchin the zones below 90,000. The start of a new downtrend!!! DYOR

SEIUSDT.P – Long Setup in Fib Golden Zone with Volatility CompreSEIUSDT.P is consolidating after a strong bullish move. Price is now retracing into the 61.8–78.6% Fibonacci zone, which historically acts as a key reversal area. Multiple rejections and compression in this range suggest a potential bounce.
MACD shows signs of bearish momentum fading. If confirmed, this could be a solid risk-managed long with upside toward previous highs.

DLO ready to goNASDAQ:DLO looks like it is ready to head back higher.
Broke out of the falling wedge and has a very defined risk (exit when it closes below 9.75)
Has had good upgrades from analysts recently as well

EUR/CAD BuyEntry – Buy-limit 1.5560 (front-run zone); back-up bid 1.5520 if you ladder.
Stop-loss – Hard stop 1.5410 (below 1.5500 break-fail line).
Targets
TP1 1.5750 – lock ~1.5 R; trail stop to break-even.
TP2 1.5900 – cash majority.
Runner 1.6000 – only if momentum is strong.
Expiry: cancel if not filled after 5 trading days.
