EURUSD Will Keep Growing!
HI,Traders !
#EURUSD is trading in an
Uptrend along the rising
Support and the pair will
Soon retest the support
From where we will be
Expecting a bullish rebound
And a bullish continuation !
Comment and subscribe to help us grow !
Chart Patterns

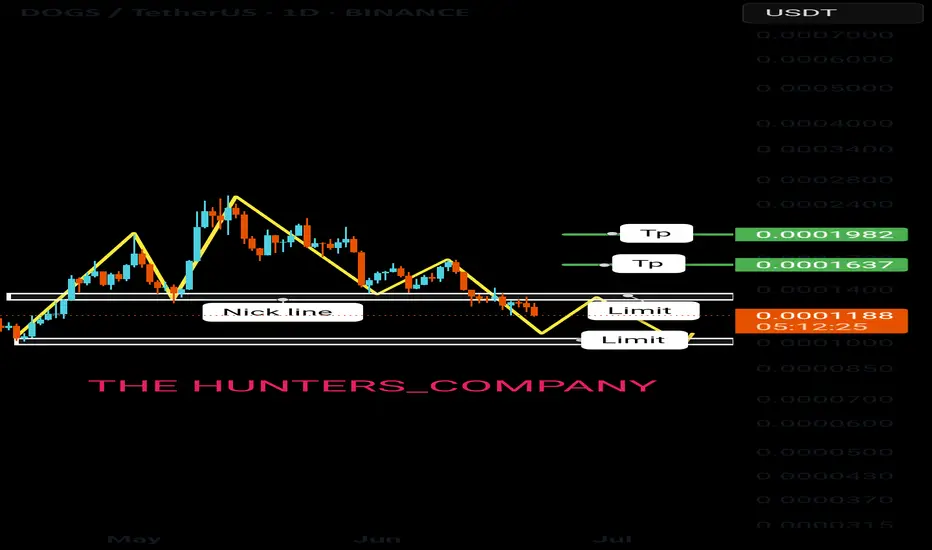
Dogs:Where is the time and point of purchase?hello friends👋
We come to another analysis, this time a popular coin meme that you requested a lot🔥
Well, let me start with the pattern that we specified for you, which is a sign of a price drop, and you can see this happening...
Now, in the important support areas that we have specified for you, you can buy step by step, of course, with risk and capital management.💰
🔥Follow us for more signals🔥
*Trade safely with us*
$SPX Weekly Technical Breakdown – Week of June 22, 2025SP:SPX Weekly Technical Breakdown – Week of June 22, 2025
After consolidating in a tight range earlier this month, SP:SPX printed a subtle but significant outside day on Friday — breaking Thursday’s high by just 0.01 and forming a broadening formation. Like NASDAQ:QQQ , this pattern reflects indecision and a potential shift in structure as bulls and bears battle for control. The short-term range is wide, with support at 5963.21 and resistance near 6026.68. Holding above 5963 can keep buyers in and opens the door for a retest of the psychological 6000 level, followed by 6059.40 (all-time high). However, a close back below 5963.21 could open the path for a quick flush toward 5900. Key intraday levels to watch include 5929, 5940.03, 5954.06, 5974.86, 5989.43, 6002.32, 6012.94, 6026.68, 6044.56, and 6059.21.
Technical Summary
• Structure: Outside day Friday formed a broadening formation
• Event Note: Slight break of Thursday’s high by 0.01 confirms outside bar structure
• Daytrade Pivots: 5929, 5940.03, 5954.06, 5974.86, 5989.43, 6002.32, 6012.94, 6026.68
• Macro View: SPX improves technically above 6000; breakout confirmed over 6026.68
• Downside Risk: Failure to close above 5963.21 could trigger fast move toward 5900
• Momentum Bias: Neutral to bearish until 6000+ is reclaimed and defended
Key Levels to Watch
🟢 Upside Resistance: 5974.86, 5989.43, 6002.32, 6012.94, 6026.68, 6044.56, 6059.21, 6059.40 (ATH)
🔴 Downside Support: 5963.21 (must hold), 5954.06, 5940.03, 5929
Trade Plan
• Hold above 5963.21 keeps upside scenario intact — look for reclaim of 5974.86 and 6000+
• Close below 5963.21 flips structure and may accelerate toward 5929, possibly 5900
• Scalps remain viable near 5954–6002 using intraday reactions at key levels
Decision Map
🟩 IF SPX HOLDS ABOVE 5963.21 → reclaim 5974.86 → target 5989.43 → 6002.32 → breakout toward 6026.68 → 6059.40 (ATH)
🟥 IF SPX BREAKS BELOW 5963.21 → watch 5954.06 → 5940.03 → 5929 → 5900 possible flush
Primary Trade Zone: 5954–6002
Alert Levels
Set alerts above: 5974.86, 6002.32, 6026.68
Set alerts below: 5963.21, 5940.03, 5929
This Week’s Key Catalysts for SP:SPX
This week’s economic calendar is packed with market-moving data that will likely influence SP:SPX and broader risk appetite.
• Tuesday, June 24: Fed Chair Powell testifies to the House Financial Services Committee. His tone and guidance on future policy will be a primary driver for market direction. The same day also includes Consumer Confidence (June) and Fed commentary from Cleveland Fed President Beth Hammack — both potentially impactful.
• Thursday, June 26: Heavy data day with initial jobless claims, durable goods orders (May), core goods data, and the second revision of Q1 GDP. These reports will offer insight into both the labor market and the broader health of the U.S. economy.
• Friday, June 27: The most important inflation data of the week arrives with the PCE index and Core PCE (May). These are the Fed’s preferred inflation gauges and could shape expectations for a rate cut later this summer.
Overall, market participants will be closely watching Powell’s tone, inflation data, and any sign of slowing growth. Combined with Friday’s outside day and broadening structure, SP:SPX is positioned for a move — the catalyst will determine the direction.

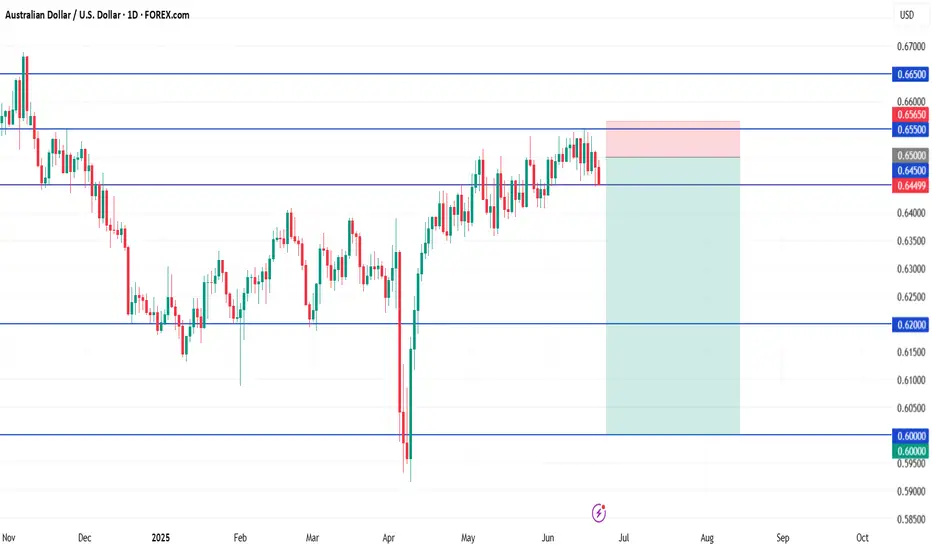
AUD/USD ShortStandard / Aggressive Entry
Sell Limit: 0.6500
Stop Loss: 0.6565
TP1: 0.6200
TP2: 0.6000
Why: Likely to trigger sooner, even on light retracement or spread spike.
🛡️ Conservative Entry
Sell Limit: 0.6520
Stop Loss: 0.6580
TP1: 0.6200
TP2: 0.6000
Why: Waits for a deeper, cleaner pullback toward top of resistance zone. Safer but may not trigger.
Xrp:The fate of Ripple in the long termhello friends👋
After a good price growth that we had, you can see that the buyers gradually exited and a triangle pattern was formed.
Now, according to the specified support, it should be seen whether buyers support Ripple or not...
You have to wait and nothing can be said until the failure of the pattern, but we suggest that you buy step by step with capital and risk management in the identified areas that are very good supports and move to the set goals.
And in the end, we must say that don't forget that we are in a strong upward trend, that the probability of the continuation of the Bister trend is the possibility of a fall...
🔥Follow us for more signals🔥
*Trade safely with us*

10 YEAR JAPANESE GOVERNMENT BOND YIELD JGB10Y1. Japan 10-Year Government Bond Yield and Price
The 10-year Japanese Government Bond (JGB) yield is around 1.40% to 1.52% in mid-2025, recently easing slightly to about 1.40% on June 20, 2025.
This yield level is significantly higher than the near-zero levels seen in previous years but remains low by global standards.
The bond price for the 10-year JGB hovers near 99.6 to 100, reflecting the inverse relationship with yields (as yields rise, bond prices fall slightly).
Japan’s bond yields have been rising steadily since 2022, reflecting market concerns about inflation, fiscal sustainability, and monetary policy shifts.
2. Bank of Japan (BoJ) Interest Rate Policy
The official BoJ short-term policy rate is currently at 0.50%, up from negative territory (-0.10%) a year ago.
The BoJ has maintained a very accommodative monetary policy stance but has started to allow some upward flexibility in long-term yields, including the 10-year JGB yield, moving away from strict yield curve control.
The BoJ is also considering buying back some super-long government bonds to stabilize the market amid rising yields.
3. Relationship Between Bond Yields, Prices, and JPY Strength
Bond yields and prices have an inverse relationship: as yields rise (reflecting higher interest rates or inflation expectations), bond prices fall.
JPY Strength is influenced by several factors related to bond yields and interest rates:
Rising Japanese bond yields tend to support a stronger yen, as higher yields attract foreign capital seeking better returns.
However, Japan’s yields remain much lower than those of other major economies (e.g., US 10-year yield ~4.4%), which limits yen appreciation.
The BoJ’s accommodative policy and yield curve control have historically kept yields low, suppressing JPY strength relative to currencies like USD.
Recent yield increases and policy shifts have led to some yen appreciation, but trade and geopolitical factors also play significant roles.
The trade deficit narrowing and ongoing trade talks with the US may also impact the yen’s value.
Conclusion
Japan’s 10-year government bond yield has risen modestly to around 1.4%, reflecting gradual monetary policy normalization by the BoJ, which still maintains a very low short-term interest rate of 0.5%. This yield increase supports some yen strength by attracting capital inflows, although the yen remains sensitive to global yield differentials and trade dynamics. Bond prices have adjusted accordingly, declining slightly as yields rose. The BoJ’s interventions, including potential bond buybacks, aim to manage market volatility amid these shifts.
JGB 10-Year vs. AU 10-Year Bond Yield Differential and Related Concepts
1. Current Yield Differential (June 2025)
The Australia 10-Year Government Bond yield is approximately 4.33% to 4.32% (recently around 4.31%).
The Japan 10-Year Government Bond (JGB) yield is about 1.40% to 1.52%, with recent figures near 1.40%.
This results in a yield spread (Australia minus Japan) of roughly 278 to 365 basis points (2.78% to 3.65%), meaning Australian 10Y bonds yield significantly more than Japanese 10Y bonds.
2. Carry Trade and Yield Differential
The carry trade involves borrowing in a low-yield currency (e.g., Japanese yen) and investing in a high-yield currency (e.g., Australian dollar) to profit from the interest rate differential.
Given the large yield spread (~3%), investors can earn positive carry by borrowing JPY at low rates (~0.5%) and investing in AUD bonds yielding above 4%.
However, carry trade profits depend on currency movements: if the AUD depreciates against the JPY, gains can be eroded or losses incurred.
3. Uncovered Interest Rate Parity (UIP)
UIP theory states that the expected change in exchange rates offsets interest rate differentials, implying no arbitrage profits from carry trades.
For example, if Australian yields are 3% higher than Japanese yields, the AUD is expected to depreciate approximately 3% versus the JPY over the investment horizon.
Empirically, UIP often fails in the short term, allowing carry trade profits, but tends to hold over the long term.
4. Covered Interest Rate Parity (CIP)
CIP states that the forward exchange rate between two currencies should reflect the interest rate differential, eliminating arbitrage opportunities via forward contracts.
In practice, CIP generally holds in developed markets, meaning investors can hedge currency risk using forward contracts, locking in the carry trade return minus hedging costs.
Deviations from CIP can occur but are usually small and short-lived in major currency pairs like AUD/JPY.
Summary Table
Aspect Details
Australia 10Y Yield ~4.31%
Japan 10Y Yield ~1.40%
Yield Spread (AU - JGB) ~2.78% to 3.65% (278–365 basis points)
Carry Trade Borrow JPY at low rates, invest in AUD for yield pickup
UIP Exchange rate expected to depreciate AUD by yield diff.
CIP Forward rates reflect interest differential, hedging possible
Implications for Investors and Markets
The large yield differential incentivizes carry trades from JPY to AUD, contributing to capital flows and exchange rate dynamics.
Short-term carry trade profits arise due to UIP deviations but are subject to currency risk.
CIP arbitrage ensures that hedged carry trades have limited risk-free profits, but unhedged positions carry exchange rate exposure.
Central bank policies, geopolitical events, and market sentiment can cause fluctuations in yields and exchange rates, impacting carry trade viability.
#BOJ

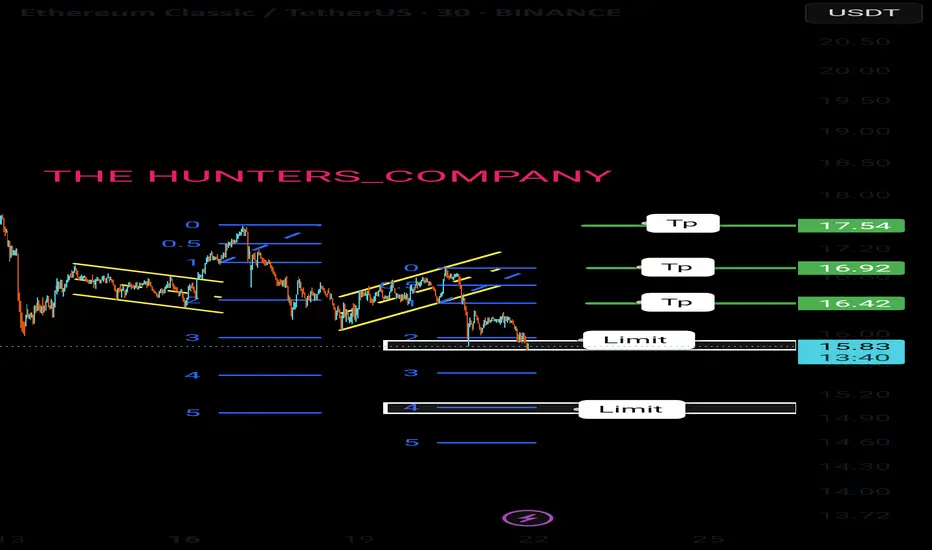
Ethereum Classic:Buying opportunity?hello friends 👋
Considering the price drop we had, you can see that buyers are coming in less and less in the support areas that we specified for you, and this can be a good signal to buy in these areas step by step with capital and risk management and move to the specified goals.
🔥Follow us for more signals🔥
*Trade safely with us*
Is Gold Bullish or Bearish? Coin Flip For Next WeekBullish Pennant or Bearish Weekly close for next week on Gold. Coinflip on the chart patterns. If Trump decides to bomb Iran definitely Gold Moon job. Trump said he will make that decision within 2 weeks.

uraniumThe 10-year Treasury bond yield plays a significant role in the energy markets, including uranium, by influencing financing costs, investment decisions, and broader economic sentiment, which in turn affect uranium demand and pricing dynamics.
Significance of the 10-Year Bond Yield in Uranium and Energy Markets:
Benchmark for Financing Costs
The 10-year Treasury yield serves as a benchmark for long-term borrowing costs for utilities and mining companies involved in uranium production and nuclear energy infrastructure.
Higher yields increase the cost of capital, potentially delaying or raising the cost of new uranium mine developments and nuclear plant investments. Conversely, lower yields reduce financing costs, supporting expansion and production.
Indicator of Economic and Inflation Expectations
Rising 10-year yields often signal expectations of stronger economic growth and inflation, which can boost energy demand, including uranium for nuclear power generation.
Declining yields typically reflect economic caution or slowdown, which may temper energy demand growth.
Impact on Utility Procurement Behavior
As uranium accounts for only about 5–10% of nuclear power generation costs, utilities prioritize securing supply to avoid operational disruptions, even at higher prices.
When bond yields are stable or falling (indicating lower financing costs and economic uncertainty), utilities are more likely to lock in long-term uranium contracts aggressively, driving prices higher.
Recent market conditions with the 10-year yield around 4.5% have coincided with utilities purchasing uranium in record quantities, pushing prices to 15-year highs.
Geopolitical and Supply Risk Amplification
The uranium market is sensitive to geopolitical risks, especially given that over half of global uranium supply and processing is controlled by countries within Russia’s sphere of influence.
Rising bond yields amid geopolitical tensions can increase risk premiums on uranium prices as investors and utilities seek supply security.
Investor Confidence and Capital Flows
The 10-year Treasury yield reflects investor confidence and risk appetite. Higher yields can attract capital away from commodities toward fixed income, potentially dampening speculative interest in uranium.
Conversely, lower yields can boost commodity investment appeal as investors seek higher returns, supporting uranium prices.
In essence, the 10-year Treasury yield is a crucial macro-financial gauge that indirectly shapes uranium market dynamics by affecting financing, demand expectations, and risk perceptions, thereby influencing uranium prices and investment decisions in the energy sector.
Key Use Cases of Uranium
Uranium serves critical functions across multiple sectors:
Nuclear Energy Fuel for commercial reactors generating electricity which Provides 10% of global electricity with low carbon emissions
Medical Isotopes ,the Production of radioisotopes (e.g., Technetium-99m) Enables cancer diagnostics and treatment through PET scans
the Military/Defense use uranium for Nuclear weapons , naval propulsion systems and the Powering of submarines and aircraft carriers
Space Exploration using Nuclear thermal propulsion with Potential fuel for long-duration space missions.
Scientific Research and Geological dating and particle physics which Studies earth's age and fundamental particles all apply uranium .
Demand drivers:
72 new nuclear reactors under construction globally (as of 2025)
Medical isotope market growth (7.2% CAGR projected)
Space agency investments in nuclear propulsion
Investment Considerations
Price volatility: Uranium spot prices impact producer profitability but long-term contracts provide stability
Sector-specific risks: Regulatory constraints, waste management challenges, and geopolitical factors affect uranium investments
Growth areas: Small modular reactors (SMRs) and radioisotope production represent emerging opportunities
Conclusion: Uranium's value stems from its diverse applications in energy, medicine, defense, and science. While no dedicated "uranium bond" exists, the sector's performance is reflected in mining stocks and long-term contracts. The metal's fundamental importance in clean energy and advanced technology underpins its long-term market position.

Birlasoft Ltd (BSOFT) – Long-Term Technical Analysis (TF-1D)📊 Chart Pattern Observed:
• The stock is forming a symmetrical triangle pattern, a consolidation pattern often leading to a breakout.
• Points A-B-C form higher lows, showing long-term support.
• The upper resistance lies near ₹739.90, indicating a potential breakout target.
⸻
📉 Current Price:
• ₹421.40, which is just above the highlighted “Best Buying Range” zone.
⸻
🟨 Best Buying Zone:
• Marked between ₹387.25 and ₹351.25.
• This zone is close to the lower trendline support (rising support), making it an ideal accumulation level.
⸻
📈 Upside Potential:
• If the stock sustains above the trendline and continues the triangle structure, it may head toward the ₹739.90 level.
• A breakout above ₹739.90 could trigger a strong upward move.
⸻
🔍 Momentum & RSI:
• The RSI is at 43.28, which is near the lower end — suggesting the stock is neither overbought nor oversold.
• Good for long-term entry if bullish confirmation appears.
⸻
📌 Key Support Levels:
• ₹387.25 (first support)
• ₹351.25 (strong support)
🚀 Key Resistance:
• ₹739.90 (major breakout level)
⸻
📝 Conclusion:
Birlasoft is currently in a long-term consolidation phase within a symmetrical triangle. The current price is above a strong support zone, making it a good risk-reward entry for long-term investors, especially between ₹387–₹351. A breakout above ₹740 could signal a major bullish rally.
⚠️ Disclaimer:
This analysis is for educational purposes only. I am not a SEBI registered advisor. Please consult your financial advisor before making any investment decisions.

Hdfc life gives breakout of 4 year consolidation zoneHdfc life gave weekly breakout of 4 year consolidation zone.

XRP M30 Chart Analysis "XRP Short.
Target: 123.01B. Stop: 127.09B.
Let's see if this plays out. 👀
#XRP #CryptoTrading"

AUDUSD Potential Long - Dependent on PA Market openAUD/USD Long Setup – 15M Chart Analysis
Looking at a potential long on AUD/USD after price tapped into demand and swept liquidity. The area aligns with a fair value gap and previous order block, suggesting interest from larger players.
Two Entry Options:
1. Aggressive: Buy limit at the order block (riskier, no confirmation).
2. Conservative: Wait for break of structure, then retest into FVG with bullish price action for confirmation.
Targets:
Target 1: 0.6470
Target 2: 0.6480
Target 3: 0.6490
Extended Target: 0.6530 (only if 0.6490 is breached and price holds above)
Important Notes:
This setup is forecast-based and depends on how price opens and reacts.
Entry should follow a clear confirmation, especially after a liquidity sweep.
Ideal confirmation: Break of structure followed by a retest with bullish PA on lower timeframes (M5/M1).
Invalidation: A clean break and close below 0.6430 would invalidate this idea.
Stay disciplined. Trade the plan, not the prediction.

USOIL: Strong Bearish Sentiment! Short!
My dear friends,
Today we will analyse USOIL together☺️
The in-trend continuation seems likely as the current long-term trend appears to be strong, and price is holding below a key level of 73.969 So a bearish continuation seems plausible, targeting the next low. We should enter on confirmation, and place a stop-loss beyond the recent swing level.
❤️Sending you lots of Love and Hugs❤️

NATURAL GAS XNGUSDCorrelations: Natural Gas, Bond Yields (US10Y), DXY, and Seasonal Patterns
1. Natural Gas and 10-Year Treasury Yield (US10Y)
Positive Correlation: Natural gas prices and the 10-year Treasury yield tend to move in tandem, driven by shared macroeconomic forces like inflation expectations and growth outlooks.
Mechanism: Rising yields signal economic strength or inflation, boosting industrial/energy demand and gas prices. Conversely, falling yields often align with gas price declines during economic softening.
2. Natural Gas and US Dollar Index (DXY)
Inverse Relationship (Historically): A stronger dollar (DXY↑) typically pressures natural gas prices, as dollar-denominated commodities become costlier for global buyers, reducing demand.
Exception: During extreme supply disruptions (e.g., geopolitical crises), a strong dollar and gas prices can rise together if global energy shortages override currency effects.
Recent Weakness: This correlation has diminished in 2024–2025, with DXY and gas prices occasionally moving independently amid supply shocks (e.g., LNG export surges).
3. Seasonal Impact on Natural Gas (Winter vs. Summer)
Winter (Peak Demand):
Demand: Heating needs (residential/commercial) drive consumption to yearly highs (e.g., 30+ Bcf/d in U.S. residential use).
Price Impact: Colder winters amplify price spikes, especially if storage inventories are low or supply chain disruptions occur.
Summer (Secondary Peak):
Demand: Electricity generation for cooling sustains demand, though typically below winter peaks.
Price Impact: Heatwaves can cause short-term surges, but prices generally remain lower than in winter.
4. Seasonal Influence on Correlations
Winter:
US10Y Correlation Strengthens: Inflation fears from heating demand can push yields and gas prices higher together.
DXY Correlation Weakens: Geopolitical supply risks (e.g., Russia-Ukraine tensions) may decouple gas from dollar strength.
Summer:
US10Y Correlation Muted: Cooling demand is less inflation-sensitive, weakening the gas-yield link.
DXY Correlation Resumes: Stronger dollar more consistently pressures gas prices absent winter-like crises.
Key Drivers Macro growth/inflation expectations Global trade costs, currency flows Weather, storage levels
Conclusion
Natural gas exhibits a strong positive correlation with 10-year yields (driven by shared macro sensitivity) and a historically inverse link to the dollar (though recently unstable). Seasonal peaks in winter amplify gas-yield ties due to inflation risks, while summer realigns gas with dollar dynamics. Geopolitical or supply shocks can override these patterns, particularly in winter.
#DOLLAR #GAS

Bitcoin Bullish Pennant(D)Bitcoin is forming a bullish pennant on the daily timeframe. A classic continuation pattern following strong upward momentum. A breakout above the resistance trendline could signal the next leg up. Watching closely for volume confirmation and a potential retest before continuation. Bullish bias remains intact as long as support holds.

NG1!: Bulls Are Winning! Long!
My dear friends,
Today we will analyse NG1! together☺️
The market is at an inflection zone and price has now reached an area around 3.894 where previous reversals or breakouts have occurred.And a price reaction that we are seeing on multiple timeframes here could signal the next move up so we can enter on confirmation, and target the next key level of 3.993.Stop-loss is recommended beyond the inflection zone.
❤️Sending you lots of Love and Hugs❤️

INDUS TOWER- BREAKOUTNSE:INDUSTOWER Monthly breakout almost 9 years consolidation breakout and retest on monthly chart. price will continue further rally from here.

NRB BEARING - LONGNSE:NRBBEARING Weekly channel breakout with outperforming the market. Bullish setup will continue in near future.

NI225: Next Move Is Up! Long!
My dear friends,
Today we will analyse NI225 together☺️
The price is near a wide key level
and the pair is approaching a significant decision level of 38,501.82 Therefore, a strong bullish reaction here could determine the next move up.We will watch for a confirmation candle, and then target the next key level of 38,689.93.Recommend Stop-loss is beyond the current level.
❤️Sending you lots of Love and Hugs❤️

DMART - LONGNSE:DMART Weekly rounding bottom formation , price giving breakout with retest and again breakout may continue trend upward till previous top.

BHEL- LONGNSE:BHEL Weekly continuous formation with strict tight channel may continue further bullish rally in near term.

EUR_CHF CORRECTION AHEAD|SHORT|
✅EUR_CHF is set to retest a
Strong resistance level above at 0.9446
After trading in a local uptrend for some time
Which makes a bearish pullback a likely scenario
With the target being a local support below at 0.9410
SHORT🔥
✅Like and subscribe to never miss a new idea!✅
Disclosure: I am part of Trade Nation's Influencer program and receive a monthly fee for using their TradingView charts in my analysis.
