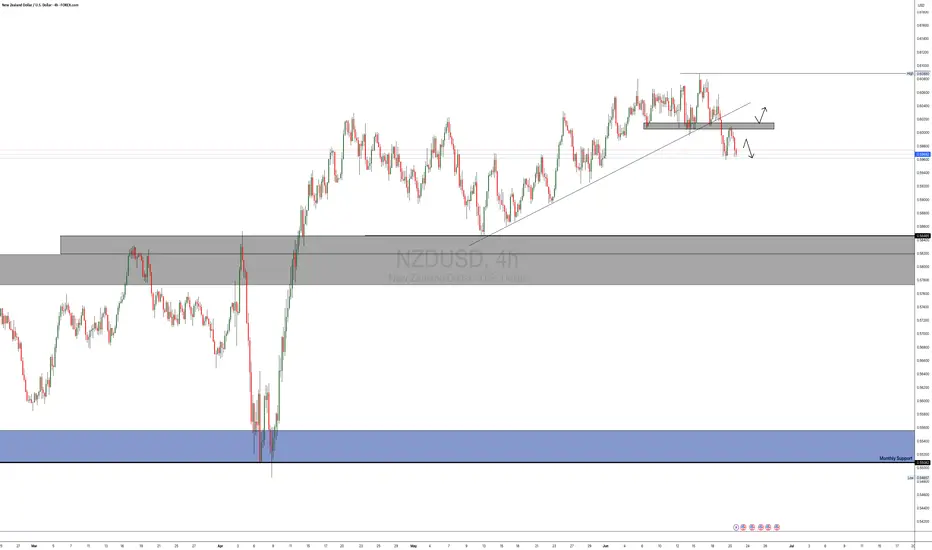
NZD_USD WILL GO DOWN|SHORT|
✅NZD_USD is going down currently
As the pair broke the key structure level of 0.6030
Which is now a resistance, and has made a pullback
And the retest, so I think the price will keep going down on Monday
SHORT🔥
✅Like and subscribe to never miss a new idea!✅
Disclosure: I am part of Trade Nation's Influencer program and receive a monthly fee for using their TradingView charts in my analysis.
Chart Patterns

Forex and Gold Market Highlights June 21 2025Forex & Gold Market Highlights – June 21, 2025
🕒 Key Events This Week:
• 🏦 Fed officials signaling possible rate cuts vs. cautious economic tone
• 🌍 Escalating Israel–Iran tensions boosting safe-haven flows
• 🏭 Mixed U.S. macro data (retail sales, Philly Fed, housing) shaping Fed expectations
________________________________________
💶 EUR/USD Nears 1.1520 on Safe-Haven Flows
EUR/USD edged up to about 1.1520 amid weakness in the U.S. dollar, driven by global risk-off sentiment. Mixed signals from the Fed kept traders cautious.
________________________________________
💷 GBP/USD Hovering Around 1.3500 on USD Strength
GBP/USD remains near 1.3500, slipping slightly off highs after weaker UK retail data. The pair faces resistance in the 1.3550–1.3600 zone.
________________________________________
💴 USD/JPY Eyeballing 146 Resistance
USD/JPY climbed toward 146.00, driven by risk-averse USD demand and dovish BOJ stance. The pair is testing key retracement resistance near 146.76.
________________________________________
🥇 Gold Pulls Back but Holds Ground
Spot gold slid to around $3,334 3,381 this week, under pressure from a stronger dollar and diminished Fed rate-cut hopes. Still, geopolitical jitters kept it from falling hard.
• Weekly drop of ~2.5%, trading in a $3,330–$3,400 range.
________________________________________
📈 DXY Index Rallies on Risk Aversion
The U.S. Dollar Index rose ~0.45%, marking its strongest weekly gain in over a month due to heightened safe-haven flows amid Middle East tensions.
________________________________________
📌 Market Outlook:
• EUR/USD: Mixed bias. May test 1.1550–1.1600 if risk-off continues; downside risk near 1.1400 if U.S. data surprises.
• GBP/USD: Expected to stay in the 1.3450–1.3550 range; UK economic data and USD momentum will be key.
• USD/JPY: Bullish tilt remains toward 146.76, but any BOJ hints of policy tightening could shake it.
• Gold: Pressure from a firm dollar is likely to persist. Watch for geopolitical developments and upcoming Fed signals for reversal clues.

GPSUSDT.P LongThe setup has been marked.. We need to see the retest with bullish momentum to enter in the trade.
Dyor

GeoVax Looking long to $1.60Looking to the upside around $1.60. Break above the lower high structure. Pulled back into a key zone, looking for buy opportunity.

BUSDT SHORTThe setup has been marked on the chart.
Let the price retest the rectangle zone showing bearish strength like bearish candles only than enter the trade..
DYOR

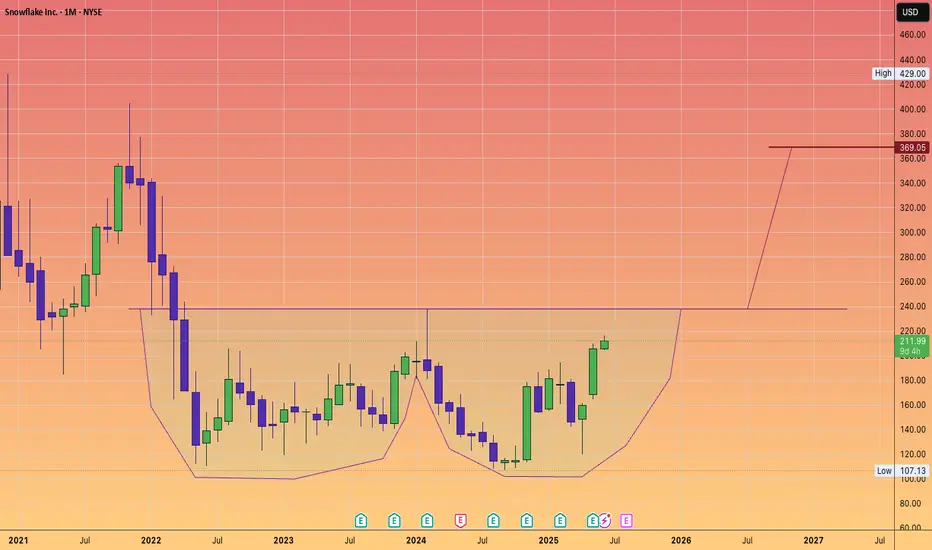
SNOWFLAKE to $369Snowflake Inc. is an American cloud-based data storage company.
Headquartered in Bozeman, Montana, it operates a platform that allows for data analysis and simultaneous access of data sets with minimal latency. It operates on Amazon Web Services, Microsoft Azure, and Google Cloud Platform.
As of November 2024, the company had 10,618 customers, including more than 800 members of the Forbes Global 2000, and processed 4.2 billion daily queries across its platform
#DoubleBottom
#Wformation
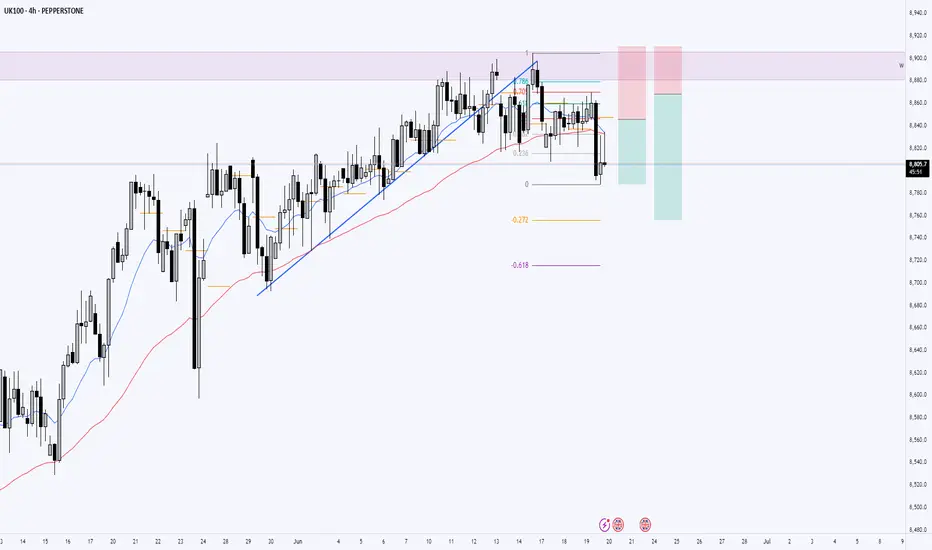
UK100 Bearish Setup Developing📉 Weekly Overview:
Price is currently held by a significant weekly resistance level. Last week formed bearish price action, indicating potential exhaustion from buyers and room for sellers to step in.
📉 Daily Chart:
Although no strong momentum candle yet, price has already broken internal bullish structure to the downside. EMA50 is starting to flatten, hinting at a potential momentum shift.
📉 4H Chart:
Clear sign of bearish transition – uptrend line is broken, price is now trading below the 50EMA, and we recently see strong seller momentum candles. This adds further confluence to bearish bias.
🔍 Plan:
Bias: Bearish
Entry: After bearish confirmation candle on 1H or 4H retracement to premium zone
Targets:
TP1: Previous 4H low
TP2: Daily support zone
Invalidation: Break and close above 4H 50EMA and recent structure high
#SQT/USDT#SQT
The price is moving within a descending channel on the 1-hour frame and is expected to break and continue upward.
We have a trend to stabilize above the 100 moving average once again.
We have a downtrend on the RSI indicator that supports the upward move with a breakout.
We have a support area at the lower boundary of the channel at 0.001148, acting as strong support from which the price can rebound.
Entry price: 0.0011634
First target: 0.001200
Second target: 0.001253
Third target: 0.001296

My system.Hi followers, I have kept my system a secret because i have been struggling for 3 years now i am at my 5th year and it has been working well, i will be launching a course to teach it, this is a no Indicator system, no trendline, simple rules to follow majority of the works come from the mental side.
NASDAQ Bullish Play into Liquidity Before Potential ReversalForecast:
NOTE: At this moment, this is a forecast and trades will be taken dependent on live PA.
Price has reacted strongly off the 21,410–21,430 Daily Order Block, suggesting bullish intent. If bullish structure holds, I expect a move into the 22,060–22,130 liquidity zone, where sell-side setups could form.
This is a classic Buy to Sell model:
Buy from OB at ~21,420
Target liquidity above recent highs (~22,100+)
Look for shorts after sweep into 22,130–22,220 range
Invalidation: Break and close below 21,410 suggests the OB failed — potential deeper drop toward 20,700.

WTI POSSIBLE TRADE SETUPPotential Trade Setup on WTI
WTI has been on a strong 2-week rally, following the geopolitical escalation where Israel launched a preemptive attack on Iran. This event sparked a 2% surge, keeping prices hovering around $77 for the past two weeks.
Despite the bullish momentum, I am anticipating a healthy pullback before looking to engage.
My eyes are on two key zones:
- April High Region (Previous resistance turned support)
- 50% Fibonacci Retracement (Measured from recent rally low to high)
🧭 Trading Plan:
1. BUY: is currently the only play, and as I anticipate for a two-level of pullback on the 4H chart.
🟢 Risk-to-Reward:
Targeting 1:3 R/R on either entry.

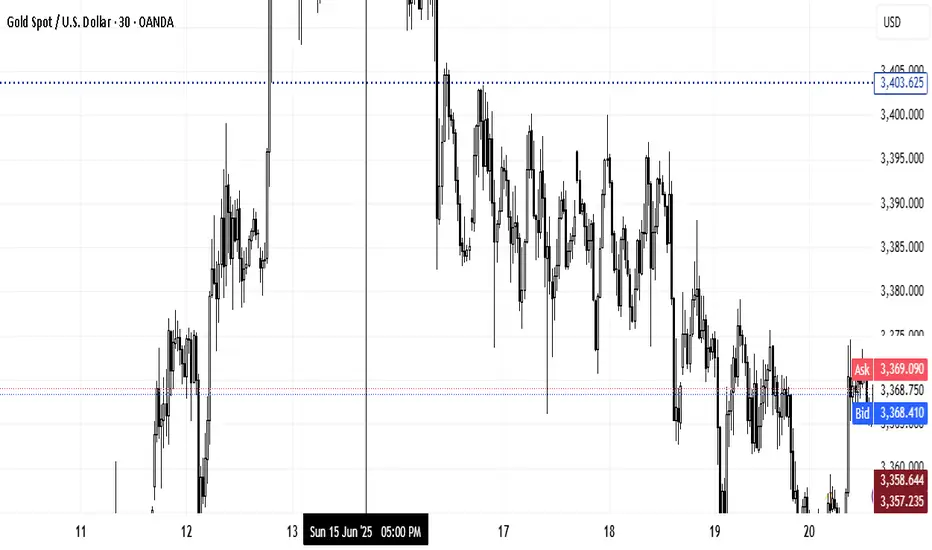
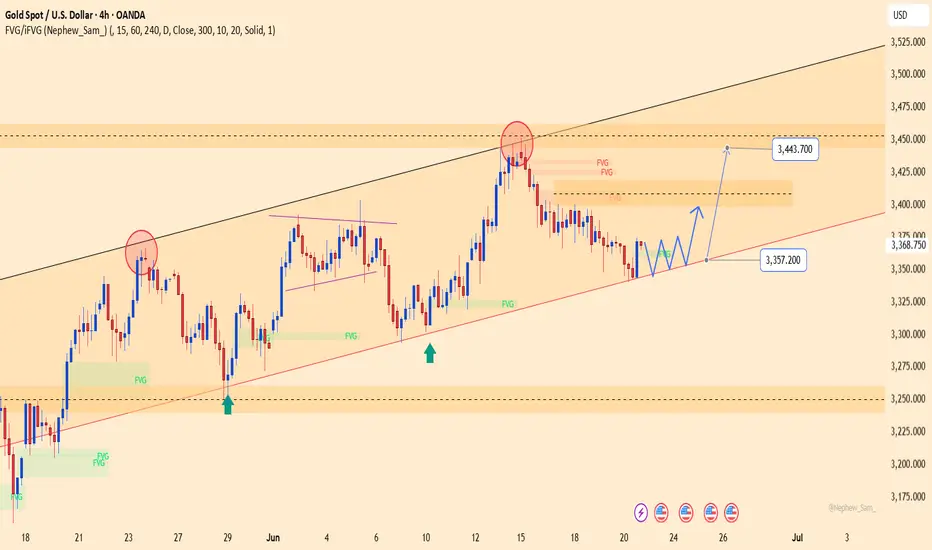
XAUUSD – Weak consolidation near 3,357, eyes on 3,443 retestYesterday, gold traded within the 3,344 to 3,371 USD range and closed at 3,368.75 USD (+0.72%). Despite the slight rebound, price action remains weakly consolidative within a broad ascending channel, repeatedly rejected at the 3,443 USD resistance area — where multiple FVGs (Fair Value Gaps) remain unfilled.
On the H4 chart, price is holding above the key confluence support at 3,357 USD, which aligns with the medium-term ascending trendline. If this level holds, a technical bounce back toward 3,443 USD is likely.
However, it's worth noting that recent upward moves have lost momentum near the upper FVG zones. Traders should wait for a clear confirmation signal — particularly a strong bullish candle at the current support — before considering entry.
#ACH/USDT#ACH
The price is moving within a descending channel on the 1-hour frame and is expected to break and continue upward.
We have a trend to stabilize above the 100 moving average once again.
We have a downtrend on the RSI indicator, which supports the upward move by breaking it upward.
We have a support area at the lower limit of the channel at 0.01800, acting as strong support from which the price can rebound.
Entry price: 0.01878
First target: 0.01925
Second target: 0.01970
Third target: 0.02025

#INJ/USDT#INJ
The price is moving within a descending channel on the 1-hour frame and is expected to break and continue upward.
We have a trend to stabilize above the 100 moving average once again.
We have a downtrend on the RSI indicator that supports the upward move with a breakout.
We have a support area at the lower limit of the channel at 0.04263, acting as strong support from which the price can rebound.
Entry price: 10.70
First target: 11.11
Second target: 11.43
Third target: 11.86

NZDUSD POSSIBLE TRADE SETUPPotential Trade Setup on NZDUSD
NZDUSD is on a strong 3-week rally correction that almost got broken to the downside last week and successfully retested on Friday
That said, I am still quite anticipating for a possible continuation of the bearish trajectory that started last week to continue towards the MAY low at 0.5880
Trading Plan:
1. SELL: is currently in play, and a further downside movement can be well followed through in the 4H chart.
2. BUY: if the resistance is broken and the retest is successful.
Targets:
1. Can be 1:2 for either entry.
#STRAX/USDT#STRAX
The price is moving within a descending channel on the 1-hour frame and is expected to break and continue upward.
We have a trend to stabilize above the 100 moving average once again.
We have a downtrend on the RSI indicator that supports the upward move with a breakout.
We have a support area at the lower limit of the channel at 0.04263, acting as strong support from which the price can rebound.
Entry price: 0.04262
First target: 0.04311
Second target: 0.04311
Third target: 0.04426

EURUSD to Retest 1.16 regionWatching the 1.1490–1.1450 zone for a potential bullish reaction. This area includes a 4H Fair Value Gap and Order Block. If price gives a 15M CoCH within this range, I’ll look to enter long.
Targets: 1.1540, 1.1570, and 1.1610
Invalidation below 1.1440
Patience until price delivers a clear setup.

ETH 4H – Testing Support, Rejected by Weekly 200MAOn the 4H, ETH is closing below the weekly 200MA but is trying to hold the last daily close as support—similar to what it did on June 5 at 20:00.
The difference: back then, the 4H 200MA acted as support; now it’s been clearly rejected and price sits well below it.
With the weekly close approaching, if ETH stays under the weekly 200MA, there's a strong chance it revisits the range low support.
However, if it manages to reclaim the 200MA before the close, a move toward the last two weekly closes may still be on the table.
Always take profits and manage risk.
Interaction is welcome.

NASDAQ READY TO CONTINUE THE LONG-TERM WEEKLY BULLISH RUN
FX:NAS100
I just entered this buy trade on Nasdaq on the daily time frame.
The trade setup is a Swing trade following the monthly and weekly orderflow.
The Monthly is bullish, the weekly is also bullish, so I entered on the daily time frame retracement.
My overall take profit is a risk reward of 1:4.

HYPE Long-short-Long planHYPE is good for the short-term long-position at this moment, as it could go as far as 40 from 34.18 to form a Second shoulder.
But it will not sustain over there, and will come down to 22.
There could be another possibility that it may come between 28-29 and form shoulder 2, and then come back to 22.
I will only enter a long position when it takes support from 28 or 22.
Future traders may see short opportunities near 40-41. You will have to wait for price rejection at 40-41.
If it fails these 2 support areas, then I will look for 15-16.

SUIUSD, almost near bottom, parabolic move nextSUI currently ay 2.65 is presently positioned near the lower boundary of its trendline. I expect an upward trajectory, potentially leading to a significant parabolic increase. We will monitor its progress.

NATURAL GASNatural gas prices have pulled back from a 2½-month high due to forecasts of normalizing summer temperatures in the U.S., which could reduce cooling demand and electricity generation needs.
Demand Drivers:
U.S. LNG exports are ramping up, supporting demand and prices. LNG export facilities like Plaquemines LNG and Corpus Christi Stage 3 began production in late 2024, with more capacity expected in the next two years.
Domestic demand for natural gas in power generation is expected to rise seasonally in summer, with June electric power consumption projected to be about 25.7% higher than May.
Supply Factors:
U.S. dry gas production remains robust, currently around 106.7 billion cubic feet per day (Bcf/d), up 3.3% year-over-year.
Natural gas inventories are near five-year averages but expected to end the injection season (October 31) about 3% below average due to strong demand and exports.
Price Forecast:
The U.S. Energy Information Administration (EIA) projects Henry Hub spot prices to average around $4.00/MMBtu in 2025 and rise further to about $4.90/MMBtu in 2026, driven by increased LNG exports and domestic consumption growth.
Conclusion
Natural gas prices are currently moderating after recent gains but remain supported by strong export demand and seasonal power consumption increases. The market outlook is for prices to rise through 2025 and 2026 as LNG exports expand and domestic demand grows, despite some short-term weather-driven fluctuations.
#LNG #USOIL #DOLLAR

BBFL is BullishPrice was in a strong downtrend, however an extended bullish divergence, breakout from descending trendline, printing of hammer candle and a higher high all hint at the return of bulls for the price action. If freshly printed higher high is broken with good volume then we can expect a good bullish reversal as per Dow theory. Targets are mentioned on the chart.
