Precious Metals Leading Charge HigherStarting off the week today, traders are seeing many markets moving higher with the precious metals and energy markets leading the way. Gold futures over 2.5% on the session while Silver led the charge higher being up nearly 5%, and the Crude Oil market saw gains north of 3% while Natural Gas was up over 7% on the session. Equity markets traded slightly higher on the session but did not see the volatility seen in the precious metals or energy markets.
Looking at the economic data today, there was a big slate of data coming out of the U.S. looking at ISM manufacturing and S&P Global manufacturing that came in worse than expected. Tomorrow, traders will get a look at CPI coming out of Europe and JOLTs data here in the U.S. that could add additional volatility to the precious metals for the rest of the week. Along with that, the CVOL for Silver still remains very wide as seen below, and looking back over the past year shows that the volatility is relatively low compared to the current underlying price even with the spike traders saw today.
If you have futures in your trading portfolio, you can check out on CME Group data plans available that suit your trading needs tradingview.com/cme/
*CME Group futures are not suitable for all investors and involve the risk of loss. Copyright © 2023 CME Group Inc.
**All examples in this report are hypothetical interpretations of situations and are used for explanation purposes only. The views in this report reflect solely those of the author and not necessarily those of CME Group or its affiliated institutions. This report and the information herein should not be considered investment advice or the results of actual market experience.
Chart Patterns

Bullish Trend this is my outlook on gold currently waiting for the four hour candle to close to determine if i will be short term selling with this pullback or the next push to my next level

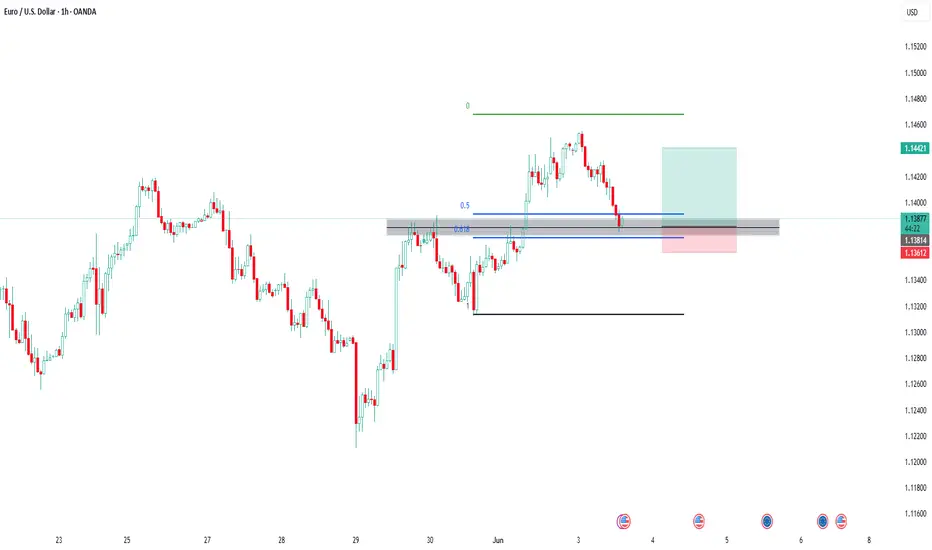
EURUSD – Retracement Expected Before Further UpsideEURUSD – Retracement Expected Before Further Upside
The EURUSD pair has seen strong bullish momentum over the past two days, mainly driven by the weakening U.S. dollar. Last week’s softer-than-expected U.S. Core PCE and PMI data fueled speculation that the Federal Reserve may hold rates steady for longer, weighing on USD sentiment.
However, with upcoming speeches from FOMC members and the Non-Farm Payrolls (NFP) data due later this week, traders may look to take profit or step aside, leading to a short-term retracement before any continuation of the bullish trend.
🔍 Macro & Fundamental Overview:
USD remains under pressure amid declining inflation signals and weakening economic data.
ECB is expected to cut rates, but at a slower pace than the Fed, creating a divergence that supports the Euro in the near term.
Political uncertainties in the EU, including upcoming elections, are worth monitoring.
📉 Technical Analysis:
The medium-term trend remains bullish with EMA 13–34–89–200 aligned to the upside.
Price is currently reacting at the 0.0 FIBO level (1.1420), suggesting a potential pullback.
Key support lies between 1.1345 – 1.1317. If this zone holds, it could serve as a solid base for a bullish continuation.
🧭 Suggested Trade Scenarios:
🔵 BUY ZONE: 1.1317 – 1.1345
SL: 1.1285
TP: 1.1370 → 1.1400 → 1.1420 → 1.1450+
🔻 SELL ZONE (Short-term counter-trade): 1.1418 – 1.1425
SL: 1.1450
TP: 1.1385 → 1.1350 → 1.1320

Bitcoin - Here we have the all time high!Bitcoin - CRYPTO:BTCUSD - is just getting started:
(click chart above to see the in depth analysis👆🏻)
It was really just a matter of time until we see a new all time high on Bitcoin. Consindering that over the past two months alone, Bitcoin rose another +50%, this was a clear indication that bulls are taking over. But this all time high is clearly not the end of the bullrun.
Levels to watch: $300.000
Keep your long term vision!
Philip (BasicTrading)

EUR USD Trade Setup 1 hour timeframe EUR USD Trade Setup 1 hour timeframe
EUR USD has formed a Bullish Break and Retest pattern on the 1 hour timeframe and the price is currently at the retest level.
LONG ON GBP/JPYGJ has given us a double bottom at a major demand level.
I am looking to catch over 100 pips on GJ to the previous high.

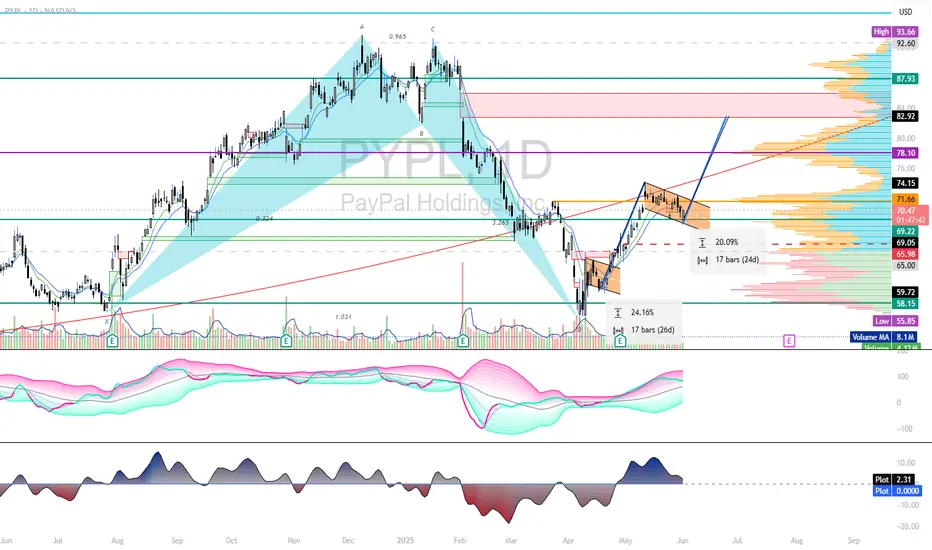
LONG (E-PAY)PAYPALHuge tail on this in larger frames, and another huge hmnc on daily. see flagging into gap...if info TL holds any weight ill find out. tossed coin at NASDAQ:PYPL $80 6-27-25 call @ 0.15; at that price...Why not.
Silver on it's way to pass $40 Examining the technicals of the silver chart, the outlook for 2025 suggests that the silver price will likely surpass $40 within a few weeks and remain between $40 and $42 at the end of the year.

Geopolitical conflicts dominate gold price fluctuationsFrom a technical perspective, gold closed with a long lower shadow last week, indicating strong support from below. It opened higher on Monday to around $3,252 before falling back, entering a short-term consolidation phase, but the $3,200 integer mark was lost and regained. The daily level stood firmly on the 60-day moving average, and the Bollinger Bands closed, indicating that the market is accumulating upward momentum. Gold is generally bullish this week, with an upper target of $3,280; if it breaks through this resistance level, it may fill the previous gap and further test $3,350 or even $3,400.
Gold's 1-hour K-line shows that gold has bottomed out and rebounded, recovering the losses of last Friday, and is currently close to the upper track of the Bollinger Band. Technical indicators show that there is an obvious bottoming signal below, and there is still room for growth. However, before effectively breaking through $3,280, it is difficult for gold to form a unilateral upward trend. Therefore, this week's operation is considered to be divided into two stages: below $3,280, it is treated as a volatile upward trend, and after breaking through, it will turn into a unilateral upward trend. For gold's short-term operation strategy today, it is recommended to focus on low-level longs and rebound high-level shorts. The short-term focus on the upper resistance of 3250-3260 is 3250-3260, and the short-term focus on the lower support of 3115-3105 is 3115-3105.
Operation strategy:
1. Gold is recommended to go long in the 3220-3215 area, with a stop loss at 3207 and a target of 3230-3240
2. Gold is recommended to go short in the 3250-3255 area, with a stop loss at 3263 and a target of 3235-3225

ENA 3D LONG SETUPMIL:ENA is holding tight above the 3D demand cluster at $0.3199–$0.3397 (61.8–78.6% Fib). With equal lows just below, we could see a stop-run before a real reversal.
1. Context & Structure
• Key support defended at $0.3199–$0.3397
• Demand zone aligns with Fib levels (0.618–0.786)
• Series of equal lows (~$0.3199) sets up a liquidity sweep area
• Wide-range resistance at $0.4629 and major weekly supply at $1.2003
2. Plan & Levels
– Buy Zone: $0.31–$0.32 (add on pullbacks)
– Stop‐Loss: $0.2390 (below equal lows/liquidity zone)
– Take‐Profits:
1️⃣ $0.4629 (swing high)
2️⃣ $1.2003 (weekly supply cluster)
Conclusion
Long bias remains intact while $0.31 holds. Look to scale in at the green zone, tighten stops on strength, and target the 0.4629–1.2003 area for major resistance. Patience and proper risk management are key. 🚀

another move downwards?bitcoin is showing signs of trend exhaustion.
volume is going down and I believe there's going to be a major dump either from these levels or at the most 125k . I'm actively looking for selling opportunities from now on
the last target for this move is probably the 70 to 64k order block

FEROZ LONG (SECOND STRIKE TRADE) 02-06-2025FEROZ LONG TRADE was shared here. ()
FEROZ has resumed its upward trajectory after a healthy correction from its December 2024 high of Rs. 393, retracing close to the 61.8% Fibonacci level — a key support zone.
Bullish technical confirmation:
• Price closed above the 20-Day EMA, signaling short-term strength.
• Higher Low formation, indicating potential trend reversal.
• Increased volumes on the recent up-move, suggesting strong accumulation.
With technical indicators aligning positively, a fresh uptrend appears to be in play. Buy on dips or at CMP for potential upside towards previous highs.
It Hit TP1 and took a pull back. We gave a rebuy call on group during live market hours. Its again in second Pull Back after Targeting 350 (TP1++).
Sharing Second Strike Call.
🚨 TECHNICAL BUY CALL – FEROZ🚨
BUY1: 330-335
BUY2: 322
BUY3: 311
📈 TP1 : Rs. 350
📈 TP2 : Rs. 380
🛑 STOP LOSS: BELOW Rs. 270 (Daily Close)
📊 RISK-REWARD: 1:1.8 (Medium)
Caution: Close at least 50% position size at TP1 and then trail SL to avoid losing incurred profits in case of unforeseen market conditions.
PLEASE BOOST AND SHARE THE IDEA IF YOU FIND IT HELPFUL.

EURUSD on the rise Yesterday, EURUSD continued its bullish move and reached the first target at 1,1427.
Now, watch how it reacts around the support levels.
If it bounces, we could see new buying opportunities.
The main target remains a break above the previous high and a move toward 1,1563.
Don't forget about the upcoming news at the end of the week - manage your risk accordingly!

CHECK USDJPY SIGNAL READ CAPTAINCHECK (usdjpy) buy zone
( TRADE SATUP)
ENTRY POINT (142.700) to (142.800) 📊
FIRST TP (143.100)
2ND TARGET (143.550) 📊
LAST TARGET (144.050) 📊
STOP LOOS (142.250)❌

CHFJPY Buyers In Panic! SELL!
My dear subscribers,
CHFJPY looks like it will make a good move, and here are the details:
The market is trading on 175.09 pivot level.
Bias - Bearish
My Stop Loss - 175.56
Technical Indicators: Both Super Trend & Pivot HL indicate a highly probable Bearish continuation.
Target - 174.30
About Used Indicators:
The average true range (ATR) plays an important role in 'Supertrend' as the indicator uses ATR to calculate its value. The ATR indicator signals the degree of price volatility.
Disclosure: I am part of Trade Nation's Influencer program and receive a monthly fee for using their TradingView charts in my analysis.
———————————
WISH YOU ALL LUCK

BULLISH GUPrice has broken Key Resistance & Retested.
Entry was after the Bullish Engulfing on the 1HR/Fib Retracement Zone/Break and Retest of Key Support
TP 1 - 1.35555 | 1st Resistance
TP 2 - 1.35816 | -27 Extension
TP 3 - 1.36138 | -61.8 Extension


EURAUD INTRADAY Bearish rising wedge capped at 1.7645Trend: Bearish
Current Move: Oversold bounce toward resistance
Key Resistance: 1.7645 – Prior consolidation zone
Key Supports:
1.7400 – Immediate support
1.7273 – Secondary support
1.7120 – Longer-term target
Scenario 1 – Bearish Continuation:
If price fails to break above 1.7645 and shows rejection (e.g. bearish candlestick pattern), expect a move lower toward 1.7400, and potentially 1.7273 and 1.7120 over time.
Scenario 2 – Bullish Reversal:
If price breaks and closes above 1.7645 on the daily chart, it would invalidate the bearish view and open up upside targets at 1.7770, 1.7885, and 1.8010.
Conclusion:
EURAUD remains bearish below 1.7645. A rejection at that level favors downside continuation. A daily close above 1.7645 would shift sentiment toward a bullish reversal. Monitor price action closely at this key level.
This communication is for informational purposes only and should not be viewed as any form of recommendation as to a particular course of action or as investment advice. It is not intended as an offer or solicitation for the purchase or sale of any financial instrument or as an official confirmation of any transaction. Opinions, estimates and assumptions expressed herein are made as of the date of this communication and are subject to change without notice. This communication has been prepared based upon information, including market prices, data and other information, believed to be reliable; however, Trade Nation does not warrant its completeness or accuracy. All market prices and market data contained in or attached to this communication are indicative and subject to change without notice.

Bullish bounce off pullback support?The Fiber (EUR/USD) is falling towards the pivot and could bounce to the 1st resistance.
Pivot: 1.1367
1st Support: 1.1278
1st Resistance: 1.1475
Risk Warning:
Trading Forex and CFDs carries a high level of risk to your capital and you should only trade with money you can afford to lose. Trading Forex and CFDs may not be suitable for all investors, so please ensure that you fully understand the risks involved and seek independent advice if necessary.
Disclaimer:
The above opinions given constitute general market commentary, and do not constitute the opinion or advice of IC Markets or any form of personal or investment advice.
Any opinions, news, research, analyses, prices, other information, or links to third-party sites contained on this website are provided on an "as-is" basis, are intended only to be informative, is not an advice nor a recommendation, nor research, or a record of our trading prices, or an offer of, or solicitation for a transaction in any financial instrument and thus should not be treated as such. The information provided does not involve any specific investment objectives, financial situation and needs of any specific person who may receive it. Please be aware, that past performance is not a reliable indicator of future performance and/or results. Past Performance or Forward-looking scenarios based upon the reasonable beliefs of the third-party provider are not a guarantee of future performance. Actual results may differ materially from those anticipated in forward-looking or past performance statements. IC Markets makes no representation or warranty and assumes no liability as to the accuracy or completeness of the information provided, nor any loss arising from any investment based on a recommendation, forecast or any information supplied by any third-party.

GOLD Will Grow! Long!
Here is our detailed technical review for GOLD.
Time Frame: 45m
Current Trend: Bullish
Sentiment: Oversold (based on 7-period RSI)
Forecast: Bullish
The market is approaching a significant support area 3,357.59.
The underlined horizontal cluster clearly indicates a highly probable bullish movement with target 3,378.12 level.
P.S
The term oversold refers to a condition where an asset has traded lower in price and has the potential for a price bounce.
Overbought refers to market scenarios where the instrument is traded considerably higher than its fair value. Overvaluation is caused by market sentiments when there is positive news.
Disclosure: I am part of Trade Nation's Influencer program and receive a monthly fee for using their TradingView charts in my analysis.
Like and subscribe and comment my ideas if you enjoy them!


eur/usd 15mThis chart is for the EUR/USD currency pair on the 30-minute timeframe. Here’s a breakdown of the technical analysis presented:
Key Areas:
1. Register Zone (Resistance) – 1.14538
Marked in red, this is a strong resistance area where price previously reversed.
It's the potential stop-loss zone for short trades.
2. 1st Setup (Entry Area) – 1.13991
A potential entry point for a short position.
Aligned with a recent support-turned-resistance level.
3. Target Level (Support) – 1.13574
Marked in green, this is the take-profit zone for the short setup.
Chart Insights:
The chart shows a descending trendline, indicating lower highs—suggesting weakening bullish momentum.
Two yellow circles highlight points of failed bullish continuation at the trendline, reinforcing bearish sentiment.
The arrows suggest the expected movement:
Price to reject at or below the trendline and move down toward the target level.
If this move fails, a stop-out might occur near the register zone.
Strategy Summary:
Bias: Bearish (Short Setup)
Entry: Around 1.13991
Stop Loss: Around 1.14538 (above the register zone)
Take Profit: Around 1.13574
Would you like help with


NATURAL GASS IS FALLINGHello big brothers and sisters, lets flow with these current situation of PEPPERSTONE:NATGAS , currently, team sellers are not showing signs of slowing down, the foundation that team bullish had been holding unto got collapse today, so as it is, sellers are domination, I'm a very lazy person, so i always wait for my bigger brothers and sisters to do the fighting for me, then i joined to walk behind the winning team. All details concerning these post are all on the video.
