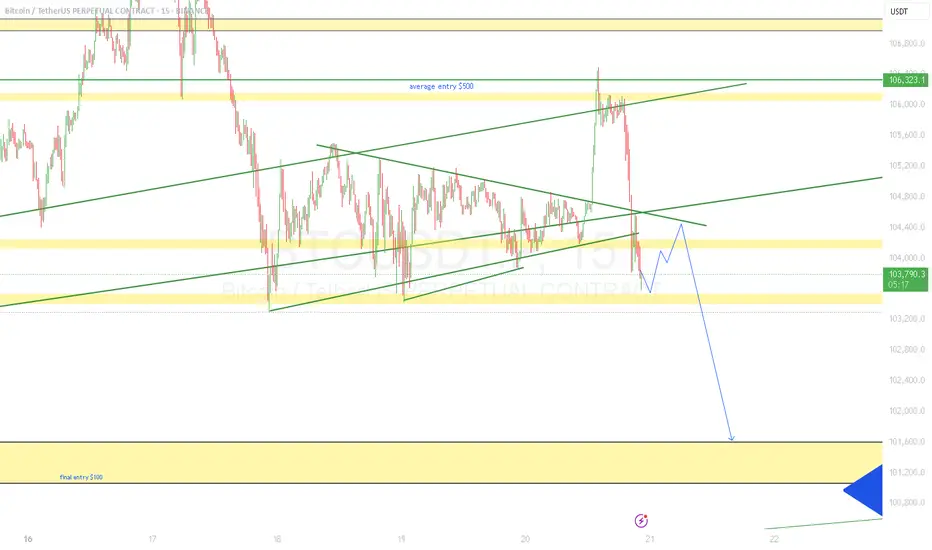
BTC dump time , fake breakout, watch US news todayAny US strike on Iran will lead to a big dump in price
Chart Patterns

HYPE/USDT Technical Analysis (4H Chart)🔍 HYPE/USDT Technical Analysis (4H Chart)
High Time Frame (Daily): Bullish
Despite recent pullbacks, the overall trend remains bullish on the daily timeframe. However, current price action suggests a potential fakeout or legitimate breakdown, as we test key structural and volume-based supports.
Short-Term Time Frame (4H): Bearish
The 4-hour chart displays clear bearish pressure, confirmed by the Three Black Crows candlestick pattern. This signals sustained selling interest and supports the current downward move.
🧱 Key Zones
Supply Zone: $41.7 – $45.9
Strong resistance marked by prior selling pressure and overlapping FVGs.
Demand Zone: $24.4 – $26.3
Historical area of buying support, aligned with a low-volume node and an unfilled FVG.
📏 Fair Value Gaps (FVGs)
Above Price:
Four 4H FVGs act as upside inefficiencies, offering targets in a bullish recovery:
~$34.9
~$36.6
~$37.8
~$40.0 (psychological level & POC cluster)
Below Price:
One major 4H FVG remains unfilled, directly above the demand zone.
📐 Fibonacci Analysis
Price is testing the Golden Pocket (0.618–0.65) from the recent swing low to high.
A clean break below this area (with confirmation) targets the unfilled FVG around $30, and potentially the demand zone ($24.4–$26.3).
📉 Volume Profile Insight
Volume is clustered around $34–$37, indicating strong past market participation.
Very low volume between $29–$30, creating a volume void — if price loses support at the FVG and golden pocket, it could rapidly drop into the demand zone.
🔻 OBV Analysis (Volume Momentum)
OBV has broken below a larger rising wedge, confirming bearish divergence.
A falling wedge is now forming within OBV.
Break below this wedge: Confirms further price breakdown.
Reclaim of the larger wedge trendline: Suggests potential bullish reversal.
✅ Trade Scenarios
🔺 Bullish Scenario
Trigger: Bullish reversal pattern at the golden pocket (e.g., double bottom, falling wedge, inverse H&S) + OBV recovery.
Entry: Upon confirmation around $32.5.
Targets:
$34.9 (FVG)
$36.6 (FVG)
$37.8 (FVG)
$40.0 (psychological)
Stop: Below $30 or recent swing low (tight below FVG).
🔻 Bearish Scenario
Trigger : Confirmed breakdown of golden pocket & 4H FVG with OBV falling wedge breakdown.
Entry : Below $32.5 with confirmation (e.g., retest or strong momentum candle).
Targets:
$30.0 (psychological level)
$28.5 (FVG zone)
$26.3 → $24.4 (Demand zone)
Stop : Above golden pocket resistance (~$33.8–$34.2).
📝 Conclusion: The market is at a pivotal point. A confirmed break below $32.5 could accelerate selling due to the volume gap, while a strong bullish reaction from the golden pocket could drive a recovery toward $40. Always wait for confirmation before entering either scenario.

Gold price trend and market analysis
Gold price performance
Spot gold remained stable at $3,368.68/oz on Friday (June 21), the lowest level since June 12, and fell 1.8% this week. The settlement price of U.S. gold futures fell 0.7% to $3,385.70/oz.
Geopolitical factors
The market is concerned about the development of the situation in the Middle East. The U.S. government postponed its decision on whether to intervene in the Israel-Iran conflict and said it might support a ceasefire "depending on the situation." At the same time, the U.S. Treasury Department announced sanctions on Iranian-related entities and individuals, further exacerbating geopolitical tensions.
Federal Reserve policy impact
The Federal Reserve kept interest rates unchanged this week, but the dot plot showed that policymakers had differences on the path of rate cuts:
Seven officials supported maintaining interest rates until the end of the year;
The remaining 12 officials predicted 1-3 rate cuts (25 basis points each time) in 2025, with a median of two rate cuts.
Some officials believe that the trend of inflation falling is good, but tariff policies may bring uncertainty and need to adjust policies with caution.
Economic data and market expectations
The U.S. leading economic indicators fell for the sixth consecutive month in May, triggering a recession signal, but the agency expects the economy to grow moderately in 2025 (GDP growth rate of 1.6%).
A survey by the World Gold Council showed that central banks have strong demand for gold purchases, and 95% of respondents expect central banks to continue to increase their gold holdings in the next 12 months.
Institutional views
UBS: Central bank demand, political risks and a weak dollar support gold prices, with a target price of $3,500/ounce at the end of the year.
Citi: Gold prices are expected to fall back to $2,500-2,700/ounce in the second half of 2026 due to weakening investment demand and adjustments to the Fed's policies.
Technical analysis
Gold prices may test the daily Bollinger Band middle track support level of $3,330/ounce next week.
Focus next week
The development of the situation in the Middle East and Iran's response to sanctions;
Speech by Fed officials and changes in policy expectations;
Economic data verifies recession signals.

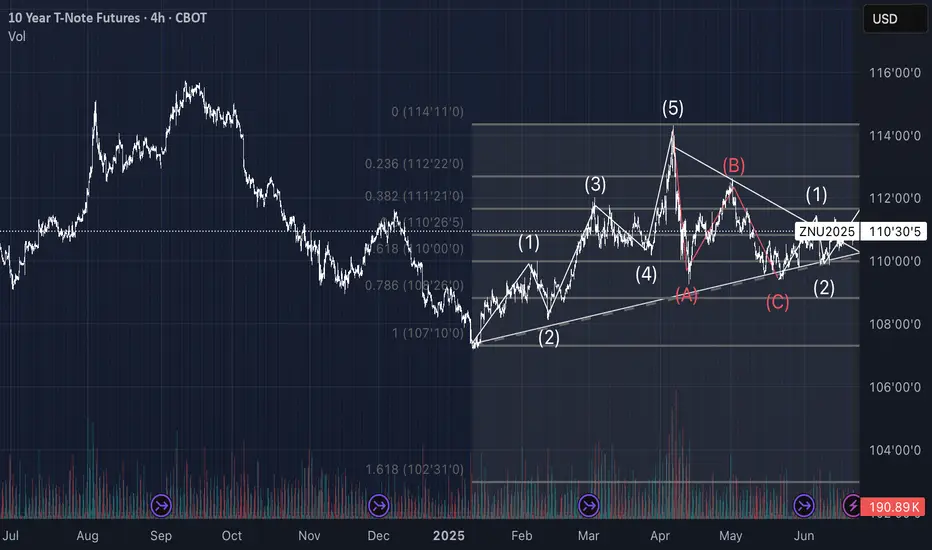
10 - NotesTechnical analysis of 10Y T-Note Futures (ZN1!) on 4H timeframe
Elliott Wave count with Fibonacci retracements and completed A-B-C corrective structure. Currently observing potential start of new impulsive wave (1)-(2). Breakout from descending triangle confirmed above dynamic support. Monitoring for further bullish continuation or validation of larger corrective structure.
SEI/USDT – Bullish Breakout Setup!SEI consolidates in a classic ascending triangle, showing a strong structure with higher lows and flat resistance.
A breakout above ~$0.225 could trigger a move toward higher targets.
Key Levels:
Support: $0.2142 (triangle base)
Resistance: $0.2257 (breakout level)
Stoploss: Below $0.214 (invalidation of structure)
Targets on Breakout:
TP1: $0.2514
TP2: $0.2724
RSI is climbing from mid-range with a bullish crossover, indicating strengthening momentum.
Structure looks favorable as long as support holds. Wait for volume confirmation on breakout for higher probability.
Not financial advice. Do your own research before investing (DYOR).

CHECK GBPJPY SIGNAL READ CAPTAINgbpjpy sell now ✅
entry point (196.500) (196.600)
TAKE PROFIT 1: (196.100)
TAKE PROFIT 2: (195.700)
LAST TARGET(195.200)
STOP LOSS (197.000)

Weekly crude oil chart shows continued bullish outlook.Last week's candlestick chart closed with a strong bullish candle at the channel's upper boundary. This week's close formed a pin bar.
Two consecutive weeks of candlestick patterns.Creating a Harami pattern
Strong bullish signals
Patiently observe market developments.

AUDCAD Will Move Lower! Short!
Please, check our technical outlook for AUDCAD.
Time Frame: 9h
Current Trend: Bearish
Sentiment: Overbought (based on 7-period RSI)
Forecast: Bearish
The price is testing a key resistance 0.885.
Taking into consideration the current market trend & overbought RSI, chances will be high to see a bearish movement to the downside at least to 0.879 level.
P.S
The term oversold refers to a condition where an asset has traded lower in price and has the potential for a price bounce.
Overbought refers to market scenarios where the instrument is traded considerably higher than its fair value. Overvaluation is caused by market sentiments when there is positive news.
Disclosure: I am part of Trade Nation's Influencer program and receive a monthly fee for using their TradingView charts in my analysis.
Like and subscribe and comment my ideas if you enjoy them!

Gold sell target Guys, I have given a sale target, don't miss it and keep the up trade on hold until the last

btc chipping down de road This is de rasshole fractal—the fractal from the future, the one whispered through the blockchain by quantum echoes of bull runs past, the one that knows, that sees, that is. It bends time, folds sentiment, loops liquidity through dimensions you haven’t even leveraged yet. It doesn’t care about your indicators, your trendlines, your cousin’s TA on Reddit—it just exists, pulsing with the inevitable. You can squint at it, laugh at it, ignore it—but it’s already printed, already fulfilled, already written in the candlesticks of destiny. Don’t try to understand it. Just feel it. Because the fractal knows: the price is going up. Did you buy the dip, or are you still refreshing?

btcusd two weeks trump time scale bearishTrump TACO time scale two weeks looks reasonable time scale
2W candle of #Bitcoin closing this weekend.
If CRYPTOCAP:BTC will not hold the 104000 - game over we visit margin call level of Saylor's Strategy 60 000 and most possibly lower 30 000

**Gold Eyeing Breakout Above Channel for 3,440 Target**This chart shows Gold (XAU/USD) price movement on the 1-hour timeframe and presents a clear analysis of recent trends and potential future moves.
🔍 Chart Description:
Uptrend Channel (Left Side):
Price was moving upward in a bullish channel (highlighted in blue and red).
The orange circles mark bounce points where price touched the lower trendline and moved up — confirming trend strength.
Breakout Above Channel:
Price broke out above the uptrend channel, making a strong bullish move toward the resistance zone near 3,440 (red box).
The top orange circle marks the rejection at resistance.
Downtrend Channel (Right Side):
After rejection at resistance, price began to fall inside a downward-sloping channel.
The price is currently trading near 3,367, trying to break above this bearish channel.
Key Levels:
Resistance Area: ~3,440
Breakout Target Level: 3,399.420
If price breaks above 3,399, the chart suggests a possible rally back toward 3,440.
✅ Summary:
Price may rise again if it breaks above the current downtrend channel and clears 3,399. If successful, it could retest the previous resistance around 3,440.
Let me know if you also want a short post or title for your channel.

XAU/USD 2h chart pattern.I'm provided for XAUUSD (Gold Spot / U.S. Dollar) on the 2-hour timeframe, here's the analysis:
---
📉 Chart Pattern Insight
A clear ascending channel was forming.
Price broke below the lower trendline (highlighted in orange), signaling a potential bearish breakdown.
The price is currently retesting the broken trendline and starting to reject it — a bearish sign.
---
🎯 Target Levels Identified on Chart
You’ve marked two bearish targets with arrows:
1. First Target: Around $3,280
This aligns with a previous minor support area.
A reasonable short-term target after the trendline break.
2. Second (Deeper) Target: Around $3,245
Likely based on the full height of the channel projected downward (measured move).
This level could be the next major support.
---
📌 Summary:
Target Price Level Confidence
First Target ~$3,280 Medium-High
Final Target ~$3,245 Medium
---
Let me know if you'd like help setting stop-loss levels, trade management tips, or a risk-reward calculation based on your entry.

btc short setupSL 10500
tp 102500
with ongoing world events and liquidations available at that range, its very much possible that bitcoin will and must tap 102 or lower for a creating fear and wiping retailers out. But short with caution might give fake outs to trap longs.
thanks
EURUSD ,4H CHART PATTERN EUR/USD is currently retesting the previous breakout zone around 1.14679 after a strong bullish impulse. Price has respected the demand zone (highlighted grey), indicating potential for continuation to the upside. If bullish momentum sustains, next target lies at 1.18044."
Suggested Short Title:
"EURUSD Bullish Continuation Setup"
Tags to use:
#EURUSD #Forex #SmartMoney #PriceAction #TradingSetup #BullishBreakout #ForexAnalysis

AUDUSD Analysis – Falling from the Rising WedgeAUDUSD pair broke below an ascending wedge, a bearish reversal pattern.
Clean rejection from 0.6518, with lower highs and new lower lows confirming bearish momentum.
Price is now sitting below former trendline support, retested and respected as resistance.
Bearish target points toward 0.6400–0.6380 zone, aligning with recent swing lows.
Risk invalidation sits above 0.6520, where structure fails.
Technical Bias: Bearish
Target: 0.6400
Stop-loss zone: Above 0.6520
📊 Current Bias: Bearish
🔍 Key Fundamentals Driving AUDUSD
AUD Fundamentals (Weakening):
Australian jobs data was mixed, and wage growth has plateaued.
RBA remains cautious, with expectations for rate cuts later in 2025.
AUD pressured by China growth risks and weak commodity demand.
Geopolitical drag: Australia-China tensions and weak Chinese retail data from 618 Festival dampen AUD outlook.
USD Fundamentals (Resilient):
USD remains bid on risk-off flows, especially after weak global data and ongoing Middle East tensions.
Fed remains reluctant to cut fast despite disinflation signs – supports the USD.
US data is mixed, but rate cut odds are declining (only one expected in 2025 now per dot plot).
⚠️ Risks to This Bearish View
If China announces new stimulus, AUD could rebound sharply.
A dovish surprise from the Fed (e.g. Powell softening in speeches).
Sharp rebound in risk appetite (e.g. tech-led equity rally).
🗓️ Important Events to Watch
🇨🇳 China industrial profits & PMIs
🇦🇺 RBA Meeting Minutes (July preview hints)
🇺🇸 US Core PCE (June 28)
Global risk tone: watch metals, equities, and geopolitical headlines.
🚀 Which Asset Leads?
AUDUSD is lagging other USD pairs, but will likely lead commodity FX downside if China or metals weaken further.
Watch AUDJPY and EURAUD for further confirmation of risk-off flows and Aussie weakness.

EUR/USD 1H FLAG CHART PATTERNEUR/AUD 1H (Euro/Australian Dollar), MY analyzing a bullish flag chart pattern, which is a continuation pattern following a strong uptrend. The price has broken out of the flag to the upside, indicating a potential continuation of the bullish move.
📈 Targets Based on the Chart:
1. First Resistance / Target 1:
Price Level: Around 1.78500
2. Second Resistance / Target 2:
Price Level: Around 1.79500
These levels are clearly marked on your chart with arrows pointing upward, showing expected upward movement after the breakout.
✅ Trade Idea Summary:
Pattern: Bullish Flag
Breakout Direction: Upward
Entry Suggestion: On breakout above flag resistance (already occurred)
TP1: 1.7850
TP2: 1.7950
SL (Suggested): Below 1.7730 (previous low or support zone)
Let me know if you want a complete trade setup (entry, SL, TP, risk/reward).

Middle East Tension & Markets: My Honest Stance🌍🕊️✌️ Middle East Tension & Markets: My Honest Stance 💣 🔥 🗡️
Hi everyone,
It’s Friday, June 20th — and we face a fragile moment: the uncertainty of possible US military action against Iran. 📉📰✈️
On my charts:
Bitcoin (BTC) reached key resistance and now ranges sideways as we await clarity.
Gold (XAUUSD) remains the classic safe haven — it holds an ascending structure, but profit-taking could trigger dips if markets crash.
Silver (XAGUSD) is similar, yet needs broader industrial strength to outperform gold.
Crude Oil (WTI) could spike dramatically if bombs fall — but I choose not to profit from pain.
USDJPY & USD pairs reflect global trust in the dollar and US stability — I’ll cover this more next week.
My personal stance is simple:
💙 I never short disasters. I never profit from human suffering. I am LONG on humanity and peace. 🕊️✌️🌈
👉 I expect potential market gaps between now and Monday:
✅ Bad news (war) → gold, silver, oil likely pump
✅ Good news (diplomacy) → risk assets rebound, oil stabilizes
I am positioned carefully with small risk and clear stops. My goal: protect my capital, trade my plan, but never bet on pain. If I lose because peace prevails — I win as a human.
Stay safe, trade wisely, and never forget: sometimes the best trade is no trade at all.
One Love,
The FXPROFESSOR 💙
Disclosure: I am happy to be part of the Trade Nation's Influencer program and receive a monthly fee for using their TradingView charts in my analysis. Awesome broker, where the trader really comes first! 🌟🤝📈

EURNZD: Bearish Setup in Play?EURNZD Faces Resistance Within Defined Range – Bearish Setup in Play?
EURNZD appears to be forming a range-bound trading structure, with key levels defined between 1.9050 and 1.9230.
Yesterday, price action tested the upper boundary at 1.9230, where it encountered strong resistance.
If the pair fails to break above this level and sustains trading below it, bearish momentum could build throughout the day.
While the setup carries some risk due to the range environment, it offers potential for downside movement.
Intraday targets: 1.9150; 1.9100 ; 1.9050
You may find more details in the chart!
Thank you and Good Luck!
❤️PS: Please support with a like or comment if you find this analysis useful for your trading day❤️
Disclosure: I am part of Trade Nation's Influencer program and receive a monthly fee for using their TradingView charts in my analysis.

USD/JPY 4H Chart Analysis – Bullish Breakout Ahead?📈 USD/JPY 4H Chart Analysis – Bullish Breakout Ahead? 🚀💹
The USD/JPY pair is currently approaching a critical resistance zone (145.800 - 146.000), which has acted as a strong supply area in the past. The price has shown bullish momentum as it builds higher lows and heads toward this resistance.
🔍 Key Observations:
🔵 Resistance Zone: Clearly marked and tested multiple times. A breakout above this level could trigger a bullish continuation.
📊 Bullish Structure: The pair is forming a strong uptrend with higher highs and higher lows on the 4H timeframe.
🔄 Retest Scenario: Chart suggests a potential breakout above the resistance, followed by a bullish retest before continuing toward the target zone at ~148.900.
🟢 Upside Target: 148.900 (Previous swing high) – a potential gain of over 300 pips from breakout point.
📌 Trading Outlook:
✅ A confirmed breakout and retest of the resistance zone could offer a high-probability long setup.
❌ A failure to break and hold above the resistance may result in short-term consolidation or reversal.
📅 Watch Levels:
Resistance: 145.800 – 146.000
Support (breakout retest): 145.200 – 145.500
Bullish Target: 148.900
📢 Conclusion: Bulls are in control as long as price sustains above the resistance zone. A clean breakout followed by a retest could offer an attractive buying opportunity with a well-defined risk-to-reward setup. 🔥📊

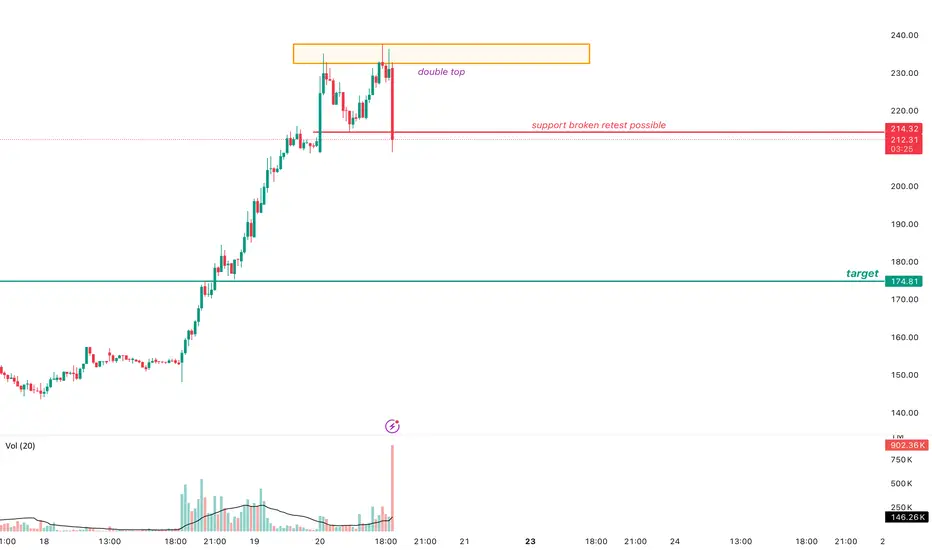
CRCL LOOKS OVERBOUGHTAs you can see after a good ride from 102 to 234 now the stock looks overbought. and on shorter time frames the price action shows a classic pattern of double top and breaking the previous support. simply if the stock closes 15 m candle below the support you might see a short retest to the support from downside that is a good point to short.
USDCAD Analysis – Breaking the Chains, Eyeing 1.38+USDCAD Price broke out from a long descending channel, followed by two bullish continuation flags – classic breakout-retest pattern.
Price is now pushing above 1.3720, aligning with the 38.2% Fib level of the prior drop.
Next upside targets:
🔹 1.3833 (Fib 61.8%)
🔹 1.3913 (Fib 78.6%)
Clear stop level: below 1.3625 (channel breakout support)
Structure Bias: Bullish continuation. Clean breakout + consolidation = probable impulse toward 1.3830/1.39.
📊 Current Bias: Bullish
🔍 Key Fundamentals Driving USDCAD
USD Drivers (Neutral to Bullish):
Fed held rates, dot plot shows only 1 cut in 2025, but Powell's tone leaned dovish.
US Retail Sales + PPI were weak, but safe-haven USD demand persists due to geopolitical risks and equity volatility.
Market reassessing Trump election risk, Fed independence, and inflation stickiness.
CAD Drivers (Bearish):
Oil prices are volatile due to Middle East tensions, but weak demand caps upside.
Canada’s CPI softened, BoC already delivered a dovish cut earlier this month.
CAD under pressure due to dovish BoC outlook and fiscal concerns (gov't budget deficits expanding).
CAD is also suffering from reduced foreign investment flows.
⚠️ Risks to Watch
Oil price spikes (especially if Strait of Hormuz risk escalates) may boost CAD short-term.
A sharp reversal in DXY or Fed commentary shift toward aggressive easing.
Weak US data next week (Core PCE especially) could unwind USD momentum.
🗓️ Upcoming Events to Watch
US Core PCE (June 28) – critical inflation gauge for the Fed
BoC Business Outlook Survey
Oil Inventories + Global energy sentiment
Geopolitical: Israel–Iran updates and Canada’s fiscal signals
🏁 Which Pair Leads the Move?
USDCAD is leading commodity crosses as CAD weakness broadens. Watch USDCAD and GBPCAD for signs of CAD softness before others like AUDCAD/NZDCAD follow.

The shift from safe-haven attributes to monetary policy driven!The long-short game of gold prices intensified, the Fed's hawkish signals and the strengthening of the US dollar put pressure on gold prices, and the geopolitical risk premium and inflation expectations formed support. In the short term, the escalation of the Israel-Iran conflict may promote safe-haven buying, but the Fed's policy path and the actual implementation of trade policies will dominate the medium- and long-term trends. Focus on the US policy trends towards Iran, the progress of the Iran nuclear agreement negotiations, and the Fed's inflation response stance in the next two weeks. It is necessary to pay attention to the game between Iran's warnings on third-party intervention and the potential risks of possible US intervention. This uncertainty provides phased support for gold prices.
The intraday trading strategy of gold this trading day, the range and the break need to be paid attention to simultaneously. The current bearish trend continues, the 3385 resistance in the Asian session is effective, and the rebound relies on the 3360-3365 suppression to maintain the high-altitude strategy, and the support below is the 3330-3320 area. Against the background of the continuous downward shift of the center of gravity, 3375-3385 constitutes a short-term key suppression. Before the breakthrough, I suggest maintaining a bearish mindset. Resistance range 3375-3385, support range 3330-3320.
It is recommended to buy gold near 3347 during the day, and take profits in the target range of 3360-3400!
Gold rebounds to the 3360-3365 area and sells. If it breaks through 3365, you can consider covering your position in the resistance area of 3375-3385 and continue to sell. The target is 3340-3320!
