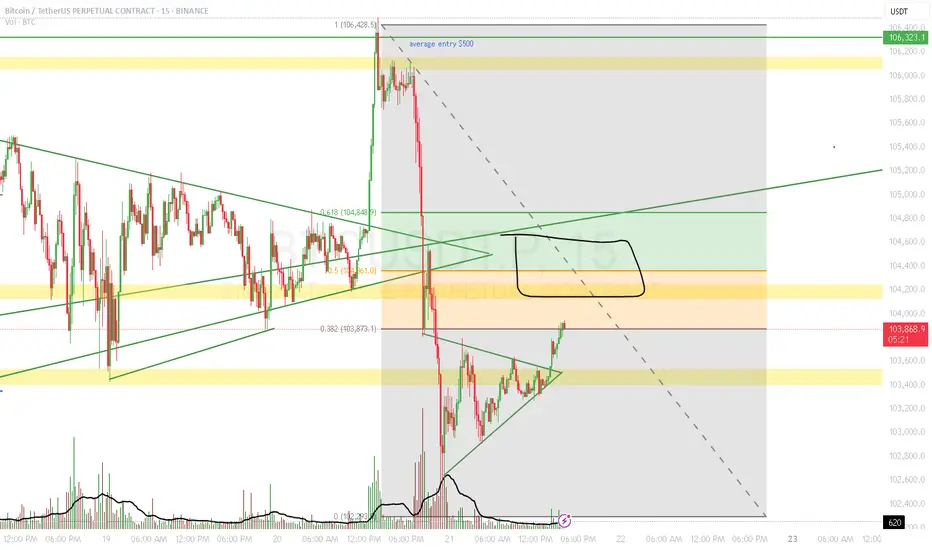
BTCI believe Bitcoin is heading toward the upside targets. There are two buying zones; we are currently at the first zone, with another buying zone below it. You can split your entry between these two zones."
Chart Patterns

FLOKI Correction done?The Price has reached Weekly1 support and a lot of stop-losses have been liquiditated(orange lines). There is one more major insufficient area FVG3 (Fair Value Gap) remaining and some stop-losses to take out around 0.00006568 price. This is very high probability buy-side liquidity area providing very good entry point inside FVG3. The price might also bounce from the current levels without visiting these lower levels but I personally would feel a lot safer with a liquidity sweep bounce from a FVG. Current ~44% correction from the previous highs is decent but further correction into the FVG3 levels would bring it to ~50% beeing not that uncommon scenario with alts. Either way, the direction is up. Way UP!

bitcoin update price broke the symmetrical triangle and moving up slow
but this false pump wont last long.
price just going to tap the fib level of 0.5 to 0.618 and might go a bit up just to trap longs.
i personally will enter short once we tap and reject 0.618.
thanks
FIL 1D – Strategic DCA OpportunityPrice bounced off the $2.20 level with rising volume.
Momentum slowdown shows in narrowing MACD histogram.
We see potential bottom formation after a heavy flush.
EMA50 and EMA100 remain overhead but flattening.
Early signs of seller exhaustion below the $2.30 mark.
Perfect zone for strategic DCA – asymmetry is shifting.
Quant view: reward/risk skew turning favorable for long exposure.
Patience now = positioning for upside convexity.
Stay tactical. Stay data-driven.

GBPCHF Is Bearish! Sell!
Here is our detailed technical review for GBPCHF.
Time Frame: 4h
Current Trend: Bearish
Sentiment: Overbought (based on 7-period RSI)
Forecast: Bearish
The market is trading around a solid horizontal structure 1.100.
The above observations make me that the market will inevitably achieve 1.091 level.
P.S
We determine oversold/overbought condition with RSI indicator.
When it drops below 30 - the market is considered to be oversold.
When it bounces above 70 - the market is considered to be overbought.
Disclosure: I am part of Trade Nation's Influencer program and receive a monthly fee for using their TradingView charts in my analysis.
Like and subscribe and comment my ideas if you enjoy them!

USOIL BEST PLACE TO SELL FROM|SHORT
USOIL SIGNAL
Trade Direction: short
Entry Level: 73.94
Target Level: 72.14
Stop Loss: 75.12
RISK PROFILE
Risk level: medium
Suggested risk: 1%
Timeframe: 2h
Disclosure: I am part of Trade Nation's Influencer program and receive a monthly fee for using their TradingView charts in my analysis.
✅LIKE AND COMMENT MY IDEAS✅

GOLD H4 Chart Weekly Update For 23 - 27 June 25Hello Traders,
welcome to the weekly update, as you can see that market was in range last week
as for now 3400 Psychological remains in focus if market breaks 3400 successfully the GOLD will rise towards 3440
only breaks below 3330 GOLD will leads towards 3250 possibly
FED Chair Powell Testifies due in the upcoming week
USPCE PRICE INDEX due on Friday
Disclaimer: Forex is Risky

GBP/CHF BEARS ARE STRONG HERE|SHORT
Hello, Friends!
GBP/CHF pair is trading in a local uptrend which we know by looking at the previous 1W candle which is green. On the 3H timeframe the pair is going up too. The pair is overbought because the price is close to the upper band of the BB indicator. So we are looking to sell the pair with the upper BB line acting as resistance. The next target is 1.094 area.
Disclosure: I am part of Trade Nation's Influencer program and receive a monthly fee for using their TradingView charts in my analysis.
✅LIKE AND COMMENT MY IDEAS✅

EUR/CHF SHORT FROM RESISTANCE
Hello, Friends!
We are going short on the EUR/CHF with the target of 0.938 level, because the pair is overbought and will soon hit the resistance line above. We deduced the overbought condition from the price being near to the upper BB band. However, we should use low risk here because the 1W TF is green and gives us a counter-signal.
Disclosure: I am part of Trade Nation's Influencer program and receive a monthly fee for using their TradingView charts in my analysis.
✅LIKE AND COMMENT MY IDEAS✅

NATGAS - New Potential Moves🔥 NATGAS – Major Move Loading 🔥
We’re sitting at a critical 4D Supply zone right now.
📌 If this level holds — expect rejection and a move back into lower liquidity zones.
📌 But if price breaks through this 4D supply, it opens the door to massive upside potential.
Either way, this is a high-impact level. Big moves are coming. Eyes locked. 👀
#NatGas #CommoditiesTrading #SmartMoney #SupplyDemand #PriceAction #TradingSetup #SwingTrade #ForexAnalysis #MarketStructure #LiquiditySweep

AMZN SHORT TRADE – JUNE 21, 2025 (NASDAQ|S&P 500| NASDADAQ 100) AMZN SHORT TRADE ANALYSIS (U.S STOCK)
AMZN previously traded in an uptrend, supported by a bullish trend line (marked in dotted black line). However, it broke down from this line in early March around $197. After retesting the breakdown line, the stock seems ready for a renewed downtrend.
Given the current technical setup, AMZN appears poised for a short sale trade. The stock's retest of the breakdown line suggests potential for further downside movement.
🚨 TECHNICAL SHORT SELL CALL – AMZN 🚨
Short Sell Levels:
Short Sell 1: $209.69 (Current Price)
Short Sell 2: $215.60
Short Sell 3: $220.00
Target Prices:
TP 1: $200.00
TP 2: $188.00
TP 3: $174.00
TP 4: $165.00
Stop Loss (Closing Basis): Above $224.00 | Risk Reward Ratio: 1:6.7
Caution:
Please short sell in 3 parts within the selling range. Close at least 50% of your position at TP1 and trail the stop loss to protect profits in case of unforeseen market conditions.

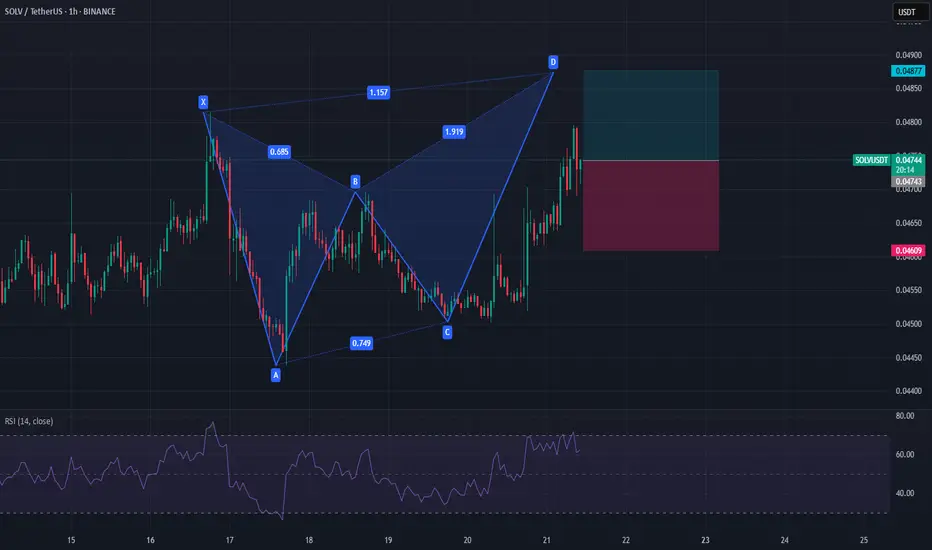
SOLVUSDTBullish Trend continuation expectation as there is no bearish divergence till now.
buying instantly
sl last ll
BESI will get back to 170Weekly chart displays a compelling case for further Bullish continuation, next middle-term target is 170:
- April was typical resistance = support price action, re-testing 22's High, 23's & 24's Low
- False Breakout below the symmetrical Triangle projects a measured move breaking out on the upside
- July' 24 (`170) was a Bear surprise, lots of scaling-in Bulls take profit and liquidate their longs. I'd expect sideways consolidation for many weekly bars
- If Bulls manage to break that ceiling, long-term 270 is feasible


Weekly Market Analysis
This is my Weekly Analysis for GBPUSD using volume profile, price action and ICT hybrid.


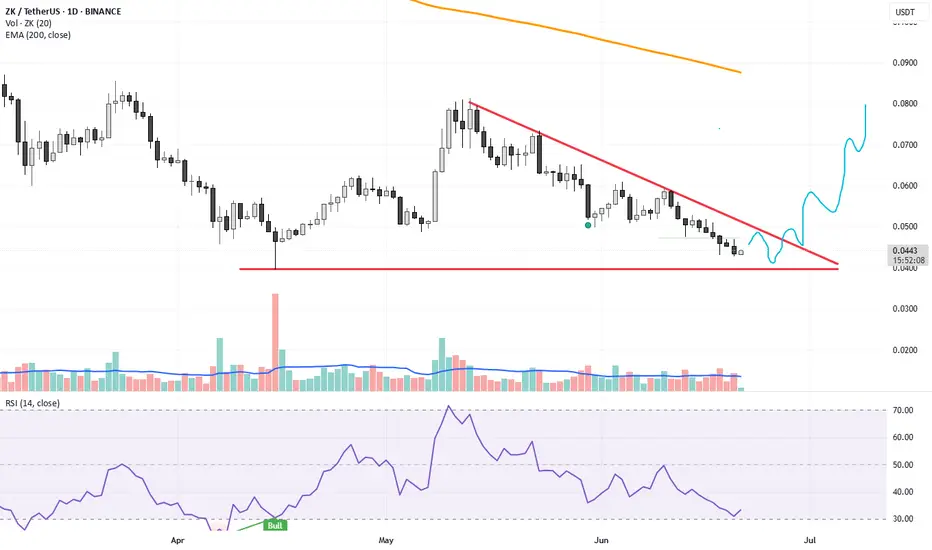
ZK USDTif zk broke the resistance upper red line
it will boost the price to get the big profit.
Don't buy now just keep eye on it.
wait for broke and retest the level again then enter into trade.
ASTM LONG TRADE 21-06-2025 (textile)ASTM LONG TRADE
ASTM stock has previously been in a trading range since April 2024 till February 2025. After marking a high of 18.2 rupees, it went into a corrective downward channel and posted a low of 10.6 rupees. Recently, it broke out of this downward channel with required support from volume spread. After the breakout, it completed its pullback and seems ready for its new uptrend.
🚨 TECHNICAL BUY CALL – ASTM🚨
Buy 1: 14.06 rupees
Buy 2: 13.06 rupees
Buy 3: 12.06 rupees
Targets:
TP 1: 16.09 rupees
TP 2: 18.15 rupees
TP 3: 19.9 rupees
TP 4: 22.6 rupees
TP 5: 25.6 rupees
Stop Loss: Below 10.6 rupees
Risk Reward Ratio: 5.8
Caution: Please buy in 3 parts within the buying range. Close at least 50% of your position at TP1 and trail the stop loss to protect profits in case of unforeseen market conditions.
📢 Disclaimer: Do not copy or redistribute signals without prior consent or proper credit to The Chart Alchemist (TCA).
If you find this idea helpful, please boost and share it!

Price action Eurusd mad a new lower low signaling a continuation to down side broke structure below after rejection on fair value gap it's currently looking bullish for now

btc short now you have a very clear view of whats gonna happen
101k is inevitable. And if 101 dosent hold, 98 will be our balance point where market will go for making lower high and if price action changes we can go for a new ATH, which i guess will be our final ATH before we drop for a fresh new bear cycle.
thanks

NAVA LtdNava Ltd
RSI Based Strategy
Daily Chart RSI taken support @ 60
Weekly / Monthly RSI above 60
Support 538
Resistance 573
1. There is also VCP pattern
2. Flag Pattern (support 9 EMA then high cross upside
3. Long leg candle also closed above 559

Here Comes the Best time to Accumulate $NASDAQ:AAPL ! NASDAQ:AAPL
TIme To Get into it.
Try to accumulate the Stock at level between 190- Current price
Growth is Inevitable.
Nasdaq is Out Smarting the Eleites.
