Gold weekend review Gold ended a choppy week on a hopeful note, surging during the New York opening after Fed Governor Christopher Waller's comments hinted at a potential rate cut as early as July. However, most policymakers favor a wait-and-see approach, suggesting a possible delay until September. Meanwhile, escalating Middle East tensions could boost gold's appeal. Technically, gold's higher timeframe remains bullish, but the 1-hour chart shows a bearish correction to the $3,340 support. We'll monitor the market's opening closely. If gold stabilizes above $3,368, it could target $3,405, $3,425, or even $3,450. Conversely, a decline could lead to $3,333, $3,320, or $3,308.
Chart Patterns

CHECK XAUUSD SIGNAL READ CAPTAINxauusd buy now ✅
entry point (3369) (3367)
TAKE PROFIT 1: (3375)
TAKE PROFIT 2: (3386)
LAST TARGET(3395)
STOP LOSS (3360)

Price action DXY I failed to make a new lower currently bullish yet what it needs is a new low higher to complete the structure the we can start looking for longs

TONUSDT: Short the Rejection,Buy the Capitulation – A Dual-Level
📉 TONUSDT Technical Analysis – Trending in a Long-Term Descending Channel, Is the Ideal Short Entry Coming?
TONUSDT is currently trading inside a long-term descending channel, with clear bearish momentum dominating the structure.
🔻 Scenario 1 (Early & Risky Entry):
Traders may consider opening a short position from the current level, but this setup carries higher risk, as the price could still push upward toward the upper boundary of the channel.
Stop-loss level is clearly marked on the chart.
🧭 Scenario 2 (Smarter, Low-Risk Entry):
A more calculated approach is to wait for the price to revisit the upper resistance zone of the descending channel (marked as Entry 1 on the chart).
This zone offers a clean low-risk, high-reward short opportunity, with a tight stop-loss and excellent setup.
🎯 Defined Targets in This Analysis:
Target 1: The midline of the descending channel
Target 2: The bottom of the long-term descending channel
💎 Important Insight:
If this bearish scenario completes and the price reaches the bottom of the descending channel, that zone could be a prime buying opportunity for long-term holders.
Technically, it's a major support level and psychologically, it's where smart money often steps in.
⚠️ Disclaimer:
This is not financial advice. This analysis is for educational purposes only. Always wait for confirmation and apply strict risk management when trading.
📩 What’s your opinion on this setup? Do you agree with the short plan, or see another scenario unfolding? 👇

GBPCHF shortGBPCHF has formed a HNS pattern at H4. Followed by rejected price recent from a drawn trendline, I foresee price will continue dropping, broken down the lower trendline until reach the size of the HNS 1:1.

Short NZDUSDNZDUSD has broken the wedges drawn in H4. In technical analysis, we projected price will approaching to the equidistant channel drawn from the upper wedges line there.

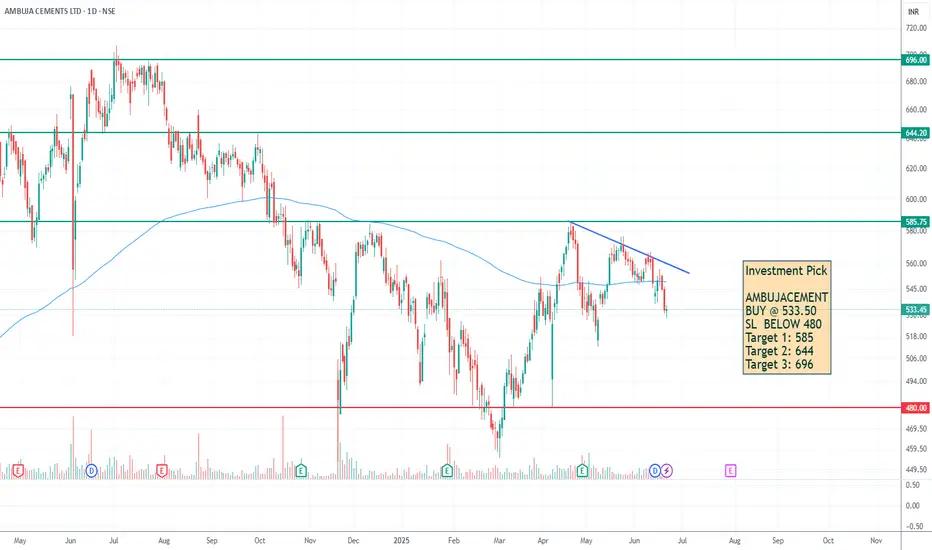
AMBUJA CEMENT - Target 1: 585, Target 2: 644, Target 3: 696Investment Pick
AMBUJACEMENT
BUY @ 533.50
SL BELOW 480
Target 1: 585
Target 2: 644
Target 3: 696
Note: This is for educational purposes. consult your advisor before investing

$AVGO above its previous ATH and holding on. 400 $ reachable. The poster child of the AI rally has been NASDAQ:NVDA and $AVGO. Here we have analysed both the stocks multiple times fundamentally and technically. But the lesser known NASDAQ:AVGO has performed better than the NASDAQ:NVDA since the April lows. NASDAQ:AVGO is still above its previous ATH and closed above yesterday which was 242 $ in Jan 2025. NASDAQ:NVDA is still below its Jan 2025 highs of 152 $.
The Semis index NASDAQ:SMH is also 6.3% below its ATH of 262 $. So not many stocks in this index have a more bullish chart than $AVGO. My assessment is that NASDAQ:AVGO will continue its dominant outperformance in the NASDAQ:SMH sector in comparison to others like $NVDA.
Going back to technical and plotting the Fib Extension levels form the last bull run before Aug 2024 we can see that the next possible near-term target is 275 $, a 10% upside form here and in the medium term the target is 400 $.
Verdict : Long NASDAQ:AVGO over NASDAQ:SMH and $NVDA. First Target 275 $ then we go to 400 $.

The Best Trading Strategy For 2025In this video you will see:
-The double top pattern
-The long lower shadow pattern
-The morning star
Now as you watch this video remember
to understand the following:
-The Rocket Booster Strategy
-The Reversal Strategy
-Candle Stick Patterns
Understanding these Top 3 Things
will help you digest this video very well.
Rocket boost this content to learn more.
Disclaimer:Trading is risky please use a simulation
trading account before you
trade with real money.Also learn risk management
and profit taking strategies.
Do not use margin.

$FARTCOIN - $1 Bearish Retest MEXC:FARTCOINUSDT | 1D
Just a quick update:
Fartcoin hit our LTF support at 0.88 and is holding so far.
If CRYPTOCAP:BTC can stay above 103k–102.7k, we could see a retest of $1
From there, we'll see if we're going to revisit the HTF demand at 0.64–0.50

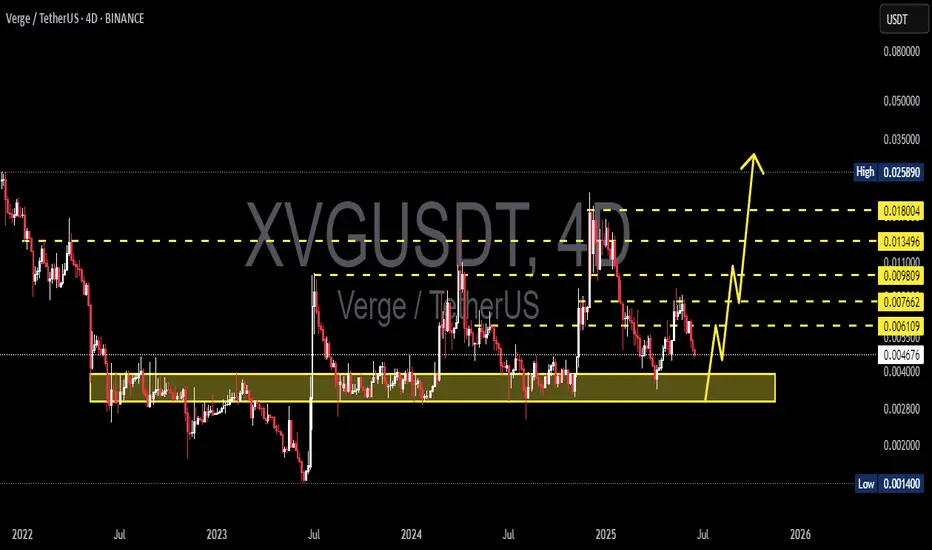
XVGUSDT 4D AnalysisXVG ~ 4D Analysis
#XVG Buy back on retest of this support block with short term target of at least 20%+ from this support.
MYROUSDT 2D AnalysisMYRO ~ 2D Analysis
#MYRO Buy back on retest of this support block with short term target of at least 20%+ from this support.

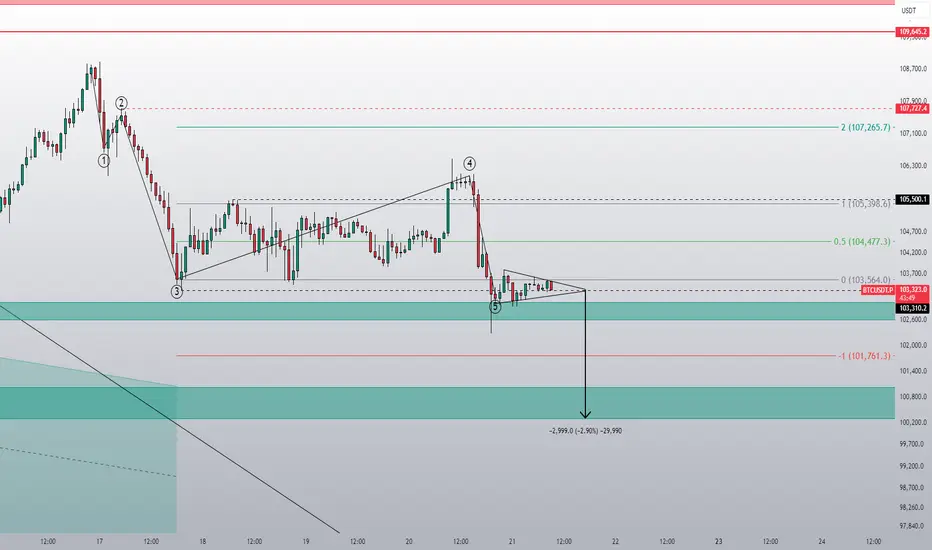
$BTC - Protected LowBINANCE:BTCUSDT | 1D
Price got strongly rejected at 106.5k
It deviated below the 4-hour mini-range. We now need to see a reclaim of 105–105.1k. If not, a retest of the value area low at 101.4k is likely.
100k remains to be the protected low, and it would be critical if we won't get a valid retest at 101.4k
local resistance: 105-105.5k
local support: 101.4k
protected low: 100k

STXUSDT 1W Analysis STX ~ 1W Analysis
#STX Buy back gradually from here with a short-term target of at least 20%++.

METISUSDT 1W AnalysisMETIS ~ 1W Analysis
#METIS Buy back gradually from here if you still have confidence in this coin with a short term target of at least 20%+ from here.

ARUSDT 5D AnalysisAR ~ 5D Analysis
#AR This is the lowest support for now. Buy back from here with a short term target of at least 15%++ from this support.

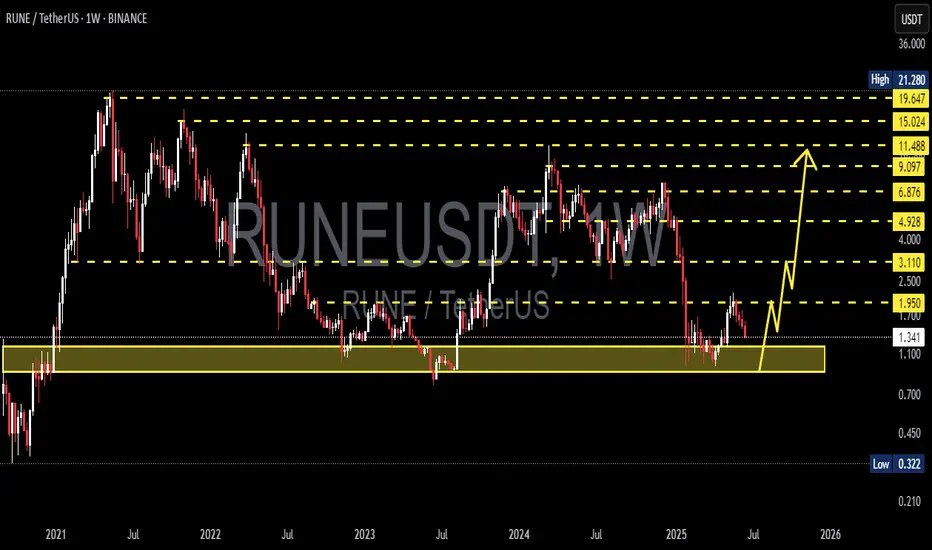
RUNEUSDT 1W AnalysisRUNE ~ 1W Analysis
#RUNE Buy back gradually from here with a short term target of at least 20%+ from this support block.
GBPUSDFor this pair my bias is leaning to the sellers making there way into the market for the upcoming week june 23-june 27 week ahead we have several news factors that could affect the market also the on going war in the middle east

Litecoin:Is the main climb coming?hello friends👋
As you can see, the price, after falling in the support area specified by the buyers, has been supported and returned, forming an upward pattern.
Now we don't enter into a transaction with just one pattern, we also check the entry of buyers and the amount of currency and other factors and draw conclusions.
According to the points we have said, we have identified very important support points for you to buy step by step with capital and risk management and move to the specified goals.
🔥Follow us for more signals 🔥
*Trade with us safely*

$SEI - Long Trade IdeaBINANCE:SEIUSDT is showing relative strength despite the dump
If CRYPTOCAP:BTC holds above 103k–102.7k, I’m looking for a move toward 0.27–0.32 (initial target)
Entry: .22-.20
Stoploss: Below .175
Targets:
.27 - .32
.36 - .38
.42 - .44

Solana:Daily free signalhello friends👋
As you can see, after the drop that we had, insider buyers showed and were able to support the price well.
But it was not enough, and as you can see, a noisy pattern has formed, which can indicate a further decrease in the price.
Now we can take advantage of this opportunity and make step-by-step purchases with risk and capital management in the support areas that we have obtained for you and move to the specified goals.
🔥Follow us for more signals🔥
*Trade safely with us*
