BTC Squeezed to the Edge – Will $102K Support Hold or Crack?Bitcoin is pressing into the apex of a descending triangle, anchored at $102K. Volume is drying up, EMAs are compressing, and liquidity pools sit just below. This structure rarely resolves quietly — a volatile breakout is imminent.
🔻 Bearish Case (Primary Bias):
Breakdown below $102K = short trigger
Targets: $98K → $94K
Stop: Above $106K
Confluence: Bearish pattern + volume dry-up + liquidity below
🟢 Bullish Reversal (Alternate):
Breakout above $107.5K = short squeeze likely
Flip bias only if trendline is reclaimed on volume
🎯 Final Take:
BTC is at a decision point. Don’t trade the bias — trade the breakout. Volatility is coming. Be ready.
📣 What’s your setup? Breakdown or fakeout rally? Share below!
Chart Patterns

NVDA might want to check this out.Been on a great run... whatever it's holding on to looks like it's about to break. So much negative divergence.

Technical Zones & StructureTechnical Zones & Structure
🔹 Bearish Rejection Zone (Supply Area)
Price tapped into a strong supply zone at the top blue box, aligning with trendline resistance.
Immediate reaction followed by sharp bearish candle shows potential liquidity grab and smart money sell-off.
🔹 Demand Zone
Mid-chart gray/blue zone is a key reaction area that price may retest before confirming further downside.
Market Structure
I’ve drawn a rising wedge, which price has already broken down from = bearish reversal signal.
Pullback anticipated into the broken structure zone (gray) → potential entry zone for short.
Trade Idea (as visualized)
Sell Setup Plan:
✅ Ideal Entry: Retest of broken wedge / demand-turned-supply (~1.84750–1.84900)
🎯 Target 1: 1.84300 zone
🎯 Target 2: 1.83500 (bottom demand zone)
🛑 SL: Above previous high / upper blue supply (~1.85300+)
SET and FORGET

Bullish potential detected for HDNEntry conditions:
(i) breach of the upper confines of the Darvas box formation for ASX:HDN
- i.e.: above high of $1.31 of 9th May (most conservative entry), and
(ii) swing up of indicators such as DMI/RSI along with a test of prior level of resistance of $1.31 from 31st October 2022.
Stop loss for the trade (based upon the Darvas box formation) would be:
(i) below the support level from the low of 15th May (i.e.: below $1.24).

XAUUSD Update 21th June 2025After 1 week pull back, the price still find it support.
On the last Friday, it seems like bounce at 3339 support.
We need more further movement, and we'll see if 3339 hold as support, next target is 3440 level.
But if gold need more further correction, than 3320 is next support to retest.
Have a Good Luck !
#xauusd #Goldanalysist

Potential outside week and bullish potential for CQREntry conditions:
(i) higher share price for ASX:CQR above the level of the potential outside week noted on 6th June (i.e.: above the level of $4.10).
Stop loss for the trade would be:
(i) below the low of the outside week on 2nd June (i.e.: below $3.91), should the trade activate.


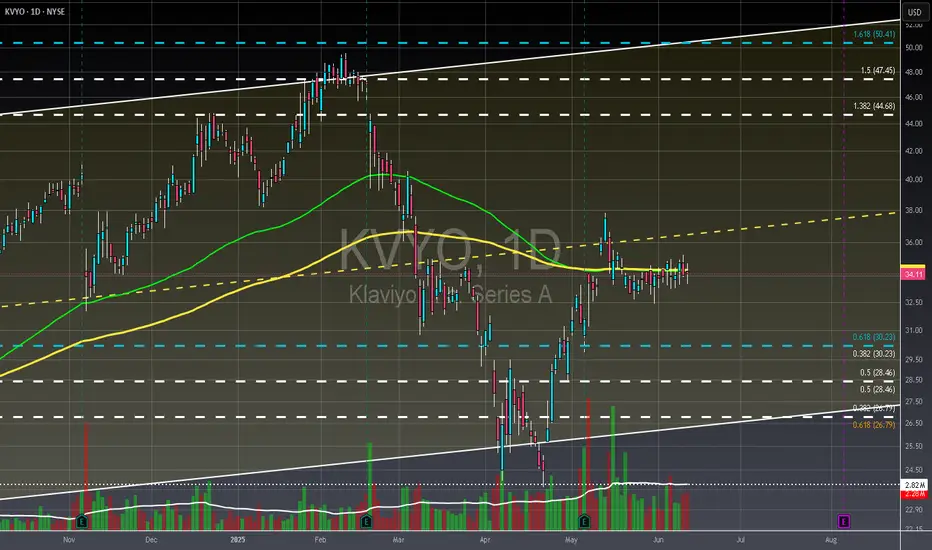
KVYO - Daily - Financial Health is PristineThis company, a Software as a Service (SaaS) marketing platform with a market capitalization of $9 billion, presents a compelling investment case. Its SaaS model inherently suggests lower overhead and a strong potential for sustained profitability, a track record this company has consistently demonstrated. Furthermore, the stock's short interest is currently at its lowest point in its history, indicating a lack of bearish sentiment. A price target between $45 and $60 appears entirely feasible given its robust financial health. While accumulation of the stock has been ongoing, it appears to have concluded around May 1, 2025, suggesting the market is now anticipating a trigger event to initiate a rally. The fact that prominent institutions like Vanguard and BlackRock are among its owners further reinforces confidence in its prospects.
Not financial advice, always do your due diligence
Leave a like👍 and/or comment💬.
We appreciate and value everyone's feedback!
- RoninAITrader

BTCUSD Sell Setup – 4H Chart AnalysisEntry Zone: 103,061
🔹 Stop Loss: 105,120 – 105,095
🎯 Targets:
• TP1: 100,913
• TP2: 98,886
• TP3: 96,967
🔻 Analysis Summary:
Price recently broke a key support zone and is currently retesting it. A clean bearish rejection from this level provides a high-probability short setup. With clear risk-to-reward levels defined, this trade targets the next key supports.
🛑 Risk Management: Always use stop loss and proper lot sizing.

NZDUSD My Opinion! BUY!
My dear subscribers,
My technical analysis for NZDUSD is below:
The price is coiling around a solid key level - 0.6015
Bias - Bullish
Technical Indicators: Pivot Points High anticipates a potential price reversal.
Super trend shows a clear buy, giving a perfect indicators' convergence.
Goal - 0.6043
My Stop Loss - 0.5999
About Used Indicators:
By the very nature of the supertrend indicator, it offers firm support and resistance levels for traders to enter and exit trades. Additionally, it also provides signals for setting stop losses
Disclosure: I am part of Trade Nation's Influencer program and receive a monthly fee for using their TradingView charts in my analysis.
———————————
WISH YOU ALL LUCK

GBPNZD: Partials Secured on Sell – Watching PRC for LongCaught the move off the descending trendline and 1H supply zone on GBPNZD. Original TP was set for 3R, but I took early partials around +60 pips to lock in some profit and reduce risk. SL was moved to breakeven — price retraced and took me out risk-free.
Now watching the PRC level (previous resistance turned support) for a trend continuation buy setup. Waiting for confirmation before entering long again.
Approach: Trend-based setup with key zones
Tools: EMA 9/20/50, PRC Zones, Trendlines
Style: Risk-managed swing entry with partial profits
Timeframe: 1H

XLM Stellar (XLM) Strategic Partnerships
Stellar boasts a strong network of partnerships with major financial and technology institutions, strengthening its position in cross-border payments and decentralized finance. Here are the most prominent of these partnerships and their impact:
1. Partnerships with Global Financial Institutions
- Mastercard: 🌟
Goal: Integrate Stellar technology into Mastercard Crypto Credit solutions to facilitate secure peer-to-peer transfers.
Impact: Promote acceptance of XLM in everyday transactions and expand its use among consumers.
- Franklin Templeton: 🌟
Goal: Use the Stellar network to manage the US Government's OnChain Fund (assets over $270 million).
Impact: Increase institutional confidence in Stellar as a transparent and low-cost asset management platform.
- MoneyGram: 🌟
Goal: Enable stablecoin transfers (such as USDC) across the Stellar network, while supporting cash withdrawals and deposits at MoneyGram branches globally.
Impact: Expanding financial services in developing regions, particularly Africa and Latin America.
2. Partnerships with technology and payment platforms
- Circle (USDC): 🤖
Goal: Issuing the USDC stablecoin on the Stellar network, enhancing network liquidity and facilitating cross-currency exchanges.
- IBM: 🤖
Goal: Developing the global payment network "WorldWire" using the Stellar core protocol.
- Visa: 🤖
Goal: Supporting Visa cards linked to Stellar wallets, particularly in emerging markets such as Kenya and the Philippines.
3. Partnerships with innovative institutions
- Paxos: 🏬
Goal: Accelerating the adoption of regulated stablecoins for financial institutions via Stellar.
- Deloitte: 🏬
Goal: Developing blockchain solutions to improve the efficiency of financial operations.
- ZettaBlock: 🏬
Goal: Simplify building applications on Stellar through innovative developer tools.
👐 Marketing Strategies and Ecosystem Adoption
Stellar relies on three main pillars to expand its impact:
1. Focus on Financial Inclusion
Emerging Markets:
Stellar targets regions with weak banking sectors (such as Africa) through partnerships with platforms like Tala and Solar, which provide Stellar-based digital wallets.
Incentive Programs:
The Stellar Development Foundation (SDF) offers grants to developers to build payment applications and DeFi projects on the network, such as the Brilliant on Stellar Challenge.
2. Enhancing Decentralized Finance (DeFi) Infrastructure
Upgrading Smart Contracts (Soroban):
Stellar launched the Soroban platform in 2025 to support more complex smart contracts, designed in Rust to ensure security and efficiency.
Cooperation with OpenZeppelin to audit smart contract security.
Attracting Stablecoins:
New stablecoins like USDY (from Ondo) are joining the network to enhance liquidity.
3. Expanding Institutional Partnerships
Leveraging Big Brands:
Stellar uses its partnerships with Mastercard and Franklin Templeton as case studies to convince other institutions to join.
Focusing on Central Bank Digital Currencies (CBDCs):
Stellar partners with governments like Ukraine (via the Stellar Aid Assist program) to efficiently distribute financial aid.
Impact of Partnerships on XLM Price and Adoption
Payment Partnerships: Increased daily trading volume ($256 million), strengthening XLM's position as a bridge for small-value transfers.
Decentralized Finance: Attracting new projects like DEXs and NFTs, transforming Stellar into a full-fledged DeFi platform.
Stablecoins: Increased USDC liquidity on the network, reducing XLM's dependence on market volatility.
Competitive Challenges
Competing with XRP:
Ripple offers similar cross-border payment solutions, but Stellar excels with its broader institutional partnerships and energy efficiency.
Regulatory Fluctuations: Restrictions on stablecoins (such as USDC) may impact network growth. BINANCE:XLMUSD.P

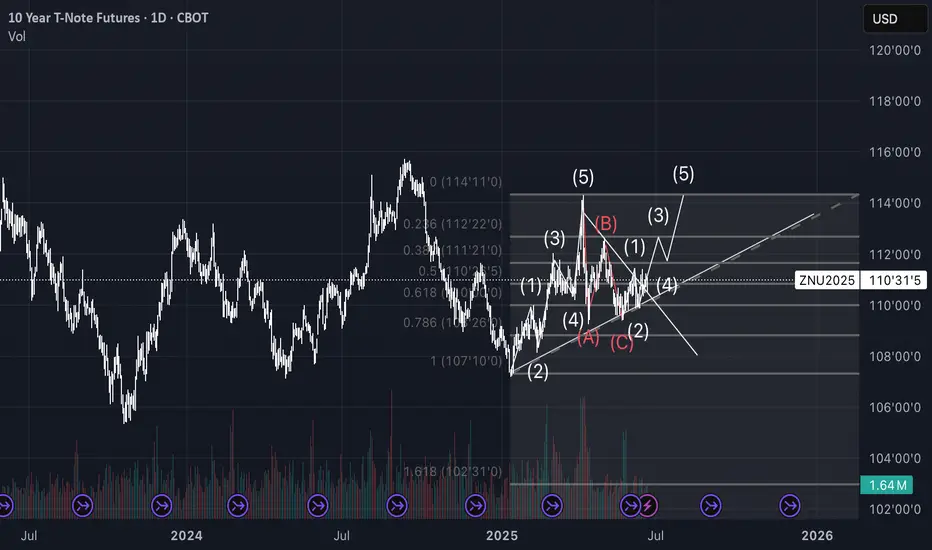
10 - Notes CallTechnical analysis of 10Y T-Note Futures (ZN1!) on 4H timeframe
Elliott Wave count with Fibonacci retracements and completed A-B-C corrective structure. Currently observing potential start of new impulsive wave (1)-(2). Breakout from descending triangle confirmed above dynamic support. Monitoring for further bullish continuation or validation of larger corrective structure.
GBP_NZD RISKY SHORT|
✅GBP_NZD is going up now
But a strong resistance level is ahead at 2.2591
Thus I am expecting a pullback
And a move down towards the target of 2.2524
SHORT🔥
✅Like and subscribe to never miss a new idea!✅
Disclosure: I am part of Trade Nation's Influencer program and receive a monthly fee for using their TradingView charts in my analysis.

Trading Ideas GBPUSD 4H [Disc On]Technical Analysis:
A Fibonacci cluster is forming around the psychological level of 1.3430–1.3435, supported by a regular bullish divergence on the stochastic indicator observed on the 4-hour timeframe.
Fundamental Analysis:
BoE Interest Rate remains at 4.25%, in line with expectations.
CPI (YoY) data came out better than expected.
Conclusion:
There is a high probability of a bullish trend, with GBP/USD likely to reach the Fibonacci target at 1.3555. A Buy position is favored, with a Stop Loss placed at the support level of 1.3380.
技术分析:
在1.3430–1.3435这一心理价位附近形成了斐波那契聚集区,并且在4小时图表上出现了随机指标的常规看涨背离。
基本面分析:
英国央行利率维持在4.25%,符合市场预期。
CPI(同比)数据好于预期。
结论:
英镑兑美元(GBP/USD)很可能出现上涨趋势,有望达到斐波那契目标位1.3555。建议考虑做多(Buy),止损位设在1.3380支撑位。

AGT/USDT AGT/USDT Cup and handle chart
please long from current price and wait few days you will get very handsome profit in this trade

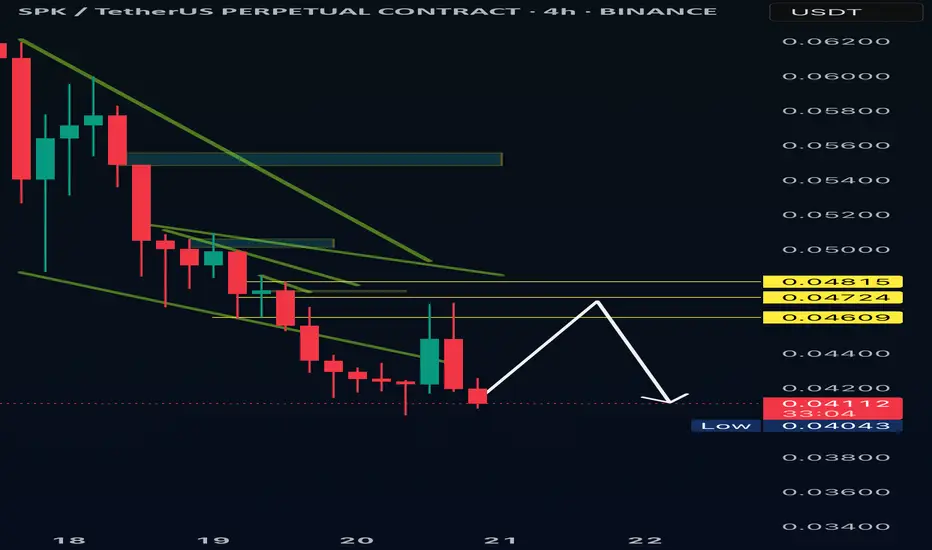
SparkIf this supp holds, a double top will be the next move. All eyes on this supp level. .0505 needs to tap
Citi Bank into heavy resistance.As you can see Citi broke down from this rising wedge last week and is now testing the under belly as resistance, which also coincides with the .786 fib retracement on the weekly timeframe. A close above the .786 on a weekly basis would cancel the bearish view, otherwise the path of least resistance is to the downside.

EUR-CHF Resistance Ahead! Sell!
Hello,Traders!
EUR-CHF keeps growing
But a strong horizontal
Resistance level is ahead
Around 0.9443 so after
The retest we will be
Expecting a local pullback
And a local bearish correction
Sell!
Comment and subscribe to help us grow!
Check out other forecasts below too!
Disclosure: I am part of Trade Nation's Influencer program and receive a monthly fee for using their TradingView charts in my analysis.

CHECK XAUJPY SIGNAL READ CAPTAINxaujpy sell now ✅
entry point (491800) (491200)
TAKE PROFIT 1: (489000)
TAKE PROFIT 2: (486100)
LAST TARGET(483600)
STOP LOSS (494100)

USDCHF-bias long Bullish indications:
Major support respected.
Inverted hammer in daily
Trend line resistance is broken.
IHS formation from the support.
formed IHS in higher low in 5 min.
4 hr : inverted hammer candle .
Bearish indications:
LLLH
Trade plan bias long @ 0.81701
SL:0.8154
TP1:0.8186
TP2:0.8201

EUR_GBP WILL KEEP GROWI|LONG|
✅EUR_GBP broke the key horizontal level of 0.8540
Which is now a support then went down
To retest it and we are now seeing
A bullish reaction so I think that
The pair will go even higher up
LONG🚀
✅Like and subscribe to never miss a new idea!✅
Disclosure: I am part of Trade Nation's Influencer program and receive a monthly fee for using their TradingView charts in my analysis.
