EUR_GBP WILL KEEP GROWI|LONG|
✅EUR_GBP broke the key horizontal level of 0.8540
Which is now a support then went down
To retest it and we are now seeing
A bullish reaction so I think that
The pair will go even higher up
LONG🚀
✅Like and subscribe to never miss a new idea!✅
Disclosure: I am part of Trade Nation's Influencer program and receive a monthly fee for using their TradingView charts in my analysis.
Chart Patterns

NZD-USD Bearish Breakout! Sell!
Hello,Traders!
NZD-USD broke out of the
Rising channel and then made
A bearish breakout of the
Horizontal key level too
Around 0.0602 which is
Now a resistance, then
Made a pullback and retest
And is going down again which
Reinforces our local bearish bias
And we will be expecting a
Further bearish move down
Sell!
Comment and subscribe to help us grow!
Check out other forecasts below too!
Disclosure: I am part of Trade Nation's Influencer program and receive a monthly fee for using their TradingView charts in my analysis.

BTC Experiencing Retracement: Bound for Mid to Lower 90k Range?Bitcoin appears to have officially commenced its retracement.
The yellow-box support zone around 96k-92k may serve as a key level to watch, though a dip as low as 90k wouldn’t be out of the question.
As shown by the provisional Elliott Wave count labeled corrective wave ABC, I interpret this as a short- to mid-term correction. While Wave C can take various forms, this scenario anticipates a typical diagonal triangle structure.

Gold Setup part 2 updateHi everyone
This is just an update on our chart setup that was published yesterday.
We caught the sell off during the Asian session & the buy during the New York session.
Lets see what Monday hold, think possible sell from around 3370-3385 area.

AIRBNB LONGAirbnb to reach ATH in the coming years like previous major tech IPOs (goes down first years then back to ATH).

The Chart Is Ugly. The Setup Is Beautiful. Welcome to the TrapI’m gonna try to keep it short (try, lol).
If you’re new here or just stumbled on this, here’s what you need to know:
LTC is the King of Pain… and the Prince of Parabolas.
It’s one of the hardest coins to hold — maybe the hardest.
It’ll test your patience, shake your conviction, and make you doubt everything...
right before it delivers.
Looking at the chart, LTC printed a bearish head-and-shoulders pattern.
But guess what? That’s PROBABLY the final trap — the one that triggers those explosive moves right after... the start of the parabolic season.
In my humble opinion, yeah — we MIGHT still drop more depending on what BTC does. But if you’re reading this and wondering what things look like before a big breakout — well, it’s exactly this:
Ugly charts, bearish structures, everyone doubting… and then boom — a new beginning. A rise.
That May move from $81 to $107? That was the breakout.
What we’re in now? It’s the bear trap.
What comes next? Should be something we’ve never seen before. I’ll leave it at that.
Some fundamentals:
LTC:
Hash-rate? Went parabolic — price hasn’t caught up yet.
Top 5 most used digital assets for moving value (by volume).
Born in 2011. 100% uptime. Still standing, still in the top 20. Survived it all.
Only 84M LTC will ever exist. Scarcity is real.
78% of LTC addresses are holding for over a year. They’re not selling cheap.
MWEB = optional privacy.
LiteVM = next-gen programmability for LTC.
Oh, and don’t forget: potential ETF approval.
If there’s one digital asset with a real shot — it’s LTC. Already declared a commodity by the CFTC.
Over 7 years of consolidation. If you zoom out to the monthly+ timeframe, all the bull and bear noise looks like one big sideways base.
Just to name a FEW.
Absurdly undervalued. Criminally underperforming.

CHECK EURUSD SIGNAL READ CAPTAIONEntry: around1.15400 1.15350)✅
Take Profit1.15150 ✅
Take Profit 2: 1.14800✅
Last Target:1.14500 ✅
Stop Loss: 1.15700❌

Oscar Long and StrongI've been long since $11.40, tight stop loss was placed below the demand zone. Strong reaction to the upside, a very good trade on this stock with the earnings release today. If you look at my charts you will understand why I longed this at the golden pocket, one of my favoured trade setups.

$BTC Probable scenarios.I think the chart speaks for itself. Technical targets for both RSI and Price Actions are noted in the chart.

BUY AUDCHFSwing buys on AUDCHF as price begins to reject at the support. Price should aim for the recently created highs 0,53700 and possibly higher.

Not BullishWhen Carvana finishes this completely manipulated bullrun, it will be devastating. Typically extended 5th waves will correct at a minimum back down to wave 2 of said 5th wave. That means $50.
The stock was in an expanding formation which it broke out from and then failed back into. Very bearish. That is also the same type of pattern that Bitcoin displayed years ago before a major bear market. I think the top is in here, but we'll see.
To get that crash down to $50, something will have to come out in the news most likely about Carvana's stock manipulation and the ghost companies they are using to inflate cash flows. That is purely just a theory though. Perhaps they are squeaky clean and it's totally justified that their stock rose as much as it has, but...I'm not in that camp.
Not to mention all the upper management basically sell their stocks every week. Tens of millions of dollars are being siphoned out by the board and upper management almost every single week. The CEO by himself is cleaning house almost every other day lately. www.sec.gov

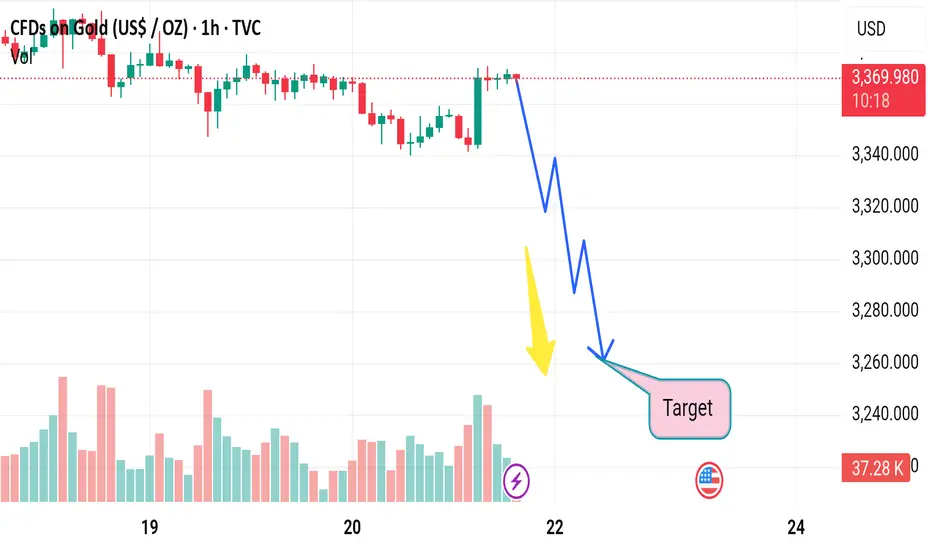
Market next target 📉 Original View (Bearish Outlook):
Predicts a downward move from around $3,370 to the target near $3,250.
Sharp drop illustrated with zigzag downward arrows.
Yellow arrow highlights growing volume — likely interpreted as early selling pressure.
---
🔄 Disruption: Bullish Reversal or Trap Setup
🧠 Problems With Bearish Thesis:
1. Volume Spike Might Indicate Demand:
The yellow arrow highlights a volume surge, but this might be buyer absorption, not selling dominance.
If this volume came during a wick-heavy candle or hammer, it suggests buying interest at lows.
2. No Break of Major Support Yet:
Price is still above $3,350, a key psychological and technical zone.
No clear breakdown has occurred — the downtrend is assumed, not confirmed.
3. Oversold Momentum?
Momentum indicators (not shown) may reveal oversold conditions, making a short-term rebound more probable.
Market next move 🔄 Disrupted Analysis: Bullish Counter-Scenario
🧠 Original Bias:
The chart predicts a strong bearish move, with a target around 88,000 USD.
The label "Bullish" seems misleading as it’s placed in a steep downward move.
---
📉 Issues With the Original Analysis:
1. Volume Misinterpretation:
Increasing red volume could indicate capitulation or a temporary panic sell-off, not necessarily the start of a new trend.
A bounce could follow if buyers step in.
2. Support Zone Ignored:
The analysis overlooks any previous support levels in the 100k–98k range, where buyers may be waiting.
3. No Confirmation for Breakdown:
The chart does not show a completed breakdown of a key structure or trendline.
The blue squiggle assumes a breakdown will happen, but no technical confirmation is visible.
---
📈 Disruption Scenario: Bullish Reversal Possible
Rejection from 102k zone could be a liquidity grab, not the start of a downtrend.
Hidden bullish divergence on RSI or MACD (not shown here) could support a bounce.

Gold shorts may reach 3290Gold shorts may reach 3290
This week, gold continued to fall after opening high to 3452 on Monday, showing a trend of opening high and closing low. The daily line closed negatively for several consecutive days, accompanied by a cross star adjustment, indicating that shorts are still dominant and short-term corrections have not yet ended. The 4-hour level is below the middle track of the Bollinger band, and the rebound has been repeatedly under pressure, indicating that the short-term is still weak, and the operation continues to focus on high altitude.
Key point analysis
1. Resistance area
3368-3370 (today's starting point, key suppression)
3380-3383 (4-hour Bollinger middle rail + this week's oscillation upper edge)
3400-3408 (bullish reversal confirmation point)
2. Support area
3340-3345 (short-term bullish defense position)
3315 (short-term target after breaking 3340)
▶ Core idea:
If the rebound 3368-3370 is under pressure, short-term short-selling
If the 3340 support is effective, short-term rebound can be expected
If it falls below 3340, look down to 3315
Today's trading strategy
1. Short position layout (main strategy)
Entry point: 3368-3370 (first touch short)
Add position point: 3373-3376 (second pressure to cover short)
Stop loss: above 3381 (short position invalid if break)
Target: 3355 → 3345 (see 3315 if break)
2. Long position auxiliary (short-term game)
Entry condition: 3340 has not been broken, and there is a stabilization signal
Stop loss: below 3335
Target: 3360-3368 (exit the market as soon as the rebound)
Risk warning Friday's market is volatile, beware of profit-taking or sudden rebound at the end of the day. If it breaks through 3380, short positions need to be exited, and observe whether it turns to shock or reversal. Avoid chasing orders at the middle price (3350-3365), and wait patiently for key positions to trade.

HYPE/USDT ANALYSIS Currently waiting for price of HYPE to get to the green zone for potential LONG opportunities

BTC Testing Crucial Support – Breakdown or Bounce ?Bitcoin is currently testing a critical support zone around $103,573 – a break below could trigger a sharper move toward $101,400.
Price rejected from ~$105.8K
Support holding... for now
RSI dropping fast – now near 34 (1H TF)
Weakening momentum visible
This level is the last line of defense for bulls. If it cracks, expect volatility.
Watch closely. Break = panic or buying opportunity?
DYOR. Not Financial Advice.

EUR/CHF Parallel Channel Breakout WatchThe EUR/CHF pair has been trading within a well-defined parallel channel on the 1-hour timeframe. The price action is contained between a strong resistance zone near 0.9420–0.9425 (marked in red) and a support zone near 0.9365–0.9370 (marked in green). Multiple rejections from both the top and bottom of the range indicate solid market structure and participation from both buyers and sellers.
This type of formation often leads to explosive moves when the price eventually breaks out of the consolidation range. The current chart shows price testing the upper boundary of the channel once again, and now attempting a bullish breakout.
📈 Bullish Breakout Scenario
If the price sustains above the resistance zone (confirmed breakout), we could see a continuation of bullish momentum toward the projected breakout target near 0.9475. This target is calculated using the height of the channel added to the breakout level, a classic price projection method. A strong candle close above the resistance with volume would validate this move. Traders may look for long entries on breakout confirmation or on a successful retest of the resistance zone as new support.
📉 Bearish Reversal Scenario
However, if the breakout fails and price gets rejected again from the red zone, a sharp reversal back toward the support zone around 0.9370 may occur. This would keep the channel intact and suggest continued range-bound movement. A breakdown below support would then be required for further bearish confirmation, leading toward deeper downside targets.
This setup provides a high-probability opportunity in either direction with clearly defined levels and structure. Wait for breakout confirmation before entering to avoid false moves.
=================================================================
Disclosure: I am part of Trade Nation's Influencer program and receive a monthly fee for using their TradingView charts in my analysis.
=================================================================


Analysis of the latest gold trend on June 20:
1. 🔍 News interpretation
This week, gold continued to pull back, especially in the Asian session on Friday, which once fell to a one-week low, and the overall performance was weak. It was mainly affected by the following key factors:
1. The Fed's policy stance continued to be hawkish (bad news)
This week's FOMC meeting kept interest rates unchanged;
The dot plot shows that there will only be two interest rate cuts by the end of 2025;
And postponed the expectation of further interest rate cuts in 2026-2027;
This move strengthened the expectation of "long-term high interest rates" and formed a systematic suppression on gold prices.
2. The US dollar index fluctuated and fell (short-term bullish)
The US dollar index hit a stage high at the beginning of this week and then fell back;
The correction of the US dollar index provided some support for gold prices and eased downward pressure.
3. Geopolitical and risk aversion factors are still fermenting (limiting the decline)
The situation in the Middle East continues to be tense;
There is uncertainty in the outlook for global trade;
The market's risk aversion demand is still there, becoming an important support for gold prices.
✅ Comprehensive judgment: The hawkish stance of the Federal Reserve dominates the market, and gold is under pressure and falls in the short term; risk aversion provides bottom support for it, and the overall long and short positions are intertwined, with weak fluctuations as the main trend.
2. 📊 Technical trend analysis
1. Overview of the current structure
This week, gold failed to continue its upward trend after reaching 3450;
Friday's intraday decline to the 3342-3345 range just tested the lower edge of the 4-hour upward channel;
The current trend shows a technical pattern of "weak highs - limited rebounds - weak fluctuations".
2. Key technical signals
Cycle Indicator status Interpretation
Weekly MACD dead cross is approaching, medium- and long-term bearish is being confirmed
Daily kinetic energy column turns into a negative line, bullish energy is weakened, bearish is dominant
1 hour fast and slow lines dead cross, located below the 0 axis, short-term selling signal is strengthened
3. Support and resistance analysis
Current support level: 3342 (lower edge of the channel), if it breaks down, the decline may be expanded to 3250;
Upper resistance level: 3368-3378 range (previous rebound high point), with obvious pressure;
If it falls below 3342, the space below will be reopened, and the potential decline may reach 100 US dollars.
III. 🎯 Operation strategy suggestions
The current market is volatile and weak. It is recommended to continue to adopt the strategy of high-short as the main and low-long as the auxiliary to flexibly respond to fluctuations.
✅ Short on rebound 3372–3378 Stop loss above 3385 Target 3335–3320 Trend is bearish, short on pressure
✅ Support light position to try long 3325–3330 Stop loss 3320 Target 3360–3370 Short-term game rebound, fast in and fast out
⚠️ Risk warning: If it falls rapidly and breaks through 3342, it is necessary to quickly adjust the long position and stop going long, and beware of inertial downward break that triggers a deep correction to the 3250 area.
IV. 📌 Focus of the market outlook
Speech by Fed officials and economic data release (expected interest rate direction)
Trends of the US dollar index and US Treasury yields
The impact of the Middle East and global trade situation on risk aversion
Can gold maintain the key technical level of 3342

Long Setup: Micro Copper Futures (Jul 2025)While U.S. equity markets are closed in observance of Juneteenth, traders in the futures markets still have opportunities to position ahead of broader market moves. One such opportunity is forming in Micro Copper Futures (MHGN2025), which continues to consolidate in a tight range near key technical levels. The current structure suggests a potential breakout to the upside with a favorable risk-reward setup.
Technically, price action remains compressed between approximately 4.70 and 4.90, coiling just above the Ichimoku Cloud and holding support above the mid-April range. This zone has acted as a critical demand area multiple times since April, and the market has rejected any meaningful downside continuation, signaling underlying strength.
A long position is being considered based on the following:
Entry Zone: Around 4.81, above the flat Kijun-sen and within the current range high.
Stop Level: Set at 4.7080, just below the support band and Ichimoku base, providing technical invalidation if broken.
Target: 5.10, aligning with previous resistance and psychological round number. This would complete a 6.8% upside move from current levels.
Risk/Reward Ratio: 2.64, indicating strong asymmetry favoring the long bias.
The MACD histogram remains positive despite flattening out in recent sessions, while the signal line crossover earlier in June continues to support the bullish case. Although momentum has paused, it has not turned negative, which may point to a consolidation phase before the next leg.
The broader copper narrative also lends support to this setup. With persistent demand from renewable infrastructure, data centers, and EVs, copper remains a fundamentally supported commodity despite near-term volatility driven by macro factors and central bank policy. Any fresh economic stimulus out of China or signs of rate stabilization globally could provide the catalyst for a bullish breakout in base metals.
Traders should monitor volume and any breakout beyond the 4.89–4.90 zone, which could trigger further buying. A daily close above 4.90 on increased volume would confirm the breakout and improve the probability of reaching the 5.10 target.
While today’s market holiday may reduce liquidity temporarily, it also offers a less crowded environment for early positioning. As always, risk management is paramount, and trade sizing should reflect the volatility and leverage of commodity futures.
This setup remains active and will be reassessed if price fails to hold above the key support zone or if macroeconomic conditions materially shift in the near term.

XAUUSD:Go long before you go short
Yesterday's market is relatively fast, we pay attention to the stop profit point, today's Asian plate fell, technical point of view, this week after the big Yin, there is little strength of the rebound, often after the reverse draw will be recovered, the same down after the rapid counterattack, short-term overall performance for the shock downward trend, the center of gravity moving down.
The trading space is also gradually shrinking, within the day can be around 3340-3370 range to operate.
Trading Strategy:
BUY@3344-49
TP:3365-70
Consider going short at 3370-75
More detailed strategies and trading will be notified here ↗↗↗
Keep updated, come to "get" ↗↗↗

Gold analyseGold SEL 3374
SL 3382
TP 3360
TP 3352
TP 3341
TP 3331
Gold buy 3382
TP 3398
TP 3409
TP 3422

NZD/USD Pushes Below Opening Range for JuneNZD/USD slipped to a fresh monthly low (0.5959) after struggling to close above 0.6070 (61.8% Fibonacci extension), and a move/close below the 0.5920 (61.8% Fibonacci extension) to 0.5930 (78.6% Fibonacci extension) region may lead to a test of the May low (0.5847).
Next area of interest comes in around 0.5740 (78.6% Fibonacci retracement) to 0.5760 (100% Fibonacci extension), but NZD/USD may attempt to retrace the decline from the monthly high (0.6088) should it defend the advance from the May low (0.5847).
Need a close above 0.6070 (61.8% Fibonacci extension) to bring 0.6170 (50% Fibonacci extension) on the radar, with the next area of interest coming in around 0.6230 (50% Fibonacci extension) to 0.6260 (38.2% Fibonacci extension).
--- Written by David Song, Senior Strategist at FOREX.com
