USDCHF oversold bounce backs capped at 0.8045The USD/CHF pair is currently trading with a bearish bias, aligned with the broader downward trend. Recent price action shows a retest of the falling resistance, suggesting a temporary relief rally within the downtrend.
Key resistance is located at 0.8045, a prior consolidation zone. This level will be critical in determining the next directional move.
A bearish rejection from 0.8045 could confirm the resumption of the downtrend, targeting the next support levels at 0.7900, followed by 0.7860 and 0.7810 over a longer timeframe.
Conversely, a decisive breakout and daily close above 0.8045 would invalidate the current bearish setup, shifting sentiment to bullish and potentially triggering a move towards 0.8080, then 0.8140.
Conclusion:
The short-term outlook remains bearish unless the pair breaks and holds above 0.8045. Traders should watch for price action signals around this key level to confirm direction. A rejection favours fresh downside continuation, while a breakout signals a potential trend reversal or deeper correction.
This communication is for informational purposes only and should not be viewed as any form of recommendation as to a particular course of action or as investment advice. It is not intended as an offer or solicitation for the purchase or sale of any financial instrument or as an official confirmation of any transaction. Opinions, estimates and assumptions expressed herein are made as of the date of this communication and are subject to change without notice. This communication has been prepared based upon information, including market prices, data and other information, believed to be reliable; however, Trade Nation does not warrant its completeness or accuracy. All market prices and market data contained in or attached to this communication are indicative and subject to change without notice.
Chart Patterns

USDCAD bearish consolidation resistance at 1.3700The USDCAD currency pair remains in a bearish technical structure, consistent with the prevailing downtrend. Recent price action suggests sideways consolidation, indicating indecision as the pair pauses before its next directional move.
Key Technical Levels:
Resistance:
1.3700 – Key pivot zone; previously acted as intraday resistance.
1.3740 – Minor resistance.
1.3790 – Stronger resistance zone and potential reversal point.
Support:
1.3566 – Initial downside target on renewed selling pressure.
1.3544 – Intermediate support.
1.3520 – Long-term support and potential demand zone.
Scenario Analysis:
Bearish Case (Favored):
Price is consolidating below the key 1.3700 level. A failure to break above this resistance could trigger a renewed move lower. A bearish rejection from this level may open the path toward 1.3566, then 1.3544 and 1.3520 over a longer timeframe.
Bullish Case (Alternative):
A confirmed breakout and daily close above 1.3700 would invalidate the current bearish setup. This could shift sentiment to bullish and trigger a move toward the next resistance zones at 1.3740 and 1.3790.
Conclusion:
The technical bias for USDCAD remains bearish while price trades below the 1.3700 resistance zone. Traders should watch for a rejection from this level to confirm further downside potential. However, a sustained break above 1.3700 would neutralize the bearish setup and suggest scope for a short-term bullish reversal.
This communication is for informational purposes only and should not be viewed as any form of recommendation as to a particular course of action or as investment advice. It is not intended as an offer or solicitation for the purchase or sale of any financial instrument or as an official confirmation of any transaction. Opinions, estimates and assumptions expressed herein are made as of the date of this communication and are subject to change without notice. This communication has been prepared based upon information, including market prices, data and other information, believed to be reliable; however, Trade Nation does not warrant its completeness or accuracy. All market prices and market data contained in or attached to this communication are indicative and subject to change without notice.

Solana (SOL/USDT) 4H Reverse H&S PatternSolana (SOL/USDT) – 4H Market Outlook | July 1, 2025
Introduction
SOL has formed a reverse head and shoulders pattern, followed by a clean breakout above resistance. While the lower time frame is bullish, the higher time frame remains bearish, creating a short-term opportunity within a broader downtrend.
Context 1: Key Zones
Supply Zone: 176 – 187
Demand Zone: 126 – 143
Psychological Levels: 140 and 160
Context 2: Technical Structure
Pattern: Reverse Head & Shoulders
Breakout: Confirmed above neckline/resistance
FVGs:
One below price (within demand)
One above price (potential target)
Golden Pocket: Sits just above lower FVG and inside demand — strong confluence support
Context 3: Volume Insight
OBV Indicator: Shows a sudden volume spike, adding strength to the breakout and the bullish pattern confirmation.
Bullish Scenario
Price pulls back into the golden pocket + FVG + demand zone
Finds support → bounces to form higher low
Second leg of the move breaks swing high → targets upper FVG and 160 psychological level
Bearish Scenario
Price breaks back below demand zone and invalidates the golden pocket
Fails to hold structure → reverts to macro bearish trend
Potential retest of previous swing low below 126
Summary
SOL is showing bullish momentum on the 4H after completing a reversal pattern and spiking in volume. A pullback into the demand zone confluence may offer a strong long setup — but failure to hold could revalidate the higher timeframe downtrend.

Gold continues to be weak, but be careful about operations📣Gold prices fell 2% last Friday, hitting a near one-month low. Optimistic trade-related agreements boosted risk appetite and weakened the attractiveness of gold as a safe-haven asset. This week, the market will usher in a group meeting of major central bank governors around the world (Fed Chairman Powell, European Central Bank President Lagarde, Bank of England Governor Bailey, Bank of Japan Governor Kazuo Ueda, and Bank of Korea Governor Lee Chang-yong). The market will also usher in non-agricultural data. In addition, Powell's remarks on whether to resign may ignite the market this week. Gold prices may fluctuate more around the lower track of the Bollinger Band at $3,270/ounce this week.
Technical analysis:
Last Friday, the K-line had a lower shadow, and the Bollinger Band did not diverge. It is not easy to go short directly in operation, but wait for the rebound to confirm 3295 and the key resistance of ma5 to be short.
💰 Operation strategy: Rebound to 3280-3283 to go short, target 3270-3265, stop loss 3288-3290
If you are a beginner, I suggest you first understand what trading is.

BTC/USD – Executed Short on Bearish Retest of Resistance PricePrice: 107,950
Position: SHORT
Strategy: Retest Sell into Bearish Continuation
Timeframe: 30m
Status: Trade Active
📊 Analysis Summary:
BTC/USD retested the 107,950–108,100 resistance zone, aligning with the 14 EMA on a clear downtrend. Bearish rejection candles confirmed seller dominance, and I executed a short entry near the top of the retest.
🔽 Plan Ahead:
Towards:105,400
Holding this short unless price breaks back above EMA with bullish strength.
💬 "Sell the bounce. Ride the breakdown. Risk managed, conviction high."
What’s your view? Will BTC hold below 108K or are bulls about to fight back?
#BTCUSD #Bitcoin #CryptoTrading #TechnicalAnalysis #ShortTrade #BearishTrend #EMA #TradingStrategy #SmartMoney #MarketStructure #RiskReward #SwingTrade

XAUUSD-Gold stalls below $3350 as USD weakness continuesGold remains delicately balanced as traders in Asia and Europe proceed with caution. Despite recent USD weakness lending some support, buyers haven’t broken above $3350.
📉 USD Weakness & Market Sentiment – Fragile Recovery?
🔻 Dollar Wobbles: Talk of Fed leadership change is stirring doubt over the USD’s trajectory, adding political risk that may benefit gold.
⚖️ Mixed Sentiment: Gold consolidates in a tight range after early‑week drop. With PCE data and Fed speeches ahead, traders await the next catalyst.
📊 Technical Structure – Consolidation Underway
Gold trades below short‑term EMAs, hinting at a bearish pause or stealth accumulation. Current levels near $329X.
Key Zones:
🟢 Demand (Buy): $3264 / $3276 / $3294
🔴 Supply (Sell): $3313 / $3321 / $3330 / $3341
🎯 Intraday Trading Plan:
🛒 BUY ZONE: $3264–$3266 (SL: $3270; TPs: $3280 → … → $3320)
⚡️ BUY SCALP: $3282–$3284 (SL: $3278; TPs: $3288 → … → $3330)
📉 SELL ZONE: $3331–$3333 (SL: $3337; TPs: $3326 → … → $3300)
⚠️ SELL SCALP: $3313–$3315 (SL: $3320; TPs: $3310 → … → $3280)
🧭 Watchlist: Friday’s PCE, Fed commentary & Middle East tensions may sway price

BTC AnalysisSince the red arrow was placed on the chart, Bitcoin's bullish phase has ended and it has entered a corrective phase. This correction appears to be forming a Diametric pattern, and we are currently in the middle of wave E.
After interacting with the demand zone, the price may move toward the specified targets.
A daily candle closing below the invalidation level will invalidate this analysis.

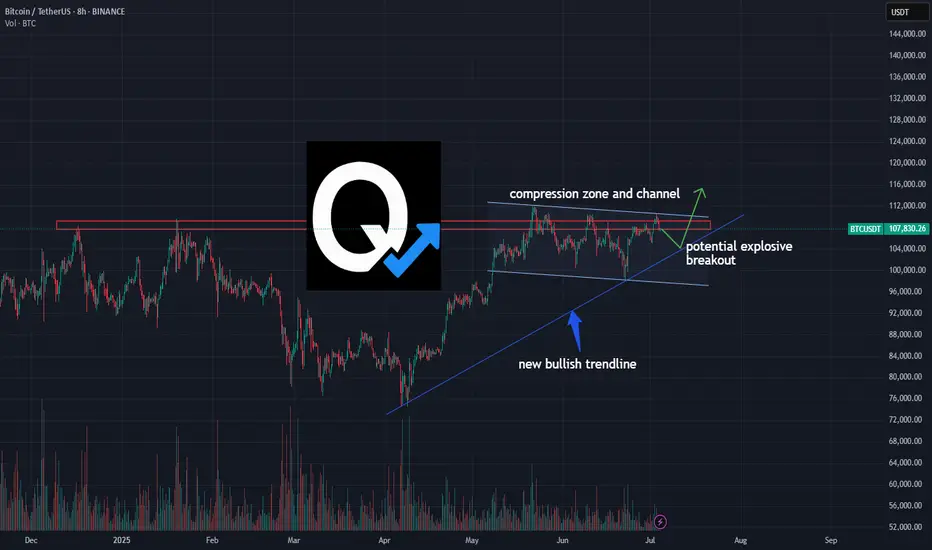
BTC/USDT – Compression Points to Potential Explosive BreakoutBitcoin is grinding into a major compression zone between horizontal resistance and a new bullish trendline. Volume is tightening, structure is intact, and the pressure is building.
This 8H chart highlights a classic breakout setup — a squeeze inside a channel, supported by an ascending trendline that has held clean since April.
🚀 A breakout above $110K could open up rapid upside continuation.
🧭 A retest of the trendline would offer a possible high-reward long entry.
📉 Breakdown invalidates the structure — watch $104K closely.
This is not financial advice — just a breakdown of what the chart is showing. Trade safe, think independently, and manage your risk.
#BTC #Bitcoin #CryptoTrading #BTCUSDT #TechnicalAnalysis #BreakoutSetup #CompressionZone #QuantTradingPro
Gold suffered a heavy blow from non-farm payrolls! Yesterday's decline in gold prices was mainly affected by news, and such declines usually do not last too long. From a technical point of view, gold prices received support near 3322 at night, which is the key support level today. It is worth noting that on Wednesday, gold prices were under pressure in the 3340-3344 area, while on Thursday, prices formed support in this range, indicating that the area is forming a top-bottom conversion, so 3340-3345 has become an important pressure level today. It is expected to fluctuate and consolidate in the 3322-3340/45 range during the day. The impact of news on gold prices is usually short-term. When the fundamentals and technical directions are consistent, price fluctuations will be more obvious; when the two are inconsistent, price fluctuations will weaken, but will not change the technical trend. The rebound pattern established at the beginning of the week is still valid. After a short-term shock, gold prices are expected to re-stand above 3345 and continue to maintain the rebound trend.

Gold is rising in the shock!Recently, gold has maintained a shock pattern. As the US Independence Day is closed early today, the market volatility is expected to be limited, but the shock market will continue, but the fluctuation range may change. Yesterday's gold price fell mainly due to the news, and this decline usually does not last too long. From a technical point of view, the gold price was supported near 3322 at night, which is the key support level today. It is worth noting that on Wednesday, the gold price was under pressure in the 3340-3344 area, while the price formed support in this range on Thursday, indicating that the area is forming a top-bottom conversion, so 3340-3345 has become an important pressure level today. Weng Fuhao expects that the gold price will fluctuate and consolidate in the 3322-3340/45 range during the day. The impact of news on gold prices is usually short-term. When the fundamentals and technical directions are consistent, the price fluctuations will be more obvious; when the two are inconsistent, the price fluctuations will weaken, but will not change the technical trend. The rebound pattern established at the beginning of the week is still valid. After a short-term shock, the gold price is expected to re-stand on 3345 and continue to maintain the rebound trend.

EUR_JPY WILL GO UP|LONG|
✅EUR_JPY is trading in an
Uptrend and the pair has already
Made a retest of the horizotnal
Support of 169.800 and we are
Already seeing a bullish rebound
So we are bullish biased and
We will be expecting a
Further bullish move up
LONG🚀
✅Like and subscribe to never miss a new idea!✅
Disclosure: I am part of Trade Nation's Influencer program and receive a monthly fee for using their TradingView charts in my analysis.

Gold Is Set to Bottom Out and Rebound This WeekAt today’s open, gold once again dipped into the 3258–3248 buy zone, then rebounded toward 3270. From a structural perspective, gold has clearly entered a downward trend, but this decline is unlikely to be one-directional—short-term rebounds and consolidations are expected along the way.
Based on my experience, below 3250 remains a favorable area for initiating long positions. Whether the price rebounds directly or continues lower before building a stronger base to challenge 3300 again, the broader outlook remains bullish as long as the 3200 support holds. A bottoming reversal this week is still the more probable scenario.
As such, the focus early this week should be on buying near the lows, with short opportunities on rebounds as a secondary strategy. Monitor key support levels for signs of strength.
This week is also packed with important data—including PMI, Non-Farm Payrolls (NFP), and the unemployment rate, in addition to regular economic releases. Given the current macroeconomic backdrop, significant market volatility is expected—bringing both risk and opportunity. Manage your exposure carefully and stay adaptable.

Repurchase position with a less risky strategyNow the price has managed to break the dynamic resistance line
So we can re-enter the buy position with a less risky strategy
Trading Setup:
There is a Trading Signal to Buy in Gold XAUUSD (4h)
Traders can open their Buy Trades NOW
⬆️ Buy now or Buy on 3317.1
⭕️SL @ 3272.8
🔵TP1 @ 3489.0
🔵TP2 @ 3599.0
#Signal #forexsignal
What are these signals based on?
Classical Technical Analysis
Price Action Candlesticks Fibonacci
RSI, Moving Average , Ichimoku , Bollinger Bands

Market next target 🔄 Disruption Analysis:
📌 Current Scenario:
Price is trading around 3,336.400, just below the identified resistance zone (~3,340-3,343).
A range-bound structure is visible with repeated rejections at resistance and support.
---
🚨 Disruption View:
❌ Invalidating Bearish Bias:
The chart assumes a bearish move toward the 3,320 target, but there are early signs of strength near the mid-range (3,335 area).
Failed breakdowns and higher lows indicate buying pressure below 3,330.
---
🟢 Alternative Disruption Outlook (Bullish Flip):
If price breaks and holds above 3,343 resistance, we may see:
🔼 Upside breakout toward 3,355–3,360 zone.
📈 Continuation of the larger uptrend from July 1st rally.
---
🔁 Key Disruption Levels:
Support: 3,328–3,330 (interim zone to watch before full drop)
Resistance: 3,343–3,345 (bullish breakout point)
Invalidation of Bearish Bias: Closing above 3,345 on strong volume.

ETH/USDT at Critical Decision Point: Breakout or Rejection AheadETH is pressing into a major confluence zone between two key trendlines. Price is currently testing both diagonal resistance and horizontal support, making this a pivotal area to watch 👀
📍 Scenario 1 – Bullish:
If ETH can break above Resistance Zone #1 and hold, there’s clear upside toward $2,900 (Resistance Zone #2). A confirmed breakout could mark the start of a new short-term uptrend.
📍 Scenario 2 – Bearish:
Failure to hold Support Zone #1 could send price back into the lower range, with $2,300 and $2,100 in play. Watch for rejection from the descending trendline and a break of the rising channel.
This post is for educational purposes only — not financial advice. Use your own judgment and proper risk management when trading.
#ETH #Ethereum #TechnicalAnalysis #TradingView #BreakoutWatch #SupportResistance #CryptoTA #QuantTradingPro

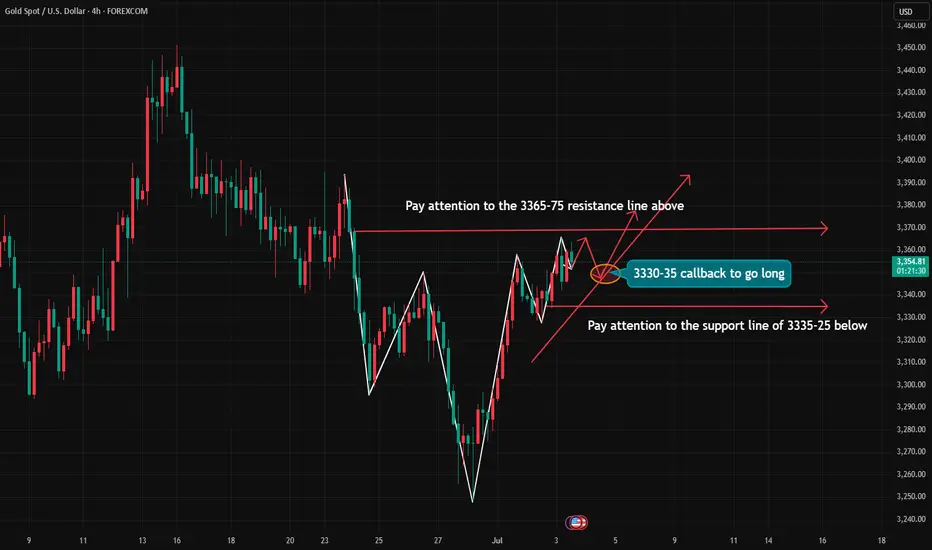
Gold non-farm payrolls are coming soonThe 4-hour level shows that the gold price turned to high-level fluctuations after testing the upper rail yesterday. There is still room for upward movement after the structure is completed. The 1-hour moving average system shows a golden cross divergent bullish arrangement, indicating that there is sufficient short-term upward momentum. In the morning, the gold price continued to rise and hit a new high for the stage, and the trend maintained a bull-dominated pattern. Although there was a correction in the US market yesterday, it stopped falling and stabilized at the key support level of 3330 and broke through the previous high, further confirming the short-term strength. Therefore, Weng Fuhao believes that once the correction to the upper area of 3335-3330 constitutes a dip opportunity. The intraday operation strategy recommends that the correction is mainly long and the rebound is supplemented by short. The short-term support below focuses on the 3335-3330 range, and the short-term resistance above is 3365-3375.
Gold lacks downward momentum.Today, gold is relatively quiet due to the impact of the US Independence Day holiday. Below, we continue to pay attention to the short-term quality layer of 3324. The key pressure above is maintained at yesterday's opening point of 3345-50. At midnight, gold rebounds near 3345-50 and can be shorted. The target is around 3330-33. It closes early at midnight and maintains a range of fluctuations! If your current gold operation is not ideal, I hope I can help you avoid detours in your investment. Welcome to communicate!
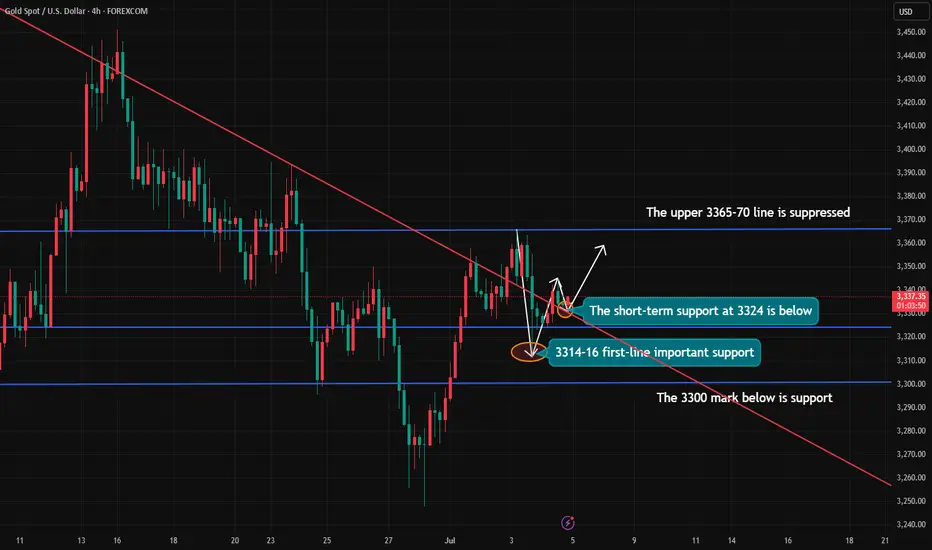
From the 4-hour analysis, pay attention to the support of 3324-30 below, focus on the support position of 3316, and pay attention to the short-term resistance of 3345-50 above. At midnight, the overall high-altitude low-multiple cycle participation remains unchanged. In the middle position, watch more and move less, be cautious in chasing orders, and wait patiently for key points to participate.
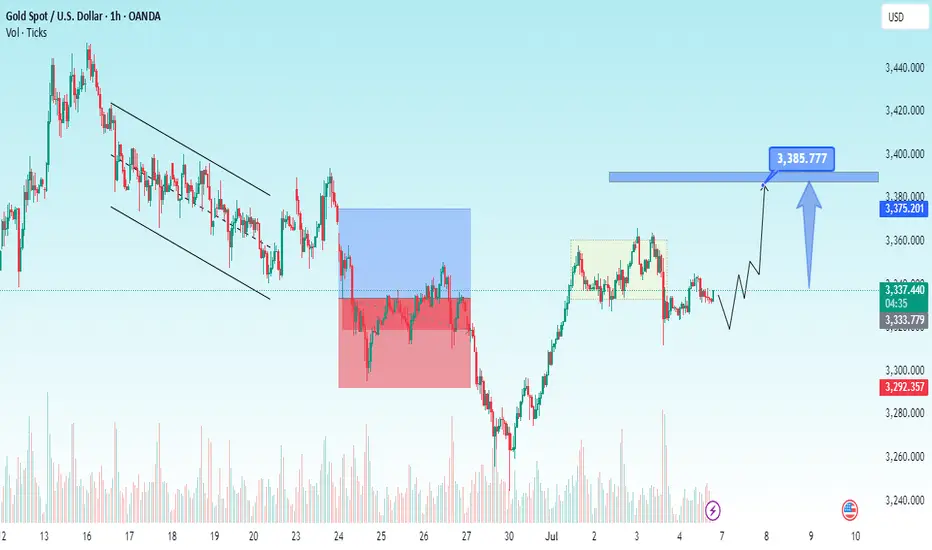
XAUUSD Going To Fly SoonGold price regains positive traction and reverses a part of Thursday’s upbeat NFP-inspired losses. US fiscal concerns weigh on the USD and lend support to the commodity amid trade uncertainties. Holiday-thinned liquidity might hold back the XAU/USD traders from placing fresh directional bets.
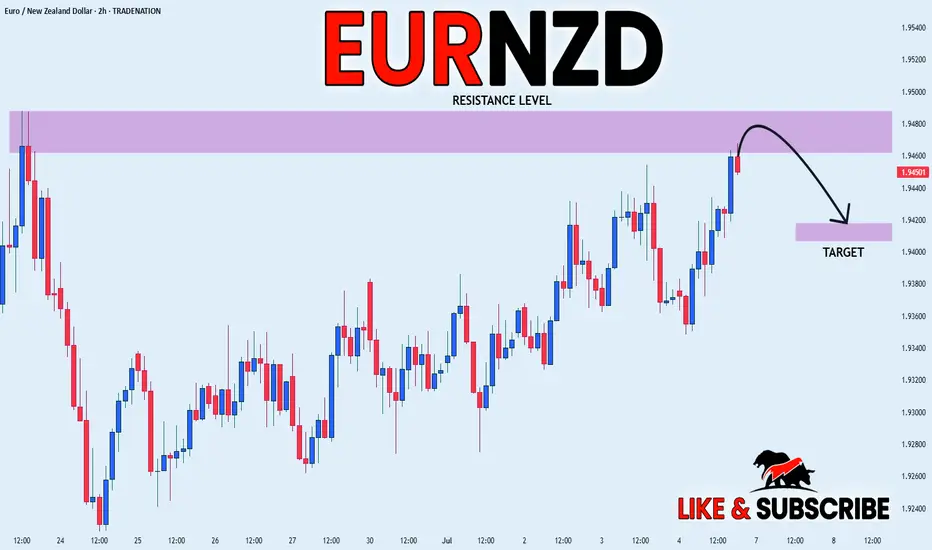
EUR_NZD LOCAL SHORT|
✅EUR_NZD is set to retest a
Strong resistance level above at 1.9488
After trading in a local uptrend for some time
Which makes a bearish pullback a likely scenario
With the target being a local support below at 1.9420
SHORT🔥
✅Like and subscribe to never miss a new idea!✅
Disclosure: I am part of Trade Nation's Influencer program and receive a monthly fee for using their TradingView charts in my analysis.
SOL/USDT Breakdown: Bearish Retest Sets Up ShortPrice action on SOL just confirmed a key structural shift 📉
The ascending trendline has been broken, and we’re now seeing a textbook bearish retest below prior support — which is flipping to resistance.
This setup suggests momentum is turning.
A lower high beneath the new downtrend line points to possible continuation toward the 132 zone.
• Trendline broken
• Retest in progress
• Short thesis active unless price reclaims 159+
This is not financial advice — just a breakdown of a technical idea based on structure and market behavior.
#SOL #CryptoTrading #TrendBreak #BearishSetup #TechnicalAnalysis #TradingView #QuantTradingPro

USD-CAD Local Rebound! Buy!
Hello,Traders!
USD-CAD is trading in a
Strong downtrend but
The pair made a retest
Of the horizontal support
Level of 1.3540 from where
We are already seeing a
Bullish rebound and we
Will be expecting a
Further move up
Buy!
Comment and subscribe to help us grow!
Check out other forecasts below too!
Disclosure: I am part of Trade Nation's Influencer program and receive a monthly fee for using their TradingView charts in my analysis.

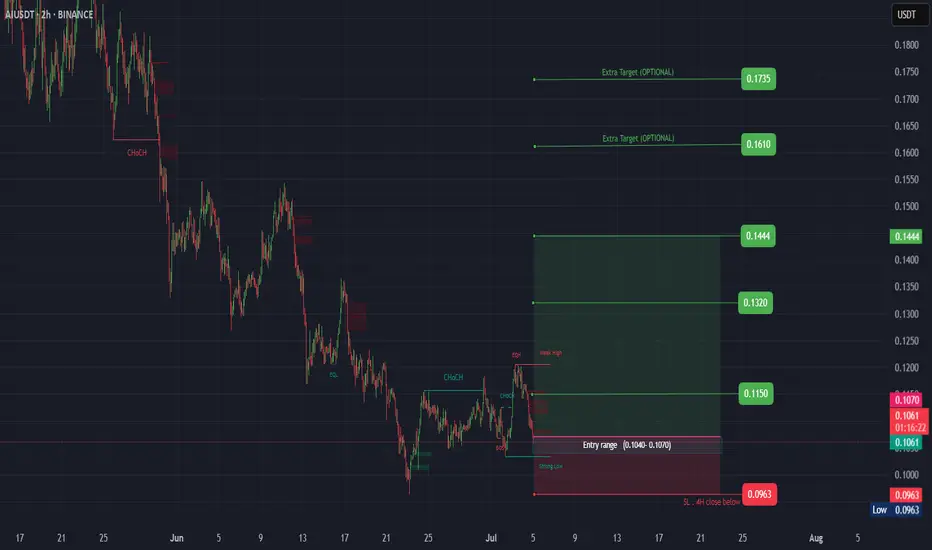
AI ( SPOT )BINANCE:AIUSDT
#AI/ USDT
Entry( 0.1040- 0.1070)
SL 4H close below 0.0963
T1 0.1150
T2 0.1320
T3 0.1444
_______________________________________________________
Golden Advices.
********************
* collect the coin slowly in the entry range.
* Please calculate your losses before the entry.
* Do not enter any trade you find it not suitable for you.
* No FOMO - No Rush , it is a long journey.
The Chart Says ''Cheer Up Japan'' – JPY Looks Safe📊🇯🇵 The Chart Says "Cheer Up Japan" – JPY Looks Safe 💙✨
There’s been talk, worry, even viral prophecy this week… but I’m here to say:
I read charts — not fear.
And right now, the JPY is showing strength, not weakness.
After running a full scan with my AI-powered Precision Master Mode, the cleanest trade setup aligned with this view is:
AUDJPY SHORT 📉
🗾 Cheer up, Japan — the Yen’s got this.
No panic in the charts. Just structure, volume, and momentum confirming that JPY is holding its ground as a safe-haven currency.
🔍 TRADE SETUP – AUDJPY SHORT
ENTRY: Market (or 94.85 for better R:R)
STOP LOSS: 95.70 (above trap high)
TARGETS:
TP1: 93.50
TP2: 91.57
TP3: 87.84 (macro target)
📈 What the chart shows:
– Strong rejection from top channel zone (structure is King!)
– SuperTrend flip starting on multiple TFs
– VWRSI fading = momentum loss
– Volume Profile confirms resistance
So while the headlines play on emotions, my execution comes from structure.
Let’s ride this JPY strength into next week — calmly, confidently.
📸 Chart attached (8H view – AI tuned)
📰 Article on the 'prophecy' that sparked the buzz:
www.telegraphindia.com
Have a nice weekend Japan and all Asia! After a 'scary prophecy' troubling your minds the weekend can end up being a crazy happy one!
One Love,
The FXPROFESSOR 💙
Disclosure: I am happy to be part of the Trade Nation's Influencer program and receive a monthly fee for using their TradingView charts in my analysis. Awesome broker, where the trader really comes first! 🌟🤝📈
