EURUSD Under Pressure! SELL!
My dear friends,
Please, find my technical outlook for EURUSD below:
The price is coiling around a solid key level - 1.1508
Bias - Bearish
Technical Indicators: Pivot Points Low anticipates a potential price reversal.
Super trend shows a clear sell, giving a perfect indicators' convergence.
Goal - 1.1488
About Used Indicators:
The pivot point itself is simply the average of the high, low and closing prices from the previous trading day.
Disclosure: I am part of Trade Nation's Influencer program and receive a monthly fee for using their TradingView charts in my analysis.
———————————
WISH YOU ALL LUCK
Chart Patterns

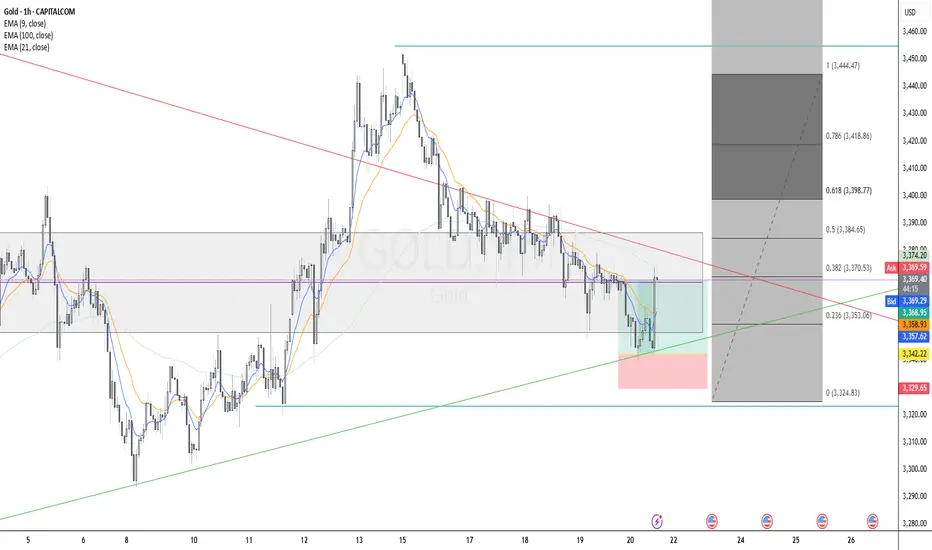
GOLD Long Executed Gold (XAU/USD) Long Setup - H4
Trend Context: Uptrend structure with higher lows respected, price bouncing from ascending trendline support.
Entry Zone: Confluence at 0.236 Fibonacci retracement level, aligned with dynamic support (EMA100) and trendline.
Additional Confluences:
Breakout from recent compression zone.
EMA alignment supportive of bullish momentum (9 EMA crossing above 21 EMA expected).
Risk/Reward: Targeting Fibonacci extensions (1.272 and 1.618), initial RR 2:1.
Time Frame: 4H
Maruthi suzuki long ....Chart Pattern: Volatility Contraction Pattern (VCP)
The chart displays a textbook Volatility Contraction Pattern (VCP), a bullish setup popularized by Mark Minervini.
VCP is characterized by a series of tightening price swings (each dip is shallower than the previous), signaling absorption of supply and a possible explosive breakout when resistance is cleared.
The resistance zone is clearly marked near ₹13,059–₹13,100, with the price currently consolidating just below this level.
Technical Indicators:
MACD (Moving Average Convergence Divergence): The MACD is positive and appears to be crossing above the signal line, supporting bullish momentum.
Volume: The volume pattern shows contraction during pullbacks and should ideally expand significantly on breakout for confirmation.
Moving Averages: Most moving averages (MA20, MA50, MA100, MA200) are in bullish alignment, supporting the uptrend.
RSI (Relative Strength Index): RSI is at 62.12, suggesting bullish momentum but not yet overbought.
Stochastic: Overbought at 98.3, so some caution is warranted for short-term traders.
Breakout and Target Levels:
Breakout Trigger: A daily close above ₹13,100–₹13,150 with strong volume would confirm the VCP breakout.
Targets:
First Target: ₹14,068 (previous swing high and psychological round number).
Second Target: ₹15,025–₹15,200 (projected from the height of the base and marked on the chart).
These targets align with the typical VCP breakout potential, which can yield 20–100% gains over several months if volume confirms the move.
Stoploss Levels:
Recommended Stoploss: Place a stoploss just below the most recent swing low within the pattern, typically around ₹12,400–₹12,500.
This level is just below the last contraction and provides a logical risk point if the breakout fails.....

NRBBEARING
NSE:NRBBEARING
Note :
1. One should go long with a Stop Loss, below the Trendline or the Previous Swing Low.
2. Risk :Reward ratio should be minimum 1:2.
3. Plan your trade as per the Money Management and Risk Appetite.
Disclaimer :
>You are responsible for your profits and loss.
>The idea shared here is purely for Educational purpose.
>Follow back, for more ideas and their notifications on your email.
>Support and Like incase the idea works for you.


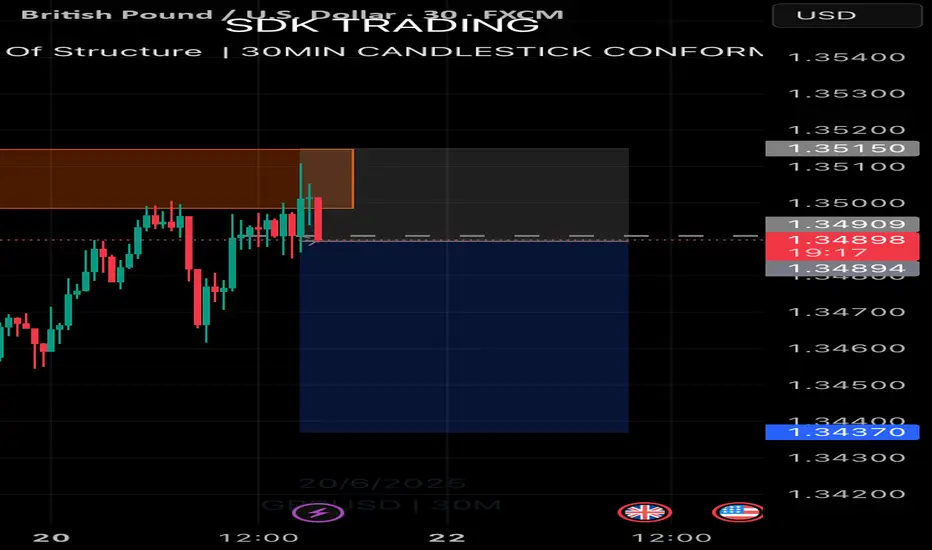
GBPUSD ShortDaily biased is to the downside. Price has retested and rejected a 30min orderblock. There is also a change of character on the 30min timeframe to the downside. Take profit is at 1.3459 and stop loss is at 1. 35150.
ETH -bullish indicationsbearish indications:
LLLH in daily
MA 21 being respected in daily time frame.
Bullish indications:
Trend line resistance is broken and acting as a support now.
Inverted hammer candle from trend line support in 1 hr
formed Inverted head and shoulder formed in 15 min .
Bullish divergence in 15 min.
Trade plan bias long @ 1579
SL:1570
TP1:1589
TP2:1597

USDJPY-bias long Bullish indications:
Major support respected
Inverted HS formation in 15 min time frame.
Inverted hammer candle in 4 hr
Bullish divergence in 1 hr
Trend line resistance broken .
Bearish indications:
Lower lows lower highs.
Trade plan bias long @ 140.815
SL:140.429
TP1:141.300
TP2:141.708

EURCHF -bias long Bullish indications:
Daily Fib level 0.618 respected.
4 hr: Hammer candle from support.
Major support respected at 0.93130
Morning star candle in 1 hr
15 min: formation of head and shoulder in 15 min.
trend line support respected.
AB=CD is complete indicates reversal.
Bearish indications:
Daily :Lower low and lower highs
MA 21 respected the candle indicates possible fall.
Trade plan bias long @ 0.93240
SL:0.93116
TP1:0.93375
TP2:0.93490

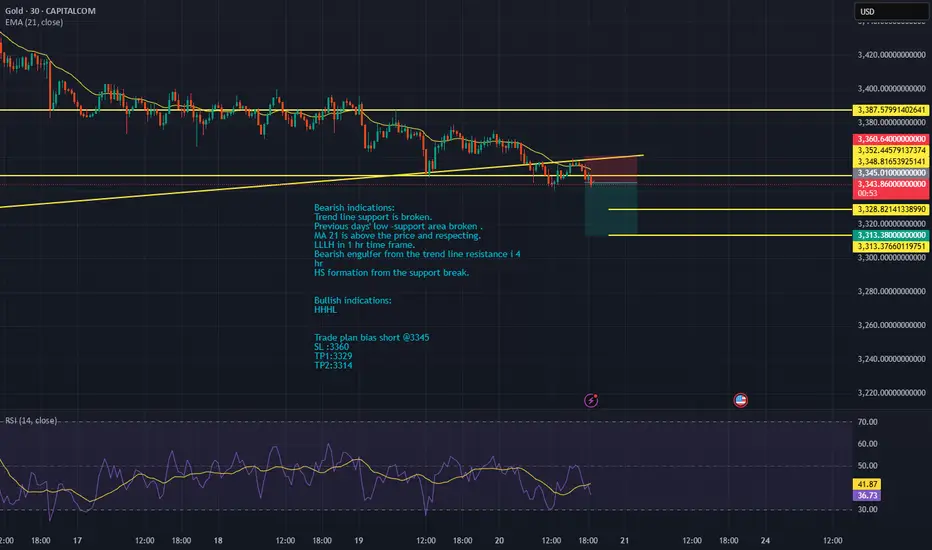
XAUUSD-Bias short Bearish indications:
Trend line support is broken.
Previous days' low -support area broken .
MA 21 is above the price and respecting.
LLLH in 1 hr time frame.
Bearish engulfer from the trend line resistance i 4 hr
HS formation from the support break.
Bullish indications:
HHHL
Trade plan bias short @3345
SL :3360
TP1:3329
TP2:3314
EUR/USD Approaching Key Resistance – Will Bulls Break Through?EUR/USD continues to trade within a strong uptrend, respecting the 50-day SMA while pressing against a key horizontal resistance level around 1.1576. The pair has recently pulled back modestly after testing this level but remains above the short-term moving average, suggesting buyers are still in control.
Technicals provide a mixed, but slightly bullish picture:
Trend Structure: Price action shows a series of higher highs and higher lows since mid-February, confirming a bullish trend.
Moving Averages: The 50-day SMA is above the 200-day SMA (golden cross), and price continues to close above both, reinforcing the bullish bias.
MACD: While flattening, it remains in positive territory – momentum is cooling but not reversing.
RSI: Currently near 59, suggesting bullish momentum without overbought conditions – a healthy zone for a potential continuation higher.
A breakout above the 1.1576 resistance could open the path toward the 78.6% Fibonacci retracement level near 1.1745. However, failure to clear this barrier may invite consolidation or a minor pullback toward the 50-day SMA.
Traders should watch for a daily close above 1.1576 or a bounce from the 50-day SMA to confirm the next directional move.
-MW

XAUUSD is moving within the 3340.00 - 3400.00 range👀 Possible scenario:
Gold prices stayed flat on June 19, as the Fed kept rates unchanged but projected two cuts by year-end. However, Chair Powell warned inflation may stay elevated due to tariffs, limiting room for aggressive easing.
On June 20, gold dipped slightly as investors sold to cover losses elsewhere amid Middle East turmoil. Despite rising tensions—Israel ramping up strikes near Tehran and Iran targeting an Israeli hospital—safe-haven demand weakened on liquidity concerns. Reports suggest President Trump may consider U.S. military action within weeks.
✅Support and Resistance Levels
Support level is now located at 3,340.00.
Now, the resistance level is located at 3,400.00.

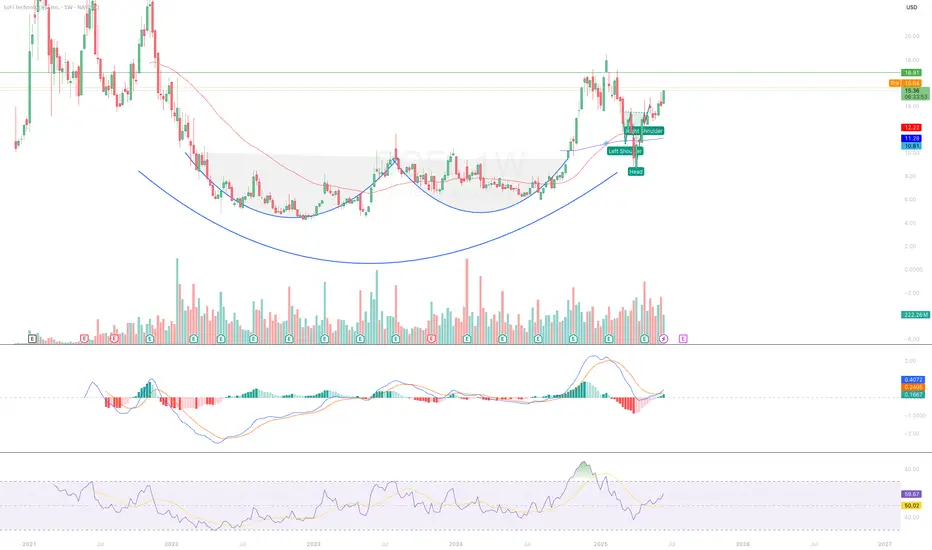
SOFI Classic BUMBUM Breakout !I think I am beginning to like this classic bumbum formation.
NASDAQ:SOFI broke from the classic bumbum formation and retraced back to its support levels at $8.
It has recently started making a bullish reversal move back to $15, in the turn forming an inverse head and shoulder formation.
If the current momentum is sustained and the $16 resistance is cleared; I expect a move towards $23.34.
💼 Position
Type: SOFI 15 Call
Expiry: July 11, 2025
Quantity: 10
Average Cost Basis: $0.58
Date Purchased: June 10, 2025
Last Price: $1.01
Total % Gain/Loss: +75%
EURUSD is moving within the 1.14000 - 1.16330 range👀 Possible scenario:
The euro inched up near 1.1500 on June 19, supported by safe-haven flows as Israel-Iran tensions deepened and fears of U.S. involvement grew. Despite slight euro strength, demand for the U.S. dollar remained firm following the Fed’s decision to hold rates and warn of near-term inflation risks driven by Trump’s tariffs. The Fed also forecast slower growth and reaffirmed expectations for two rate cuts in 2025.
Markets now await U.S. data for further rate clues, while attention stays on the Middle East as Trump reportedly issued Iran a final ultimatum to avoid conflict.
✅ Support and Resistance Levels
Now, the support level is located at 1.14000
Resistance level is located at 1.16330

BIG PUMP ON GRASS COIN THAT NOONE TALKS ABOUTGRASS is setting up for a major reversal from this falling wedge structure. After a prolonged downtrend, price has now reached the apex of a well-defined descending wedge, supported by a key ascending trendline. This area is shaping up as a high-probability buy zone.
On the chart, we can see price respecting both wedge boundaries and now reacting to the lower support line. This is a classic setup where breakout potential increases significantly. The compression of price action inside the wedge suggests a strong move is imminent.
Looking at Market Cipher B, momentum is showing a clear bullish divergence. Multiple green dots have printed on the oscillator, and money flow, while still negative, is beginning to curve upward. These are early signs that sellers are losing control and buyers are stepping in with strength.
Volume has also dried up on this last leg down, which is typical in wedge structures before a breakout. Low volume near support and divergence on a trusted indicator often marks the beginning of a trend reversal.
From a risk-reward perspective, this setup offers a strong opportunity. A break above the descending resistance could propel price toward the previous key resistance levels around the $3.40 zone. Always place your take profit just below major levels to ensure execution.
Leave your thoughts in the comments. Are you long here or waiting for confirmation? This is not a trade setup, no stop-loss or take-profit is shared publicly. Trade with discipline and confidence.

MNHLDG 4H Chart Analysis & Trading Plan SummaryBased on the 4-hour TradingView chart for MNHLDG, the stock is currently trading near RM1.30 and showing signs of attempting a retest towards its previous high near RM1.40. However, looking at the overall setup, we anticipate a possible short-term pullback before any potential breakout occurs.
Key Observations:
Trend & Structure: The stock has been trending upward with higher lows and is currently trading within a consolidation zone between RM1.25 and RM1.30. The horizontal resistance at RM1.30 has been tested multiple times, indicating seller presence at this zone.
Volume: Volume remains relatively flat with no significant surge, suggesting cautious accumulation rather than strong breakout momentum.
Indicators:
RSI is hovering just below the overbought region (~60), suggesting that while momentum is positive, a short breather may happen.
Stochastic Histogram shows a weakening bullish crossover and may begin to flatten or dip soon, supporting the pullback scenario.
Bollinger Bands are tightening slightly, implying upcoming volatility but not necessarily an immediate breakout.
Support Zones:
RM1.25 (minor support and previously tested level).
RM1.21 (more significant support — also in confluence with the mid-Bollinger line and prior swing low).
Resistance: RM1.30 (immediate), followed by RM1.40 (ATH).
Trading Plan:
Entry Zone (Accumulation Area):
RM1.25 to RM1.21 (look for bullish reversal candle or bounce confirmation).
Profit Target (TP):
TP1: RM1.30 (first resistance, quick trade opportunity).
TP2: RM1.40 (all-time high — strong resistance).
Stop Loss (SL):
Below RM1.18 (under previous swing low — invalidates the bullish structure).
Risk-Reward:
From RM1.22 entry, SL at RM1.18 and TP at RM1.40 offers a solid 4.5:1 reward-to-risk setup.
Summary:
MNHLDG shows a healthy uptrend with a potential for new highs, but current indicators suggest a temporary pullback could occur before the next leg up. A more ideal entry would be near RM1.22–1.25 support zone, riding the wave towards RM1.30 and possibly RM1.40. Be patient for a proper setup confirmation.
Disclaimer: This analysis is for educational purposes only and does not constitute a buy or sell recommendation. I am not affiliated with any brokers or advisory firms.

EURNZD Will Go Higher From Support! Buy!
Take a look at our analysis for EURNZD.
Time Frame: 1h
Current Trend: Bullish
Sentiment: Oversold (based on 7-period RSI)
Forecast: Bullish
The market is on a crucial zone of demand 1.922.
The oversold market condition in a combination with key structure gives us a relatively strong bullish signal with goal 1.930 level.
P.S
We determine oversold/overbought condition with RSI indicator.
When it drops below 30 - the market is considered to be oversold.
When it bounces above 70 - the market is considered to be overbought.
Disclosure: I am part of Trade Nation's Influencer program and receive a monthly fee for using their TradingView charts in my analysis.
Like and subscribe and comment my ideas if you enjoy them!

DAX: Target Is Up! Long!
My dear friends,
Today we will analyse DAX together☺️
The recent price action suggests a shift in mid-term momentum. A break above the current local range around 23,435.79 will confirm the new direction upwards with the target being the next key level of 23,572.93 and a reconvened placement of a stop-loss beyond the range.
❤️Sending you lots of Love and Hugs❤️

AAVE BINANCE:AAVEUSDT.P
Aave (AAVE) Comprehensive Update - Data as of June 20, 2025
Recent Technical and Protocol Developments
- Latest Protocol Upgrades
- Automated Security Module Upgrade (June 5, 2025): An automated risk management system for covering non-performing debt using token staking.
- Launch of the Aave v3 Marketplace on the Soneium Chain (June 3, 2025): Expanding coverage to 6 million wallet addresses.
- Aave v3.3 Improvements (February 24, 2025): Improvements to the liquidation mechanism and unsecured loan management.
- Supported Networks: 14+ networks, including Ethereum, Polygon, BNB Chain, Celo, ZKsync, and new Layer 2 networks such as Linea zkEVM.
Key Protocol Performance Metrics
Total Value Locked (TVL) | $25.58 billion
Average Yield Per Deposit (APY) | ~5% (for Stablecoin on Ethereum)
Trading Volume (30-Day) | Billions of Dollars
GHO Issued Supply | 1+ Billion (130% Collateralization)
---
Recent News and Initiatives
Token Buyback Approval: The Aave DAO community has agreed to purchase $4 million of AAVE tokens to support the price.
Partnership with Ant Digital Technologies: To develop a Real-World Asset (RWA) marketplace on Ethereum.
Ripple's RLUSD Integration: RLUSD Stablecoin Supports Borrowing and Depositing in the Aave Protocol.
Network Growth Rise: 20% Increase in DeFi Market Share Through May 2025.
---
Technical Analysis and Forecasts
Current Trend
- Strong Rise from $114 (April) to $312 (June) (+180%).
- Technical resistance at $266, strong support at $250.
Short-Term Outlook
- Potential growth of +20–50% if the $266 resistance is broken, targeting $320–$350 (based on a V-shaped recovery pattern).
- Positive Indicators: Declining exchange balances, increasing institutional demand.
Potential Risks
- Market Volatility: -15% drop in 4 days in May due to selling pressure, but the recovery was rapid.
- Dependence on Ethereum performance: 95% of TVL is on ETH-pegged networks.
- Competition from DeFi protocols: such as Pendle and Compound, especially in yield markets.
---
💎 Conclusion
Aave shows strong growth in 2025 with technical expansion (new networks, security upgrades), increased adoption (record TVL, enterprise partnerships), and positive price indicators. The main challenges are market volatility and competition, but initiatives such as buybacks and the RWA merger are boosting investor confidence. It is recommended to monitor the $250 (support) and $266 (resistance) levels for entry/exit timing.

Genworth Financial Inc. (GNW) Serves Aging BoomersGenworth Financial Inc. (GNW) is an insurance holding company offering long-term care, life insurance, and annuity products. With decades of experience, Genworth supports individuals planning for aging and retirement needs. The company’s growth is driven by an aging population, increased focus on financial security in retirement, and demand for long-term care coverage as healthcare costs rise.
On the chart, we see a confirmation bar with increasing volume, indicating strong interest. The price has entered the momentum zone by moving above the .236 Fibonacci level. A trailing stop can be placed just below that level using the Fibonacci snap tool to manage risk while riding upward momentum.

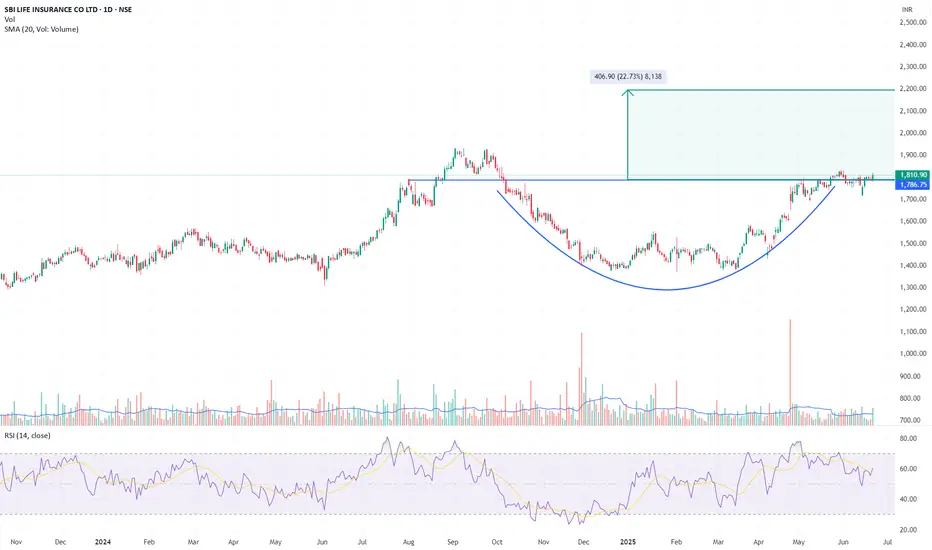
SBI Life – Long-Term Base Breakout, Targeting ₹2,200Chart Context:
SBI Life has broken out above a long-term horizontal resistance at ₹1,786 after forming a rounded accumulation base over ~10 months. Breakout was confirmed with above-average volume and a successful retest.
Trade Setup:
Breakout level (neckline): ₹1,786.75
Breakout candle close: ₹1,810.90 (+1.20%)
Target: ₹2,200 (22% upside from breakout)
Stop-loss: ₹1,745 (just below retest lows)
Risk-reward: ~1:3
Volume & RSI:
Volume > 20-day average
RSI > 60 and rising, confirming strength
Strategy:
Initiate long with partial position now. Add on dips toward ₹1,775–₹1,780 with tight stop. Trail SL if price sustains above ₹1,850. Reassess at ₹2,050–₹2,100 zone.
Disclaimer:
Not a recommendation. This idea is based on technical patterns and is meant for educational purposes. Do your own due diligence.
EGX30 in a Lower RegionEGX30 stock is currently in a decreasing region. It's expected to rebound as historically on the short term it didn't brak the support line 30,238.217. Accordingly, it's expected to rebound to reach the resistance line 30,604.998 to reach then 2nd at 30,690.58 then the third at 30,739.484

Buy XAUUSDBuy XAUUSD here around 3347 considering the formation of this inverted head and shoulders pattern. Price should range between 3350 and 3360 for the next few hours
