HolderStat┆BTCUSD ready for the next leg upBINANCE:BTCUSDT on the 3h chart is showing a textbook sequence of consolidation phases, each acting as a launchpad for further gains. The price action is respecting both the ascending and horizontal support lines, with each dip being bought up quickly. The current consolidation is forming a tight triangle, indicating that volatility is about to return. The structure favors a bullish breakout, with the next resistance levels at 107,000 and 110,000. As long as BTC holds above the 104,000 support, the uptrend remains strong and the probability of a new rally is high.
Chart Patterns

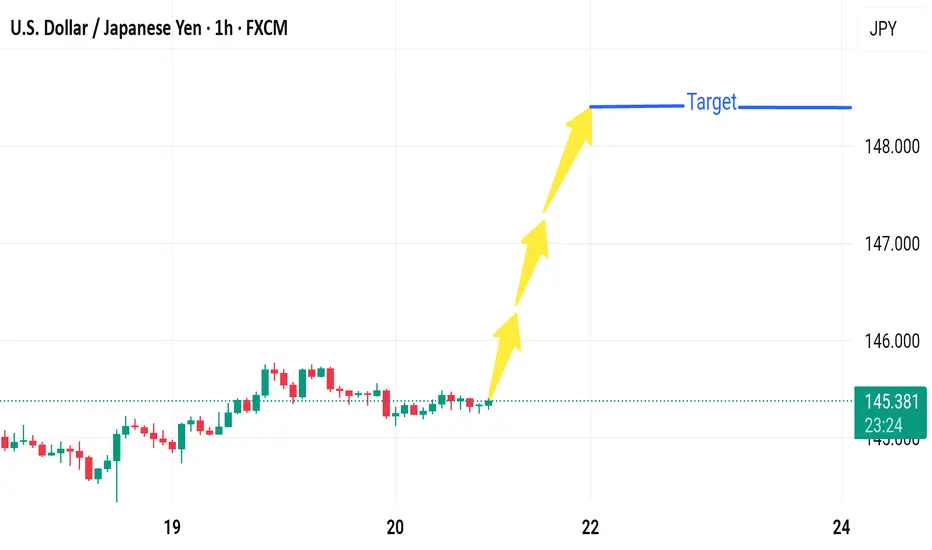
Market next move 🔻 Disruptive Analysis – Bearish Scenario
1. Resistance Rejection:
Price has stalled around 145.40, showing hesitation.
The target area (~148.000) hasn't been tested yet, and prior attempts to break higher may face heavy resistance from institutional sell orders or prior supply zones.
2. Range-Bound Structure:
Current price action shows consolidation — multiple small-bodied candles.
Lack of volume or momentum may indicate accumulation or distribution — not necessarily a bullish breakout setup.
3. Potential Bearish Triggers:
If price breaks below 145.00, a short-term bearish move could occur toward:
144.30 – recent swing low support.
143.80 – demand zone based on prior accumulation.
4. Macro Disruptors:
Surprise BoJ intervention or hawkish policy tone could strengthen the Yen.
A dovish Fed statement or poor U.S. economic data could drag USD down sharply.
---
📉 Alternate Scenario Chart Sketch (Hypothetical):
148.000 ──────── (Target denied - strong resistance)
↑
Rejection
↓
145.000 ──────── (Breaks support)
↓
144.300 ──────── (First bearish target)
↓
143.800 ──────── (Deeper retracement zone)
HolderStat┆ETHUSD ascending channel strengthBINANCE:ETHUSDT on the 16h chart is showing a robust uptrend, with price action contained within an ascending channel. Each consolidation has led to a breakout, and the current price is bouncing off the lower channel support. The pattern of higher lows and strong rebounds from support levels indicate that bulls are in control. The next resistance is at 3,200, and a breakout above this could open the way to 3,400 and beyond. The technicals support a bullish continuation as long as ETH holds above 2,400.

DOGE - At heavy volume rangeDOGE - At heavy volume range!
DOGE is at the heavy volume range on VRVP.
Great time to buy IMO.

Botify / UsdtGATEIO:BOTIFYUSDT
### 📊 **Support & Resistance Levels Marked:**
🟩 **Support Zones:**
* **0.009482 – 0.011000** (Current support zone being tested/held)
* **0.005363** (Major lower support zone)
🟥 **Resistance Levels:**
* **0.013359** (First resistance)
* **0.018539** (Second resistance)
* **0.023175** (Third resistance)
---
### 🔍 **Current Market Behavior:**
* Price **broke above** the red descending trendline ✅
* **Support is holding** well around **0.011** level 🛡️
* Sideways consolidation with small bullish candles forming (possible accumulation phase) 📈
---
### 📈 **What’s Next?**
If the **price continues holding above the support zone (0.0095–0.011)** and breaks recent short-term highs:
➡️ We could see a potential **move toward the first resistance at 0.013359**
➡️ Breakout above that may push the price to **0.018539** next 🧗
---
### ⚠️ **Important Reminder:**
> This is **not financial advice** – always do your own research and manage risk responsibly! 💼📉

HolderStat┆SOLUSD ready for channel breakoutBINANCE:SOLUSDT on the 16h chart is showing a transition from consolidation to a growing channel, followed by a falling channel correction. The price is holding above key support, and the technicals indicate that a breakout above 150 could see SOL test the 170–180 zone. The bullish scenario remains in play as long as SOL stays above 135.

Stoxx50 Bearish reversal resistance at 5,325The Stoxx50 equity index is exhibiting bearish price action sentiment, consistent with the prevailing downtrend. Recent movements show signs of a corrective pullback, suggesting temporary relief within a broader downward structure.
Key Technical Levels:
Resistance:
5,325 – Critical resistance level; previously acted as an intraday consolidation zone.
5,384 – Intermediate resistance following a breakout.
5,500 – Key psychological and technical level; previous swing high.
Support:
5,150 – Initial downside target if the pullback fails.
5,090 – Secondary support, aligning with past reaction lows.
5,040 – Long-term support level, near a broader demand zone.
Scenario Analysis:
Bearish Continuation (Base Case):
A rally toward 5,325 that fails to produce a sustained breakout, followed by a bearish rejection, would confirm the corrective nature of the current bounce. This scenario reinforces the downside bias, targeting a decline toward 5,150, then 5,090, and potentially 5,040 over a longer timeframe.
Bullish Reversal (Alternative Scenario):
A confirmed breakout above 5,325, especially with a daily close above this level, would invalidate the immediate bearish outlook. This would shift sentiment to neutral-bullish, opening the door for a potential retest of 5,384 and an extended rally toward the 5,500 level.
Conclusion:
The technical structure of the Stoxx50 remains bearish in the short to medium term, with current price action reflecting a corrective rally rather than a trend reversal. Traders should watch the 5,325 level closely: failure to break above it reinforces downside potential, while a decisive breakout could signal a shift toward a bullish recovery.
This communication is for informational purposes only and should not be viewed as any form of recommendation as to a particular course of action or as investment advice. It is not intended as an offer or solicitation for the purchase or sale of any financial instrument or as an official confirmation of any transaction. Opinions, estimates and assumptions expressed herein are made as of the date of this communication and are subject to change without notice. This communication has been prepared based upon information, including market prices, data and other information, believed to be reliable; however, Trade Nation does not warrant its completeness or accuracy. All market prices and market data contained in or attached to this communication are indicative and subject to change without notice.

CAD/JPY Forecast tight Sl
Price Structure & Key Levels
1. Resistance Zone:
- 106.000–106.122: Strong resistance cluster.
- 106.122 (swing high) and 106.000 (psychological barrier) are critical.
- Price rejection here suggests bearish pressure.
2. Immediate Support:
- 105.800–105.900: Near-term demand area.
- A break below 105.800 opens downside toward 105.600 (next support).
3. Critical Floor:
- 105.600: Major support.
- Loss of this level could accelerate declines toward 105.300–105.400.
Market Sentiment & Momentum
- Bearish Bias:
- Lower highs (106.122 → 106.000 → 105.900) indicate selling momentum.
- Price trading below 106.000 (psychological pivot) reinforces downside control.
Tactical Trade Setups
- Short Entries:
- Ideal near 106.000–106.122 (stop-loss above 106.200).
- Target: 105.600→ 105.300.
- Long Entries:
- Only if price holds 105.600 with reversal signals (e.g., bullish pin bar).
- Target: Scalping toward 105.900–106.000.
Always confirm with volume/RSI divergence and economic calendars. Trade safe! 🚀

6/20 Gold Analysis and Trading SignalsGood evening, everyone!
After gold rallied to around 3388 yesterday, it began to retrace gradually, providing solid returns for our sell-side strategy.
As of now, gold has dipped to a session low near 3339. On the 30-minute chart, the MACD has formed a bullish crossover, and price has broken above the Bollinger mid-band, indicating short-term bullish momentum. The candle structure supports a potential rebound, but strong overhead resistance remains.
Key resistance comes from the 1H MA60 around 3371, and gold still trades within a broader bearish trend on the daily timeframe. While bulls may attempt a recovery, a complete trend reversal remains unlikely unless significant bullish catalysts emerge.
Hence, our strategy continues to favor selling near resistance levels, while cautiously considering long entries near well-defined supports.
📌 Trading Plan (VIP Focus):
✅ Sell Zone: 3370–3383
✅ Buy Zone: 3338–3321
✅ Flexible Trade Range: 3366-3349

Just got a call from Trump. I'm not gonna say anything.I'm an insider. You have time. Last chance of generational wealth.
Trust me I'm a deep insider.

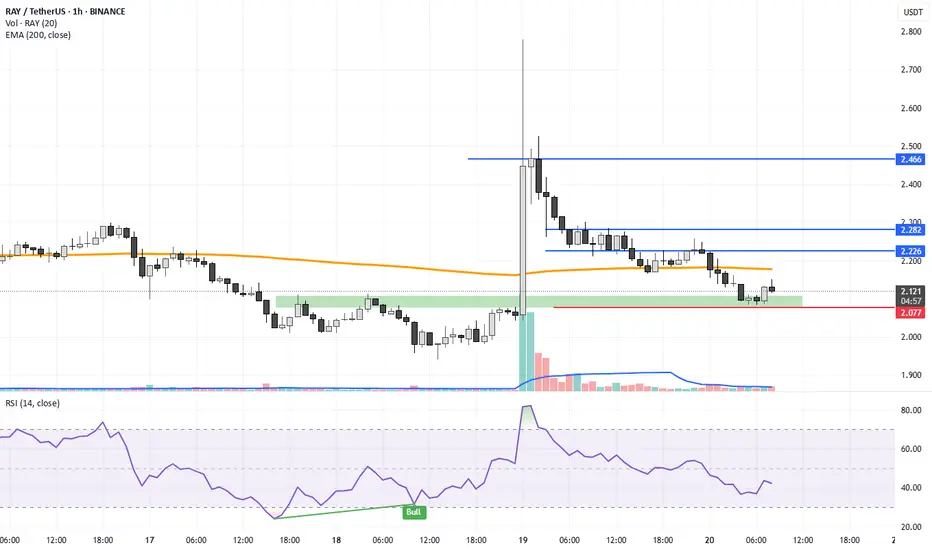
SHORT ETH🔷 Setup Summary: SFP + Key Volume Combo
1. Context:
Pattern: Double Top + SFP (Swing Failure Pattern)
Timeframe: Likely M15–H1 (possibly during Asian/European session)
Background: Price breaks previous high slightly (liquidity grab), then sharply reverses — a clear trap.
2. Confirmation:
A clear Key Volume candle appears at the top — signaling market maker action.
A strong rejection candle (pinbar or engulfing) confirms the SFP.
Price fails to hold above the new high — trap confirmed.
3. Entry Strategy:
Entry: After the SFP confirmation candle closes.
Stop Loss: Above the SFP high or Key Volume wick (a “valid” SL, not necessarily tight).
Take Profit:
Short-term: 3R (if trading intra-session).
Long-term: Target demand zone or Daily support if trend supports it.
4. Risk Management (per system guidelines):
Max risk per trade: 1–2% of account.
If setup invalidates: cut the loss immediately, don’t widen SL or overtrade.

Polkadot (DOTUSD) is getting closer to a scary levelPolkadot ( MARKETSCOM:DOTUSD ) is coming closer to the current lowest point of this year. If it surpasses that area, then this would place the crypto in the area, last seen five years ago, bringing it closer to inception price.
Let's dig in...
CRYPTO:DOTUSD
Let us know what you think in the comments below.
Thank you.
77.3% of retail investor accounts lose money when trading CFDs with this provider. You should consider whether you understand how CFDs work and whether you can afford to take the high risk of losing your money. Past performance is not necessarily indicative of future results. The value of investments may fall as well as rise and the investor may not get back the amount initially invested. This content is not intended for nor applicable to residents of the UK. Cryptocurrency CFDs and spread bets are restricted in the UK for all retail clients.

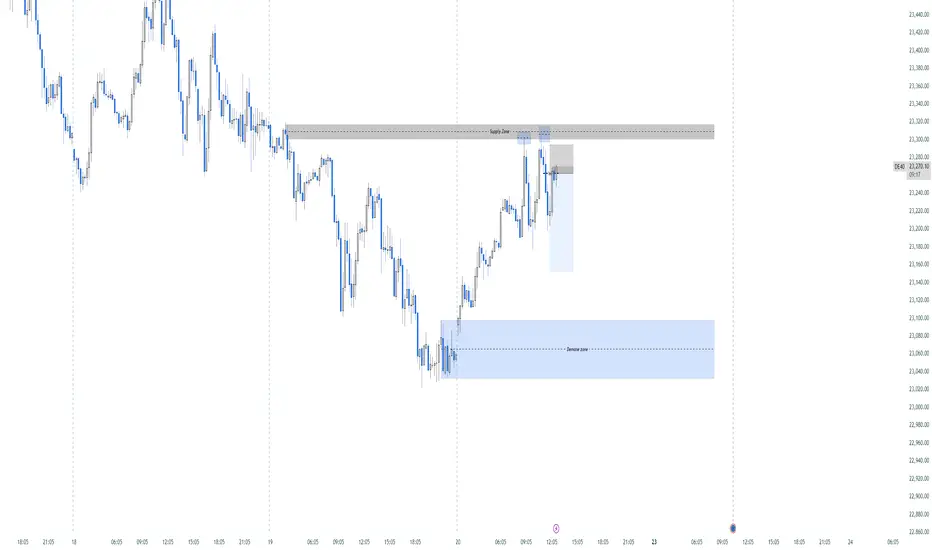
Possible Sell On Dax. Every thing taken into account, dax could shortly see a sell, given that a 1h Supply zone and 5 minute candles were rejected twice.
FTSE INTRADAY bullish sideways consolidation Trend Overview:
The FTSE100 equity index remains in a bullish trend, characterised by higher highs and higher lows. The recent intraday price action is forming a continuation consolidation pattern, suggesting a potential pause before a renewed move higher.
Key Technical Levels:
Support: 8800 (primary pivot), followed by 8760 and 8700
Resistance: 8940 (initial), then 8977 and 9010
Technical Outlook:
A pullback to the 8800 level, which aligns with the previous consolidation zone, could act as a platform for renewed buying interest. A confirmed bounce from this support may trigger a continuation toward the next resistance levels at 8940, 8977, and ultimately 9010.
Conversely, a daily close below 8800 would suggest weakening bullish momentum. This scenario would shift the bias to bearish in the short term, potentially targeting 8760 and 8700 as downside levels.
Conclusion:
FTSE100 maintains a bullish structure while trading above the 8800 support. A bounce from this level would validate the consolidation as a continuation pattern, with upside potential toward the 8940 area. A breakdown below 8800, however, would invalidate this view and suggest deeper corrective risk.
This communication is for informational purposes only and should not be viewed as any form of recommendation as to a particular course of action or as investment advice. It is not intended as an offer or solicitation for the purchase or sale of any financial instrument or as an official confirmation of any transaction. Opinions, estimates and assumptions expressed herein are made as of the date of this communication and are subject to change without notice. This communication has been prepared based upon information, including market prices, data and other information, believed to be reliable; however, Trade Nation does not warrant its completeness or accuracy. All market prices and market data contained in or attached to this communication are indicative and subject to change without notice.

The Day AheadFriday, June 20 – Key Economic Data & Central Bank Events
United States
Philadelphia Fed Business Outlook (June) – Regional manufacturing sentiment indicator.
Leading Economic Index (May) – Composite of 10 leading indicators, used to forecast future economic activity.
China
1-Year & 5-Year Loan Prime Rates – Benchmark lending rates set by the PBoC; key for signaling monetary policy stance.
United Kingdom
GfK Consumer Confidence (June) – Measures households’ economic sentiment.
Retail Sales (May) – Key consumer spending metric.
Public Sector Net Borrowing (May) – Government fiscal position.
Japan
National CPI (May) – Headline and core inflation data, relevant for BoJ policy stance.
Germany
Producer Price Index (PPI, May) – Upstream inflation measure, potential signal for consumer price trends.
France
Business Confidence (June) – Insight into industrial sentiment.
Retail Sales (May) – Consumer activity and domestic demand tracker.
Eurozone
Consumer Confidence (June, flash) – Early indication of household sentiment across the bloc.
M3 Money Supply (May) – Broad monetary aggregate, important for ECB’s inflation monitoring.
Canada
Retail Sales (April) – Key consumer spending indicator.
Industrial Product Price Index (May) – Measures price changes for goods sold by manufacturers.
Central Banks
ECB – Publishes its Economic Bulletin, offering insights into economic conditions and policy outlook.
Bank of Japan (BoJ) – Governor Kazuo Ueda speaks; markets will watch for commentary on yield curve control, inflation expectations, and timing of policy normalization.
This communication is for informational purposes only and should not be viewed as any form of recommendation as to a particular course of action or as investment advice. It is not intended as an offer or solicitation for the purchase or sale of any financial instrument or as an official confirmation of any transaction. Opinions, estimates and assumptions expressed herein are made as of the date of this communication and are subject to change without notice. This communication has been prepared based upon information, including market prices, data and other information, believed to be reliable; however, Trade Nation does not warrant its completeness or accuracy. All market prices and market data contained in or attached to this communication are indicative and subject to change without notice.

Gold (XAU/USD) 4-Hour Analysis- 20 June 2025On the 4-hour chart, gold has been trading in a fairly wide range.
The market has not clearly broken down, and many analysts see it as still structurally bullish as long as key support holds. Currently price is pulling back toward a confluence of support around $3,353–$3,355 (a zone overlapping a trendline and prior demand).
In other words, buyers have defended roughly the 3,340–3,355 area recently. Resistance lies just above in the $3,370–$3,380 region, with a major psychological pivot at $3,400. One analyst notes gold is “boxed between resistance at $3,450 and support at $3,340–$3,335”, so the immediate bias depends on these zones.
A clean break above 3,380–3,400 would signal bullish continuation (targeting 3,450+), while a drop below the 3,340–3,350 support zone would shift the bias bearish.
Overall, the market structure on H4 is mixed-to-bullish: we see higher swings in larger timeframes, and only a minor short-term down leg so far. As one analysis notes, gold remains “structurally bullish” and an upside break could chase the $3,500–$3,550 area.
Key Zones and Levels (4H)
Strong Support (Demand) Zone: ~$3,340–$3,355. This zone (around the recent swing lows) has attracted buying. Analysts mark $3,350–$3,355 as a key buy zone. Breaking below ~$3,340 would be a warning, putting 3,300 as the next floor.
Supply Zone / Resistance: ~$3,370–$3,380. This is the near-term resistance cluster (multiple analysts cite 3,370–3,380 as key). A rejection here would keep gold rangebound.
Major Pivot: $3,400. This round number is acting as an important hurdle. A decisive close above $3,400 would open the door to the $3,434–$3,450 area (prior highs). Conversely, failure at $3,400 can push price back toward the support zone.
Larger Resistances: If the uptrend resumes, look to ~$3,450 (April swing high) and beyond. Many long-range targets point to $3,500+ in a strong bull move.
Secondary Supports: Below the main support zone, watch ~$3,300 and down at $3,281 (the 50-day moving average). These act as deeper floors if weakness continues.
4-Hour Bias
In plain terms, as long as $3,340–$3,355 holds as support, the bias tilts bullish or neutral. We can say bullish bias above that zone: buyers will look to enter on pullbacks there. If price stays under $3,370, gains will likely be capped short-term. A break above $3,380/$3,400 would confirm a bullish breakout. On the flip side, a break below $3,340 shifts us to a bearish bias, with attention turning to lower support levels. On indicators, shorter-term momentum has eased (recent RSI is flattening around 60), suggesting some fatigue. But the longer-term trend is up, supported by strong safe-haven demand (central bank buying, geopolitical risk).
In summary: neutral-to-bullish on 4H, favor buyers near support but cautious near overhead supply.
Intraday (1H) Setups
Zooming into the 1-hour chart, we look for trades that align with the above bias. The clearest setups involve buying around demand zones and selling near supply areas:
Buy the Dip (~$3,344–$3,355): Wait for gold to dip into the 3,340–3,350 area. If you see a bullish price-action signal (e.g. a clear hammer or bullish engulfing candle), that’s a potential buy. Place a stop just below (~$3,335). Initial targets are around $3,370–$3,380 (near resistance). For example, one analysis suggests: “Buy XAU/USD at 3,344–3,348, TP 3,365–3,370, SL 3,335”.
Sell the Rally (~$3,375–$3,380): If price runs up to $3,375–$3,380 and shows signs of stalling (e.g. bearish candle), consider a short. Stop would be just above (~$3,385), with a target back down toward $3,355–$3,360 or the 1H demand zone. (One example from analysis: “Sell XAU/USD at 3,375–3,380, TP 3,355–3,360, SL 3,385”.) This aligns with fading the high of the range.
Breakout Strategy: If momentum is strong and gold breaks convincingly above ~$3,380–$3,400 on the 1H, one can enter long on the breakout. The next resistances are ~$3,434 and $3,450.
Stops should be very tight in that case (just under the breakout candle).
Risk Management: Keep position sizes small (1–2% risk). Use stops under/above the structural levels. Always wait for a clear 1H candle signal before pulling the trigger, to avoid false moves.
Key 1H levels: We can cite the strong short-term zones: support ~$3,344–$3,348 and resistance ~$3,375–$3,380.
If price skims these areas, watch carefully for a signal to buy or sell as described above. If 1H breaks below $3,340, be ready for a move toward the lower demand zone (around $3,335) or even $3,300–$3,280.
Takeaway
Gold is currently trading between ~$3,340 and $3,380 on the 4H chart. The simplest guidance is to trade the range: buy on dips near $3,340–$3,355 with stops just below, aiming for the $3,370–$3,380 area, and sell near $3,375–$3,380 if rallies stall. Maintain a bullish tilt as long as that $3,340+ support holds, but be ready to switch bearish if gold decisively closes under ~$3,340.
Single Takeaway: Treat ~$3,340–$3,355 as a key demand zone – a bounce here would be a high-probability long entry (targeting $3,370–$3,380), whereas a break below would turn the bias lower.

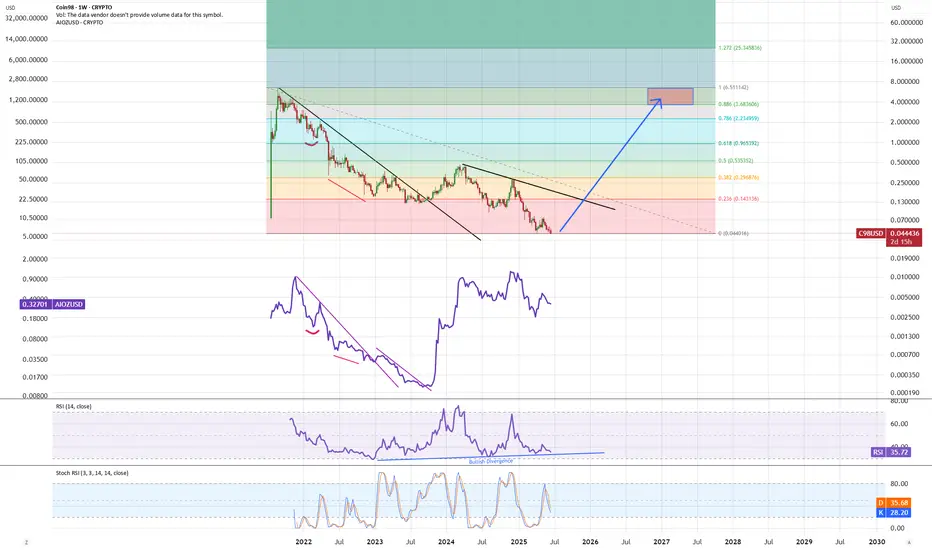
C98 - time to reverseC98 is oversold, with bullish divergence and pattern similar to AIOZ before it reversed. I am expecting bounce up and push up to test August 2021 pivot at ATH range.
Trendline strategy for Gold on H1 chart.Trendline strategy is simple and easy to undertand. Trendlines are support and resistance.
An upward break of a trendline indicates bullish momentum. A downward break of a trendline indicates bearish momentum. Let the active candle close before placing the trade.

Uptrend on the market The market broke the zone before and it retraced back in the zone now it's gaining momentum going up...the is possibility it will reach 1.35300

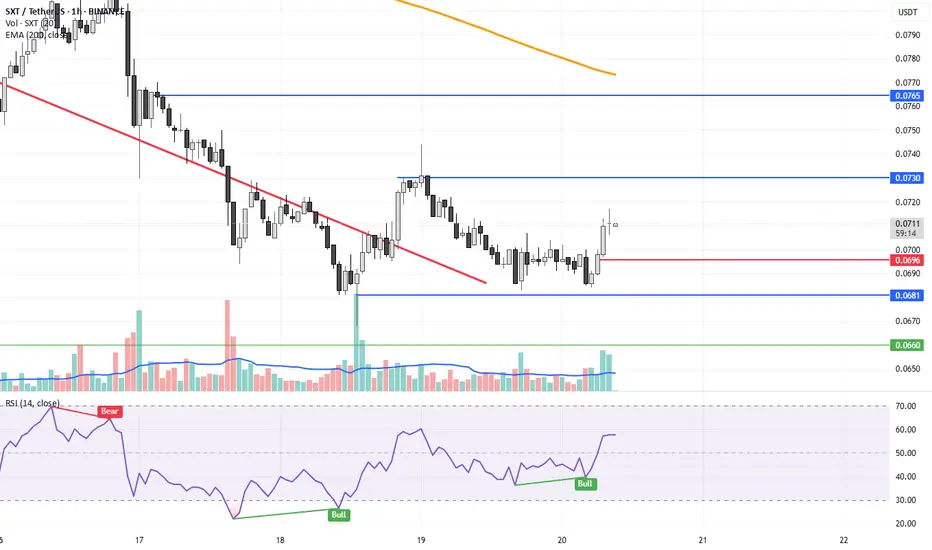
SXT usdtbuy 0.0705 0.0718
sell 0.073 - 0.0765
small stop loss 0.0696
New token available on binance
Spot trade only
Dodo usdtBuy 0.0395 - 0.0405
Sell: 0.042 - 0.043
STOP 0.0388
it's above on his resistance box.
taking support also.
Spot trade