Chart Patterns
NZDCHF at Key Decision Zone – Daily Trend in FocusMonitoring NZDCHF for a reaction at this key zone.
We are approaching a confluence area with:
• Retest of ascending daily trendline support
• Structure support on the 1H timeframe
• Price hovering around the EMAs, potential rejection forming
🟢 Bullish Bias: If price holds above 0.4870–0.4880 and breaks 0.4913, I expect continuation towards 0.4934.
🔻 Bearish Scenario: Clean break and close below 0.4870 could signal a shift in momentum with targets at 0.4831 and below.
📅 Trend still bullish on the daily, so watching for signs of exhaustion or continuation here.
Let me know your thoughts — are you team bull or team bear?

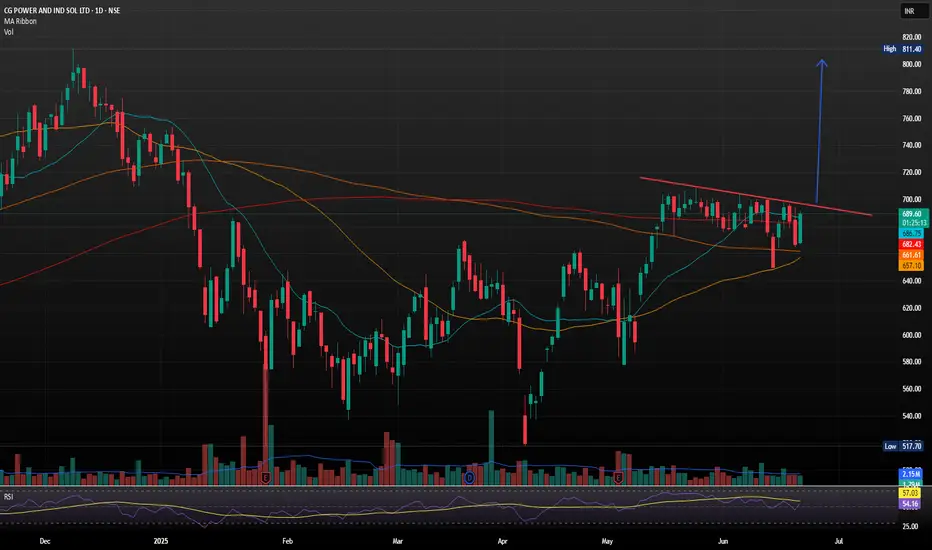
CG Power and Industrial Solutions with Strong Bullish Flag SetupCG Power and Industrial Solutions just landed its largest-ever single order a 641 crore contract from Power Grid Corporation of India Ltd (PGCIL) for high-voltage transformers and reactors
The company, now under the Murugappa Group, reported consolidated FY25 revenues of 9,909 crore. However, annual profit dipped to 972.98 crore from 1,427.61 crore in FY24, despite a strong Q4 showing with a 17% YoY rise in net profit to 274.26 crore.
- Inverse Head & Shoulders Breakout: The stock recently broke out of an inverse H&S pattern, a classic bullish reversal signal, with strong volume confirmation. Holding above 690 could push it toward 750 TO 800.
Support & Resistance Levels
- Support: 663–679 demand zone
- Resistance: 694, 704 and 712
Trend Summary
- Short-Term: Neutral to bullish
- Medium-Term: Bullish bias if it sustains above 690
- Volatility: Elevated, so expect sharp swings
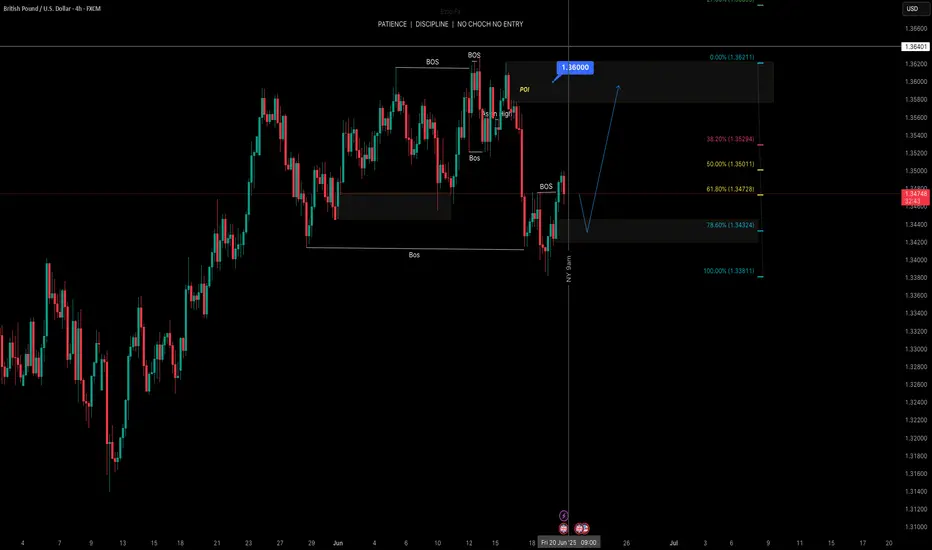
Idea on a ChartGBP/USD found a slight rebound to muscle back above 1.3450 on Thursday.
Despite near-term Greenback strength on geopolitical concerns, markets took a break during the midweek US holiday session.
Israel-Iran tensions continue to rise, and the Trump administration is drawing out a decision on getting involved directly.
GBP/USD found some room on the high side on Thursday, climbing back above the 1.3450 level after catching an early technical bounce from the 1.3400 handle. Broad-market flows have favored the US Dollar recently as Middle East tensions continue to rise, but US markets were dark for a national holiday on Thursday, giving Cable some room to breathe and easing off of USD bidding.
WELCORP - A case study in smart money accumulationHypothesis:
Historically, metal stocks have shown strong rallies following interest rate cuts. This is based on the premise that lower rates stimulate economic activity, driving demand for industrial metals and commodities. With the potential for a rate-cut cycle on the horizon, this creates an actionable setup for accumulation before a broader uptrend unfolds.
Strategy: “Accumulate the Red”
We propose an accumulation strategy tailored for this macro setup:
Accumulate 5–10% of your intended position on every red daily candle where the stock declines by more than 1%.
This allows for scaling into weakness, which historically has provided the best reward-to-risk entry points in these cyclical turnarounds.
Why This Works
Macro Tailwinds: Once interest rates peak, the cost of capital drops, benefiting infrastructure and industrial sectors.
Sentiment Mismatch: Market tends to remain overly bearish during the initial leg of a pivot, creating undervaluation.
Risk Management: Accumulating on red candles avoids chasing momentum and distributes entry risk.

USDJPY | BullishUSDJPY is in bullish continuation pattern with ascending channel formation and bullish divergence on RSI.

Gold Slumps Sharply – Has the Rate-Cut Hope Faded?Gold prices are under intense selling pressure after the Bank of England, the Swiss National Bank, and the Federal Reserve all decided to keep interest rates elevated. This unified stance underscores persistent inflation concerns, driving up the opportunity cost of holding non-yielding assets like gold. As a result, investors rushed to take profits, sending XAUUSD down over 200 pips in just one session.
Adding fuel to the fire, the Fed’s latest monetary policy report to Congress warned that inflation could rise to 3% by year-end, higher than previous projections. Moreover, the Fed trimmed expectations for rate cuts in 2025 and beyond, signaling a longer road to policy easing.
🔎 What does this mean for gold's short-term outlook?
With high rates here to stay and the Fed's cautious stance, gold remains vulnerable to further downside in the near term. However, if upcoming U.S. economic data shows signs of significant weakness, gold may regain favor as a safe-haven asset.
At the time of writing, XAUUSD is trading around $3,347, a critical zone that may determine whether the current drop continues or finds a bottom.
Do you believe this dip will deepen—or is it a golden opportunity to buy the pullback? Share your thoughts below!
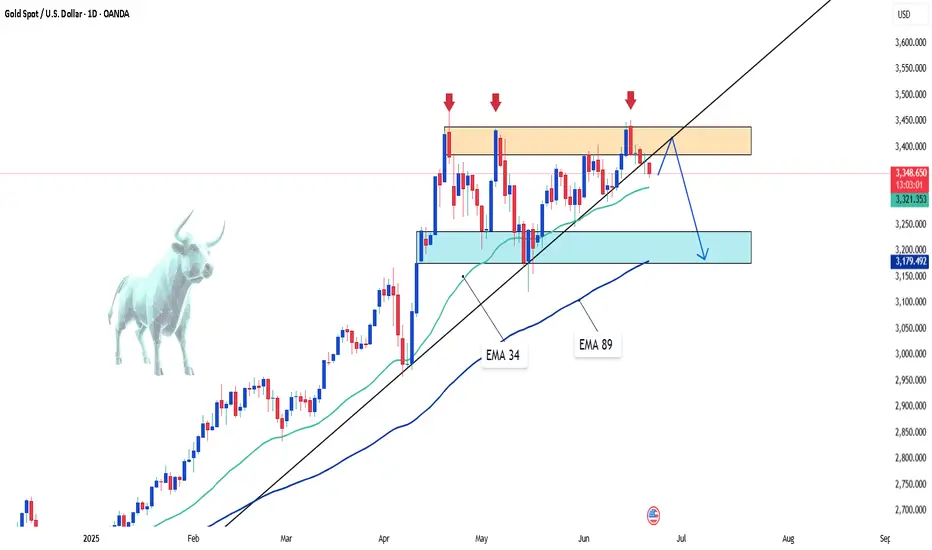
High possibility of XAUUSD creating higher highs for June 2025 If Price Action activates above 3379 USD on spotgold XAUUSD on 20 June 2025 , we might just see a new high created for June 2025 . (90% probability)
However , this may change if the next week patterns disrupt current analysis.

AAVE/USDT – Symmetrical Triangle Squeeze on 4HAAVE/USDT – Symmetrical Triangle Squeeze on 4H
Chart Pattern: Symmetrical Triangle
Timeframe: 4-Hour
Published: June 20, 2025
AAVE/USDT is currently consolidating within a symmetrical triangle. Price is respecting the rising support near the 243–245 zone, while being squeezed by a descending resistance around 263–265. This pattern typically leads to a breakout as volatility compresses.
Bullish Scenario
Entry: On a 4H candle close above 265 with volume
Target 1: 278
Target 2: 290
Stop-loss: Below 242
Bearish Scenario
Entry: Close below 243
Target 1: 230
Target 2: 215
Stop-loss: Above 260
Let the breakout confirm with strong volume before taking a position. Patience is key as AAVE approaches the apex of this formation.

PL to 1200 Platinum has made a massive upwards move in the last 2 weeks. It has not tested my original $1400 price target but got pretty close. The large upwards move has formed a beautiful trend line with more than 3 touch points which has now been broken. I am looking for price to fall back to $1200 price level in the short term.
In the long term its possible to see $1400 I won't be looking for that unless is breaks this new downwards trend forming.

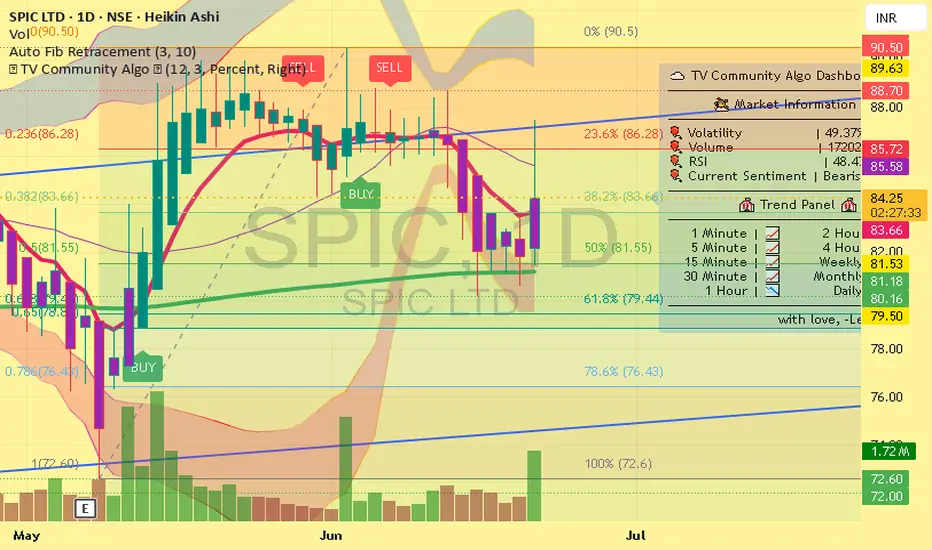
buy SPIC for target 170buy SPIC with SL 79 for the target of 170 time horizon next 2 qtr , position built with strict sl , above 90 monthly closing may add fire in it, 3 yrs symtirical triangle breakout expected. early monsoon, israel iran clash, demand supply, gap can reason for it, and chart support it.
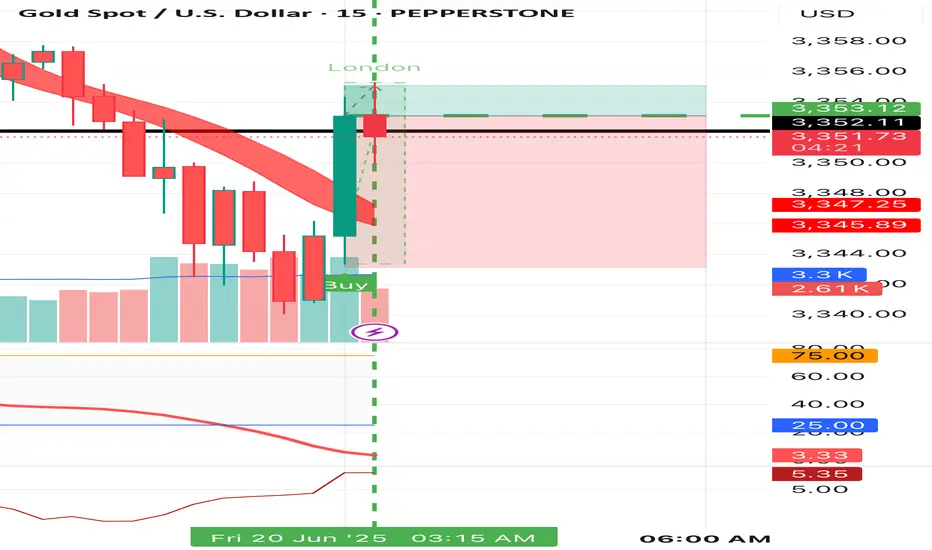
#GOLD Buy 3353.12#GOLD Buy 3353.12
SL 3343.12
TP 3355.12
TP 3363.12
TP 3377.12
Trade at your own risk
Protect your capital
The Wizard 🧙♂️
EURUSD Sell opportunity I see a sell opportunity on EURUSD
Entry: 1.15300
Sl: 1.15400
TP: 1.14500
Comment your opinion
For fund management. INBOX ME ON X @shajudeakinoba1

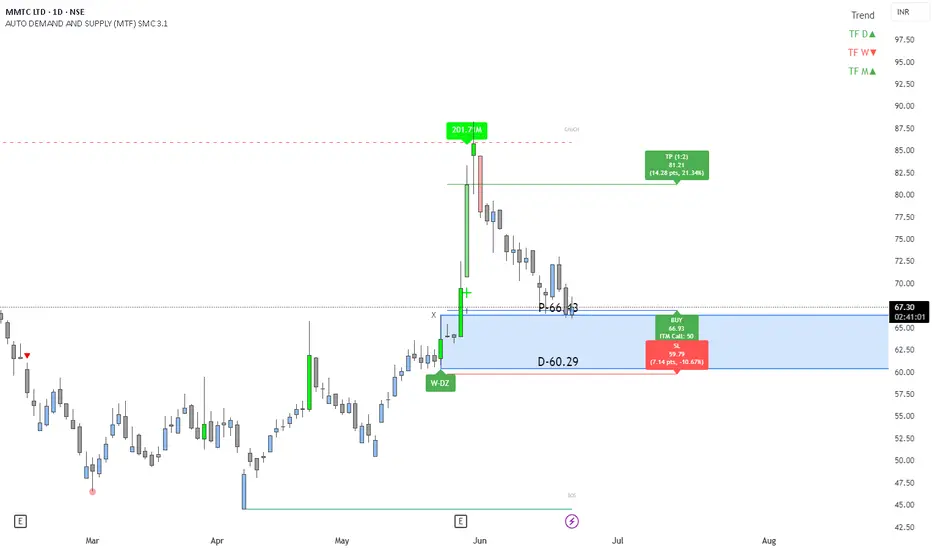
MMTC : Weekly Demand zone Long trade area market structurekey highlights : MMTC : Weekly Demand zone Long trade area market structure : Bullish Analysis Time frame :
Weekly proximal line - 66.43
distal line - 60.29
Buy entry - 66.90
Stop loss- 59.79
Target - 81.21
SPIC--compulsive buyA good fertilizer stock trading near to 200 days EMA . Low PE of 11.2 intrinsic value of 196 making rounded bottom with higher low and higher high with second inverse head and shoulder in making . we have a minimum target of 115-120 resistance on weekly chart if breaks out then higher target of 135-50 range

GU-Fri-20/06/25 TDA-DR 1.34921 hit, potential bearish continue!Analysis done directly on the chart
Follow for more, possible live trades update!
I trade from level to level and see how price
reacts to interest zone. I adapt my sl and tp
based on market conditions and as well the
risk per trade but generally 1% max risk or
lower.
Active in London session!
Not financial advice, DYOR.
Market Flow Strategy
Mister Y

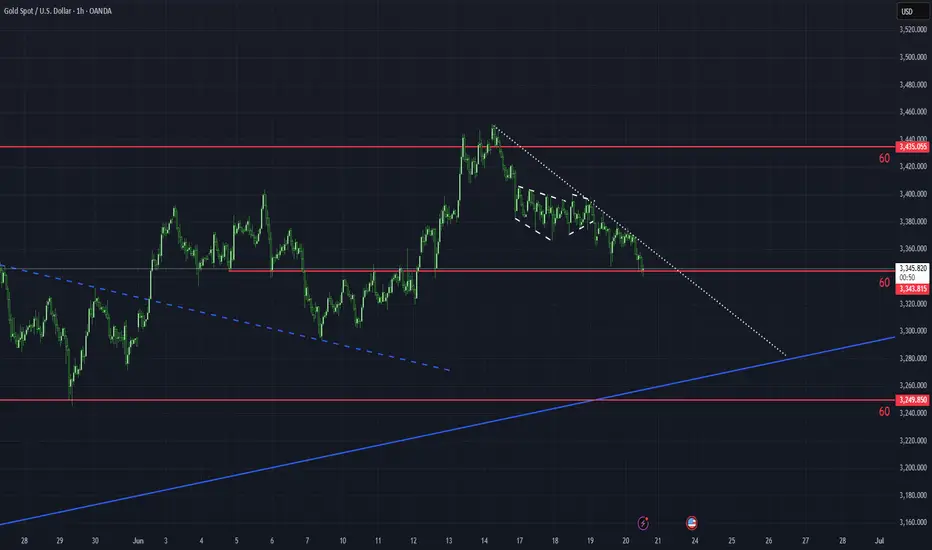
20250620-XAUUSD IdeaAfter the price was rejected at the key level of 3435, a bearish trend has developed. Pay attention to the interaction between the downward trendline and the key level of 3343.
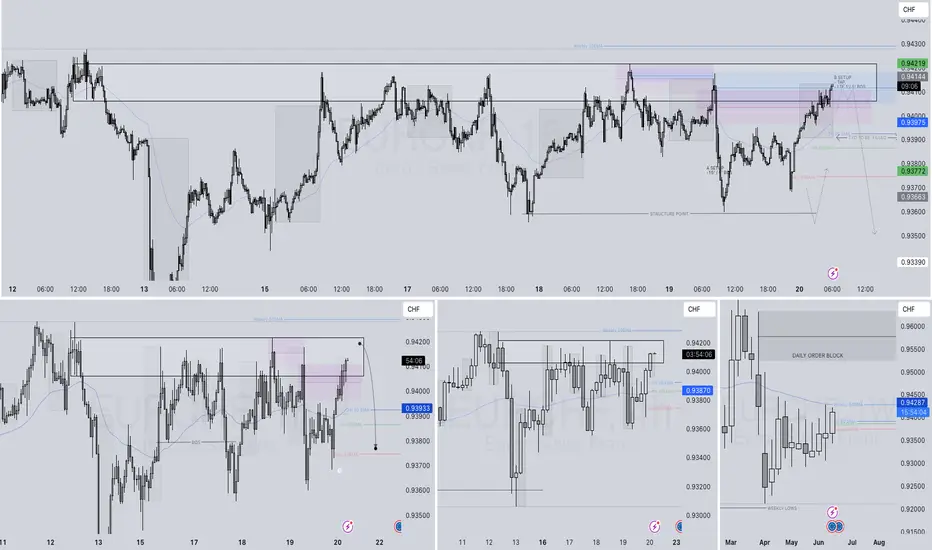
EURCHF SHORT FORECAST Q2 W25 D20 Y25EURCHF SHORT FORECAST Q2 W25 D20 Y25
Professional Risk Managers👋
Welcome back to another FRGNT chart update📈
Diving into some Forex setups using predominantly higher time frame order blocks alongside confirmation breaks of structure.
Let’s see what price action is telling us today! 👀
💡Here are some trade confluences📝
✅Weekly 50EMA Rejection
✅15' Order block
✅1H Order Block
✅4H Highs
🔑 Remember, to participate in trading comes always with a degree of risk, therefore as professional risk managers it remains vital that we stick to our risk management plan as well as our trading strategies.
📈The rest, we leave to the balance of probabilities.
💡Fail to plan. Plan to fail.
🏆It has always been that simple.
❤️Good luck with your trading journey, I shall see you at the very top.
🎯Trade consistent, FRGNT X
UK100 ShortManipulation in the Asian session, looking for price to retest higher supply then push down to the London and Asia low, this is a forecasted entry, entries will be based after 8am M5 candle opening.

SBI Card : Almost at the Sell Signal. Fingers Crossed SBI Card : Almost at the Sell Signal. Fingers Crossed .
( Not a Buy / Sell Recommendation
Do your own due diligence ,Market is subject to risks, This is my own view and for learning only .)

EURUSD | BearishEURUSD has broken the higher low level of bullish trend and printed new lower lows and lower lows and lower highs with bearish divergence on RSI.

Wipro : Momentum continues after a buy signal
Wipro : Momentum continues after a buy signal .
Watch out for a major Red Band Resistance.
( Not a Buy / Sell Recommendation
Do your own due diligence ,Market is subject to risks, This is my own view and for learning only .)

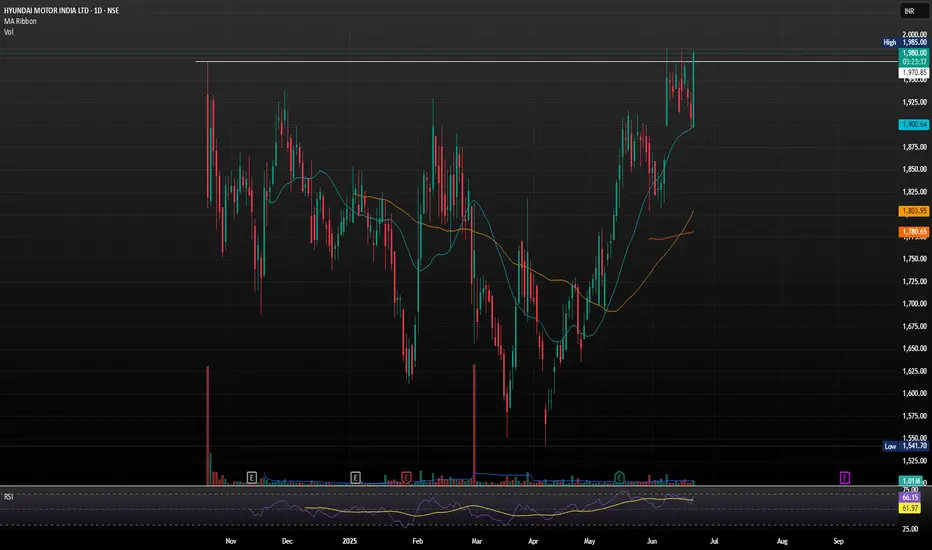
HYUNDAI MOTORS LTD BREACHING ATHHyundai Motor India is one of the leading car manufacturers in the country, known for its wide range of vehicles—from hatchbacks and sedans to SUVs and electric cars. Some of its most popular models include the Creta, Venue, Verna, and the all-electric Ioniq 5.
If Hyundai Motor India has broken past the 2000 mark it may setting their sights even higher. UBS has issued the most bullish call so far, with a target of 2350, citing strong capacity expansion, export momentum, and premium product positioning. Other projections suggest a broader range between 2291 and 2328, depending on market conditions and quarterly performance.