KBBB - Any Opinions for 4 Hours Chart ?📉 Trend Overview
Major Downtrend continues — price has collapsed from above $0.05 to current levels around $0.00047, a >99% drop.
📈 WaveTrend Oscillator (WT_CROSS)
WT oscillator is deep in the oversold region (below -40), which often indicates exhaustion in the downtrend.
- Green dot printed on the oscillator = possible bullish crossover signal.
- However, signal lacks volume confirmation, and previous green dots in this downtrend have only led to small upticks.
⚠️ Key Levels
- Support Zone (Low): Around $0.000451 (marked on chart).
- First Resistance: Around $0.0007–$0.0010 (previous consolidation area).
- Breakout Zone: Above $0.0014, which would indicate a possible structural reversal.
✅ Bullish Signs
Oversold oscillator + sideways consolidation = potential base building.
Price hasn’t broken further down since June 16 low, which could hint at short-term exhaustion by sellers.
--
Disclosures:
This analysis is for informational purposes only and is not financial advice. It does not constitute a recommendation to buy, sell, or trade any securities, cryptocurrencies, or stocks. Trading involves significant risk, and you should consult with a qualified financial advisor before making any investment decisions. Past performance is not indicative of future results.
Chart Patterns

OKLO!!! Elliot wave AnalysisOklo has surged rapidly—Wave 5 appears complete, and we seem to be entering a correction with Wave A, targeting the $45 area. Let’s see how it reacts...

Buying USDBase on the momentum change yesterday on USD.
While EUR is presenting a clear double top with break and on retest
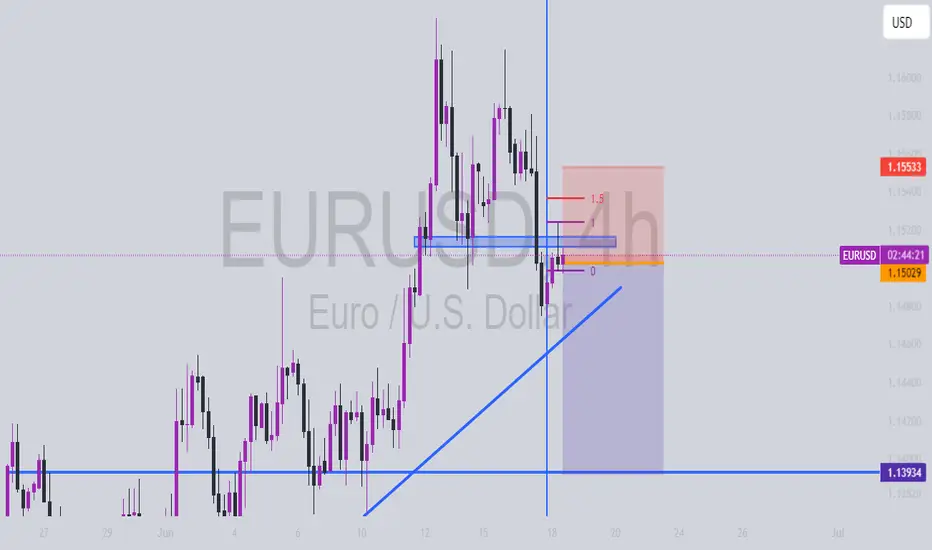
Upside soon Little consolidation on golden zone area for a while. I am leaning more towards the upside with 1st target of fib 1 @ 14, 2nd target w/ fib 1.6 @ 18 and final @ 25

USD/JPY 2-Hour Forex Chart2-hour candlestick chart from FOREX.com displays the exchange rate between the U.S. Dollar (USD) and the Japanese Yen (JPY). The current rate is 145.513, with a slight increase of +0.074 (+0.05%). The chart shows price movements over the past 2-hour period, with a notable upward trend followed by a recent decline, as highlighted by the shaded area indicating a potential resistance or reversal zone. Key levels such as 145.701 and 145.106 are marked, along with the current time of 04:00.

Bearish Wolfewave in playThis pattern is in play as long as at least the hourly SAR is above price.
The ideal target is the 1-4 line.
Scaling out at earlier targets increases the chances of taking a profit.
Patterns can fail.
Do your own due diligence.

WTI Oil H1 | Overlap resistance at 61.8% Fibonacci retracementWTI oil (USOIL) is rising towards an overlap resistance and could potentially reverse off this level to drop lower.
Sell entry is at 76.02 which is an overlap resistance that aligns closely with the 61.8% Fibonacci retracement.
Stop loss is at 78.00 which is a level that sits above a multi-swing-high resistance.
Take profit is at 71.40 which is a swing-low support that aligns closely with the 78.6% Fibonacci retracement.
High Risk Investment Warning
Trading Forex/CFDs on margin carries a high level of risk and may not be suitable for all investors. Leverage can work against you.
Stratos Markets Limited (tradu.com ):
CFDs are complex instruments and come with a high risk of losing money rapidly due to leverage. 63% of retail investor accounts lose money when trading CFDs with this provider. You should consider whether you understand how CFDs work and whether you can afford to take the high risk of losing your money.
Stratos Europe Ltd (tradu.com ):
CFDs are complex instruments and come with a high risk of losing money rapidly due to leverage. 63% of retail investor accounts lose money when trading CFDs with this provider. You should consider whether you understand how CFDs work and whether you can afford to take the high risk of losing your money.
Stratos Global LLC (tradu.com ):
Losses can exceed deposits.
Please be advised that the information presented on TradingView is provided to Tradu (‘Company’, ‘we’) by a third-party provider (‘TFA Global Pte Ltd’). Please be reminded that you are solely responsible for the trading decisions on your account. There is a very high degree of risk involved in trading. Any information and/or content is intended entirely for research, educational and informational purposes only and does not constitute investment or consultation advice or investment strategy. The information is not tailored to the investment needs of any specific person and therefore does not involve a consideration of any of the investment objectives, financial situation or needs of any viewer that may receive it. Kindly also note that past performance is not a reliable indicator of future results. Actual results may differ materially from those anticipated in forward-looking or past performance statements. We assume no liability as to the accuracy or completeness of any of the information and/or content provided herein and the Company cannot be held responsible for any omission, mistake nor for any loss or damage including without limitation to any loss of profit which may arise from reliance on any information supplied by TFA Global Pte Ltd.
The speaker(s) is neither an employee, agent nor representative of Tradu and is therefore acting independently. The opinions given are their own, constitute general market commentary, and do not constitute the opinion or advice of Tradu or any form of personal or investment advice. Tradu neither endorses nor guarantees offerings of third-party speakers, nor is Tradu responsible for the content, veracity or opinions of third-party speakers, presenters or participants.

USD/CAD H1 | Potential bounce off an overlap supportUSD/CAD is falling towards an overlap support and could potentially bounce off this level to climb higher.
Buy entry is at 1.3686 which is an overlap support that aligns with the 50% Fibonacci retracement.
Stop loss is at 1.3633 which is a level that lies underneath anoverlap support and the 50% Fibonacci retracement.
Take profit is at 1.3738 which is a swing-high resistance.
High Risk Investment Warning
Trading Forex/CFDs on margin carries a high level of risk and may not be suitable for all investors. Leverage can work against you.
Stratos Markets Limited (tradu.com ):
CFDs are complex instruments and come with a high risk of losing money rapidly due to leverage. 63% of retail investor accounts lose money when trading CFDs with this provider. You should consider whether you understand how CFDs work and whether you can afford to take the high risk of losing your money.
Stratos Europe Ltd (tradu.com ):
CFDs are complex instruments and come with a high risk of losing money rapidly due to leverage. 63% of retail investor accounts lose money when trading CFDs with this provider. You should consider whether you understand how CFDs work and whether you can afford to take the high risk of losing your money.
Stratos Global LLC (tradu.com ):
Losses can exceed deposits.
Please be advised that the information presented on TradingView is provided to Tradu (‘Company’, ‘we’) by a third-party provider (‘TFA Global Pte Ltd’). Please be reminded that you are solely responsible for the trading decisions on your account. There is a very high degree of risk involved in trading. Any information and/or content is intended entirely for research, educational and informational purposes only and does not constitute investment or consultation advice or investment strategy. The information is not tailored to the investment needs of any specific person and therefore does not involve a consideration of any of the investment objectives, financial situation or needs of any viewer that may receive it. Kindly also note that past performance is not a reliable indicator of future results. Actual results may differ materially from those anticipated in forward-looking or past performance statements. We assume no liability as to the accuracy or completeness of any of the information and/or content provided herein and the Company cannot be held responsible for any omission, mistake nor for any loss or damage including without limitation to any loss of profit which may arise from reliance on any information supplied by TFA Global Pte Ltd.
The speaker(s) is neither an employee, agent nor representative of Tradu and is therefore acting independently. The opinions given are their own, constitute general market commentary, and do not constitute the opinion or advice of Tradu or any form of personal or investment advice. Tradu neither endorses nor guarantees offerings of third-party speakers, nor is Tradu responsible for the content, veracity or opinions of third-party speakers, presenters or participants.

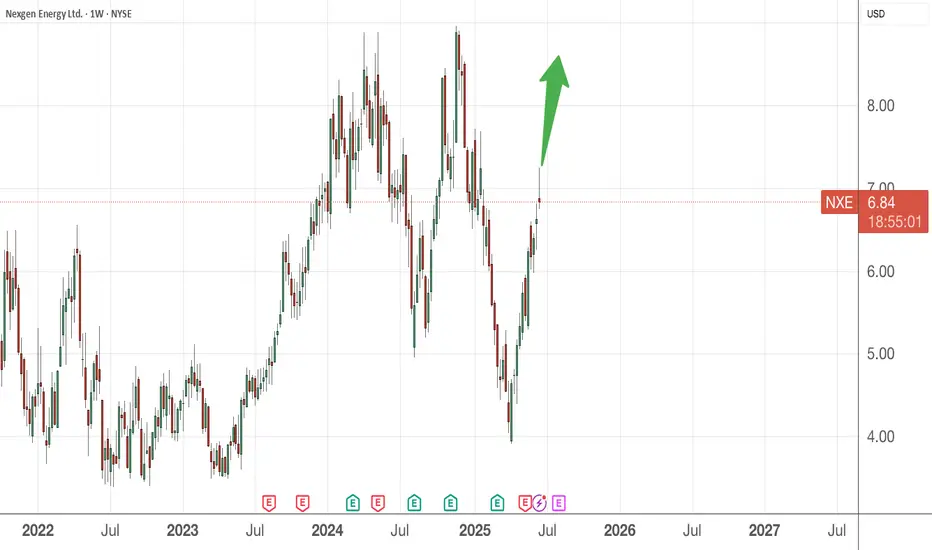
Why I would not buy NXE Energy WIthout considering the financial background of this company, I would not invest/trade in this stock.
1. We can see the price has already move from the support base of around 3.5-4.00
2. We are now 3/4 to the top and if reached it will form a triple top formation which is bearish
3. Question is we do not know how high will it goes before coming down for retracement. It can be below 8 or above 8 (triple top formation does not have to have all 3 price points on equal level to work)
Read somewhere insiders are disposing large amount of the shares, haha. WHY would they do that ? Something they know and we retail traders do not. If so, why are you walking into the trap? Hoping to buy high and price goes higher ?
There are better catches out there in the ocean
Crude oil------Buy around 74.00, target 75.00-76.50Crude oil market analysis:
Crude oil has been strong recently, and it is also because of the support of fundamentals and inventory data that crude oil has begun to strengthen. Today's idea is still bullish on crude oil. Continue to buy after the retracement. The daily moving average has begun to diverge. The small support for buying has reached around 72.00. The suppression position is around 74.00 and 77.60. I estimate that it will form a small shock and then break through and rise again. If it does not break 70.00, it is still strong. Buy crude oil around 74.00 today.
Fundamental analysis:
The interest rate results announced by the Federal Reserve last night remained unchanged at 4.25%-4.50%, and the fourth consecutive meeting remained unchanged, which was in line with market expectations. The uncertainty of the United States about the future has led to no major changes in monetary policy in the near future.
Operational suggestions
Crude oil------Buy around 74.00, target 75.00-76.50

I opt for Option 2 for HSINow, I hope the HSI will moves to option 2 instead of option 1. I think the latter is less likely to happen since the central government has already thrown in a lot of stimulus and time to prop up the market. To let it fall back to this low level will be discouraging and harder to get people interested to invest in the market once again.
I am also hoping the government will release more stimulus to people on the ground as consumer demand is still weak, crippling property market and weak job market. The silver lining seems to be the US- China trade tariffs issue which was resolved much quicker than expected. While there is no signed agreement for now, there are also no further escalation as well which is viewed positively by the market.
I am getting more ammunition to buy in those quality companies that i am eyeing on or averaging down some of the stocks that i am currently holding. No rush for now, just patiently awaiting..........

DAX H1 | Downtrend to extend deeper?The DAX (GER30) is rising towards a swing-high resistance and could potentially reverse off this level to drop lower.
Sell entry is at 22,230.41 which is a swing-high resistance that aligns closely with the 23.6% Fibonacci retracement.
Stop loss is at 23,460.00 which is a level that sits above the 50% Fibonacci retracement and a swing-high resistance.
Take profit is at 22,913.31 which is a swing-low support.
High Risk Investment Warning
Trading Forex/CFDs on margin carries a high level of risk and may not be suitable for all investors. Leverage can work against you.
Stratos Markets Limited (tradu.com ):
CFDs are complex instruments and come with a high risk of losing money rapidly due to leverage. 63% of retail investor accounts lose money when trading CFDs with this provider. You should consider whether you understand how CFDs work and whether you can afford to take the high risk of losing your money.
Stratos Europe Ltd (tradu.com ):
CFDs are complex instruments and come with a high risk of losing money rapidly due to leverage. 63% of retail investor accounts lose money when trading CFDs with this provider. You should consider whether you understand how CFDs work and whether you can afford to take the high risk of losing your money.
Stratos Global LLC (tradu.com ):
Losses can exceed deposits.
Please be advised that the information presented on TradingView is provided to Tradu (‘Company’, ‘we’) by a third-party provider (‘TFA Global Pte Ltd’). Please be reminded that you are solely responsible for the trading decisions on your account. There is a very high degree of risk involved in trading. Any information and/or content is intended entirely for research, educational and informational purposes only and does not constitute investment or consultation advice or investment strategy. The information is not tailored to the investment needs of any specific person and therefore does not involve a consideration of any of the investment objectives, financial situation or needs of any viewer that may receive it. Kindly also note that past performance is not a reliable indicator of future results. Actual results may differ materially from those anticipated in forward-looking or past performance statements. We assume no liability as to the accuracy or completeness of any of the information and/or content provided herein and the Company cannot be held responsible for any omission, mistake nor for any loss or damage including without limitation to any loss of profit which may arise from reliance on any information supplied by TFA Global Pte Ltd.
The speaker(s) is neither an employee, agent nor representative of Tradu and is therefore acting independently. The opinions given are their own, constitute general market commentary, and do not constitute the opinion or advice of Tradu or any form of personal or investment advice. Tradu neither endorses nor guarantees offerings of third-party speakers, nor is Tradu responsible for the content, veracity or opinions of third-party speakers, presenters or participants.

S&P 500 H4 | Rising into a pullback resistanceThe S&P 500 (SPX500) is rising towards a pullback resistance and could potentially reverse off this level to drop lower.
Sell entry is at 5,982.20 which is a pullback resistance that aligns with the 50% Fibonacci retracement.
Stop loss is at 6,030.00 which is a level that sits above the 78.6% Fibonacci retracement and a swing-high resistance.
Take profit is at 5,869.32 which is a swing-low support that aligns closely with a 78.6% Fibonacci retracement.
High Risk Investment Warning
Trading Forex/CFDs on margin carries a high level of risk and may not be suitable for all investors. Leverage can work against you.
Stratos Markets Limited (tradu.com ):
CFDs are complex instruments and come with a high risk of losing money rapidly due to leverage. 63% of retail investor accounts lose money when trading CFDs with this provider. You should consider whether you understand how CFDs work and whether you can afford to take the high risk of losing your money.
Stratos Europe Ltd (tradu.com ):
CFDs are complex instruments and come with a high risk of losing money rapidly due to leverage. 63% of retail investor accounts lose money when trading CFDs with this provider. You should consider whether you understand how CFDs work and whether you can afford to take the high risk of losing your money.
Stratos Global LLC (tradu.com ):
Losses can exceed deposits.
Please be advised that the information presented on TradingView is provided to Tradu (‘Company’, ‘we’) by a third-party provider (‘TFA Global Pte Ltd’). Please be reminded that you are solely responsible for the trading decisions on your account. There is a very high degree of risk involved in trading. Any information and/or content is intended entirely for research, educational and informational purposes only and does not constitute investment or consultation advice or investment strategy. The information is not tailored to the investment needs of any specific person and therefore does not involve a consideration of any of the investment objectives, financial situation or needs of any viewer that may receive it. Kindly also note that past performance is not a reliable indicator of future results. Actual results may differ materially from those anticipated in forward-looking or past performance statements. We assume no liability as to the accuracy or completeness of any of the information and/or content provided herein and the Company cannot be held responsible for any omission, mistake nor for any loss or damage including without limitation to any loss of profit which may arise from reliance on any information supplied by TFA Global Pte Ltd.
The speaker(s) is neither an employee, agent nor representative of Tradu and is therefore acting independently. The opinions given are their own, constitute general market commentary, and do not constitute the opinion or advice of Tradu or any form of personal or investment advice. Tradu neither endorses nor guarantees offerings of third-party speakers, nor is Tradu responsible for the content, veracity or opinions of third-party speakers, presenters or participants.

POSSIBLE SELL OPPORTUNITY ON GBPUSDPrice has fallen dramatically from an area of supply forming a classical reversal pattern. As price moves back up after encountering some demand, we have identified a supply level from which to join the sell trade.

Marked with “EQH” (Equal Highs), indicating a liquidity area.Chart Elements:
Instrument & Timeframe:
Pair: GBP/USD (British Pound / U.S. Dollar)
Timeframe: 4-hour chart (each candlestick = 4 hours)
Key Zones Highlighted:
Top Green Box (~1.36000–1.36500):
This represents a resistance zone where price has previously struggled to break above.
Marked with “EQH” (Equal Highs), indicating a liquidity area or potential stop-hunt zone.
Bottom Green Box (~1.33500–1.34200):
This is a support zone where price has bounced before.
The price is currently near this support level.
Price Movement Forecast (White Zigzag Line):
Indicates a bullish projection:
Suggests a potential bounce from the current support zone.
A possible rally back towards the resistance zone (~1.36000–1.36500), potentially to grab liquidity above the EQH.
Current Price:
Shown around 1.34656, which is near the bottom support zone.
Candlestick Structure:
Price has recently had a sharp move down into the support zone.
A possible reversal setup is forming based on the projection.
Interpretation:
The chart suggests a bullish scenario for GBP/USD:
The price is expected to hold the support zone.
If buying pressure comes in, the price may rise toward the resistance level to test or sweep the equal highs.

Around 3,365 – 3,375. Price is currently reacting from here.✅ Market Structure:
The chart marks HH (Higher High), HL (Higher Low), and FL (Failed Low) which indicates a bullish trend or market trying to maintain bullish structure.
The current price has pulled back into a demand zone (highlighted in green around the 3,365–3,375 range), showing potential bullish reaction.
📌 Key Zones:
Demand Zone: Around 3,365 – 3,375. Price is currently reacting from here.
Supply Zone / Target Zone: Around 3,445+. This is likely the next target area marked for profit-taking.
📈 Expected Price Action:
A projected bullish wave is drawn using a white zig-zag path:
Suggests short-term bullish correction.
Followed by a pullback and continuation to the upside.
Final target: above 3,445, completing a bullish move to the upper supply zone.
💡 Bias:
Bullish, as long as price holds above the current demand zone and continues to form higher lows.
✍️ Suggested Description:
"XAU/USD 4H Analysis: The market is currently reacting from a key demand zone after forming a higher low. If the bullish structure holds, we expect a continuation move towards the 3,445+ supply area. Clean higher highs and higher lows confirm the bullish bias. Awaiting a break and retest of the minor resistance zone for further confirmation."

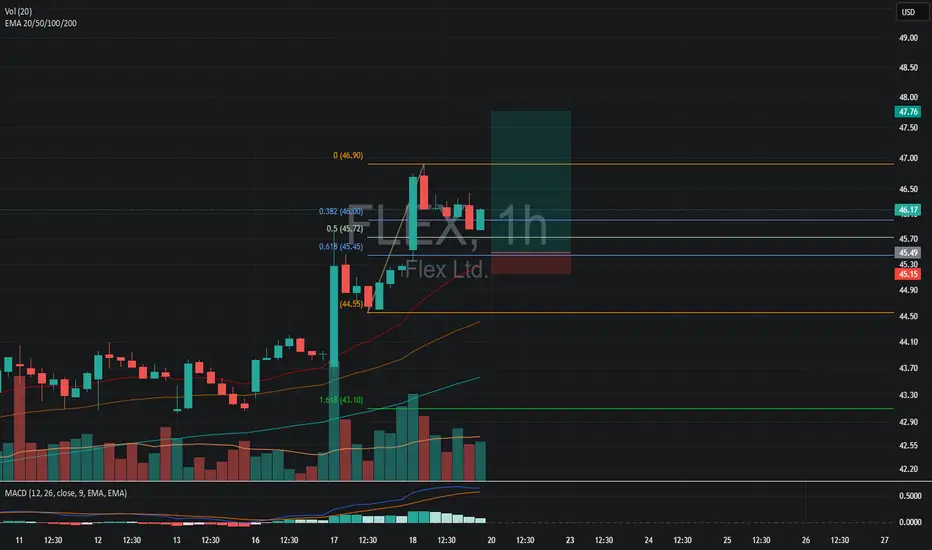
FLEX on WatchWhy:
Possibly pullback to 20EMA which lines up with 0.618 fib level
MACD looks like its going to turn bearish
Daily uptrend
$ETH/BTC macro planth: bearish trendline
50 fib% = scalps & intraday
61.8 fib = swings & spot & intraday

Coca-Cola Wave Analysis – 19 June 2025
- Coca-Cola broke the support zone
- Likely to fall to support level at 68.55
Coca-Cola recently broke the support zone located between the support level 70.35 (which reversed the price twice from May) and the 61.8% Fibonacci correction of the upward impulse 1 from May.
The breakout of this support zone coincided with the breakout of the daily Triangle from April – which accelerated the active correction 2.
Coca-Cola can be expected to fall to the next support level at 68.55 (former monthly low from May and the target for the completion of the active correction 2).

Visa Wave Analysis – 19 June 2025
- Visa broke daily up channel
- Likely to fall to support level at 332.90
Visa recently broke the support zone located between the support level 345,00 (which reversed the price earlier this month) and the 38.2% Fibonacci correction of the upward impulse from the start of April.
The breakout of this support zone coincided with the breakout of the daily up channel from April – which accelerated the active wave 4.
Visa can be expected to fall to the next support level at 332.90 (former minor support from April and the target for the completion of the active wave 4).

ASX on WatchLooking to buy the pullback/retest under $68
Why:
Looking for bounce off demand zone, $67.50 - $68
1.618 fib extension lines up with demand zone
Head and shoulders pattern is forming. Not a good time to go long

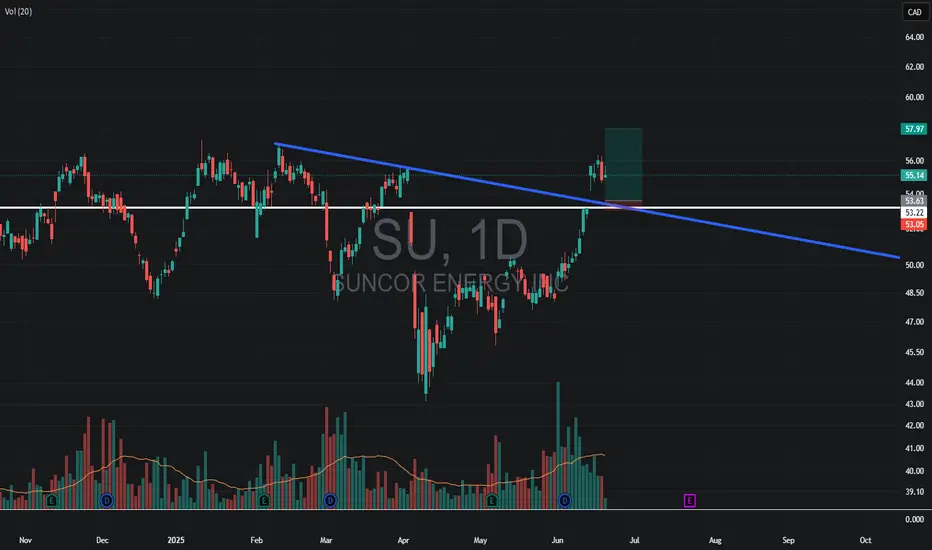
SU on WatchWatching for a pull back
Why:
Gap fill
The price to close the gap lines up with upper channel
Above average green volume on the uptrend
Bitcoin Short-Term 1H Timeframe, Next Target ConfirmedWe have two drops on this chart. The one of the left is more extended and long lasting compared to the one on the right. When a move is sudden with major force, it tends to end suddenly as well.
The recent drop was very steep and the force needed to keep pushing prices lower cannot be maintained, it requires too much energy; for this reason, a higher low is in place and the bulls win the game.
The action is happening above the blue line and space on the chart, this is the 0.618 Fib. retracement support. This is the most important level and so far it holds. Prices went below just to recover. Can be called a failed signal or a bear-trap, whichever you choose, the action is bullish above this level and bearish below.
Bitcoin's main support stands around $102,663, this level was not challenged. Since bears failed to push prices lower, the next logical move is a challenge of higher resistance. And the same pattern repeats, up and down, up and down... This is the short-term noise. When all is set and done, Bitcoin will resolve going up.
Patience is key.
Thank you for reading.
Thanks a lot for your continued support.
Namaste.
