PBTC vs ETHA visual comparison of Purple Bitcoin (PBTC) and Ethereum (ETH) trends, powered by the Purple Bitcoin Compare Bot.
Chart Patterns

XAU USD SHORT RESULT Gold Price was consolidating in a minor falling channel and broke out with some good volume, which was why I opened the long position to the high demand zone.
But Price turned to be a fake out and still trading inside a now falling expanding wedge, so we'll see to which side breaks and follow it.
Better Luck and Setups To Come 😉💪

Hanzo / Nas100 30 Min ( Accurate Tactical Break Out Zones )🔥 Nas100 – 30 Min Scalping Analysis (Bearish Setup)
⚡️ Objective: Precision Breakout Execution
Time Frame: 30-Minute Warfare
Entry Mode: Only after verified breakout — no emotion, no gamble.
👌Bullish After Break : 21710
Price must break liquidity with high volume to confirm the move.
👌Bullish After Break : 21550
Price must break liquidity with high volume to confirm the move.
☄️ Hanzo Protocol: Dual-Direction Entry Intel
➕ Zone Activated: Strategic liquidity layer detected — mapped through refined supply/demand mechanics. Volatility now rising. This isn’t noise — this is bait for the untrained. We're not them.
🩸 Momentum Signature Detected:
Displacement candle confirms directional intent — AI pattern scan active.
— If upward: Bullish momentum burst.
— If downward: Aggressive bearish rejection.
Hanzo / Nas100 30 Min ( Accurate Tactical Break Out Zones )

$AMD Short to $105Personally I am avoiding the hype & FOMO on this stock. Big money is selling the headlines while retail FOMO get trapped. I will reenter longs in the $95-105 range. Setting stops around $128.

Ethereum, Bullish Breakout Expected Any Moment Now!Look at this, the first peak for Ethereum happened 13-May after the start of the recovery and the end of the downtrend. The lowest point happened five days later on 18-May and there has been no new lows since. Ethereum has been in a bullish consolidation pattern, a classic bullish flag.
This kind of dynamic clearly reveals a bullish bias and certainly, Ethereum is already trading pretty low compared to its last high.
A new and most interesting signal comes from the stock COIN, for Coinbase. This stock went ahead and produced a very strong bullish breakout yesterday with a green candle reaching +16%. COIN's chart and ETH are almost identical, exactly the same. Since these two move together, we can expect Ethereum to follow suit and do the same. We can expect a bullish breakout to happen any day now. Consolidation has been going long enough. It is time for the market to grow.
Some of the smaller altcoins continue to move forward, this is a signal that should not be ignored.
Namaste.

Sellers maintaining controlSellers maintain control in their shortened S&P 500 daily session. Further movement to the downside would be expected however we are approaching levels the buyers have entered this market previously. So be careful on the short side of this market.

NQ2025 – Clean Liquidity Sweep & OB Rejection Leads to Trend ConDescription (for the Idea post):
NASDAQ Futures (NQ2025) - June 19th Setup Breakdown
Market showed textbook Smart Money behavior today.
🔹 Key Highlights:
Price swept the Saturday Low and Wednesday Low, triggering sell-side liquidity.
Reaction from an old Order Block + Fair Value Gap (FVG) zone near 21,780.
Market Structure Break confirmed the bearish bias.
Retest of OB/FVG zone provided a clean low-risk entry.
Targets were cleanly delivered into 21,678 and beyond.
🔹 Confluences:
✅ Liquidity Sweep
✅ OB + FVG Rejection
✅ Volume Spike & BOS
✅ Trend aligned with overall bearish bias
📌 Plan Going Forward:
I’m watching for retracements to prior support-turned-resistance (21,740–21,780) for potential continuation plays. Will stay bearish unless a CHoCH above 21,800 with volume and bullish structure forms.
Comment below with how you traded this setup or how you're managing it!

Nifty Important Levels for 20th June 2025Hello fellow traders,
I'd like to share my analysis of the Nifty charts for educational purposes. Based on the chart, here's my understanding:
- If the price reaches primary support, it may bounce back to primary resistance, and vice versa.
- If the price breaks above primary resistance and retests it, it could target secondary resistance. A pullback from secondary resistance might lead it back to primary resistance.
- Conversely, if the price breaches primary support, it may head towards secondary support and potentially rebound back to primary support.
Remember to always use stop-loss and consider EMA 20 for identifying potential price retracements.
Wishing you a successful trading session tomorrow!
Best regards

XAU / USD 2 Hour ChartHello traders. So here we are at the end of the day and my chart did not need to be changed. We failied to break out above or below the current range that gold is trading in. Saying that, the chart is still valid for small scalp trade set ups. Maybe the overnight sessions will bring some direction. Either way, I will check back during the London session or when Pre NY volume starts tomorrow morning at about 7:30 am est here in the US. Big G gets a shout out. Be well and trade the trend. Let's see how things play out during the overnight sessions.

10 YEAR US GOVERNMENT BOND YIELD . the US 10-Year Treasury Yield (US10Y) stands at 4.39%-4.5%,The 10-year yield is a key benchmark for long-term interest rates in the United States and is closely watched by investors as an indicator of market sentiment regarding economic growth, inflation, and Federal Reserve policy.
The yield has been rising recently, reflecting investor concerns about US fiscal policy, inflation, and the outlook for Federal Reserve rate cuts.
Federal Reserve Interest Rate Decision (June 2025)
The Federal Reserve held its key interest rate steady at 4.25%–4.50% at its June 2025 meeting.
This marks the fourth consecutive meeting with no change in rates, as the Fed continues its cautious, data-dependent approach amid persistent inflation and moderate economic growth.
The Fed’s latest “dot plot” and projections indicate that two 25-basis-point rate cuts are still possible by the end of 2025, but expectations for cuts in 2026 and beyond have been reduced.
Key Drivers and Outlook
Yield Movements: The 10-year yield has climbed amid concerns about US fiscal deficits, credit rating downgrades, and the impact of tariffs and trade policy on inflation.
Fed’s Tone: The FOMC statement and projections reflect ongoing stagflationary pressures—slower growth, persistent inflation, and a slightly rising unemployment rate.
Market Expectations: Markets are pricing in two rate cuts by year-end, most likely in September and December, but nearly half of Fed officials see little or no room for cuts in 2025 if inflation remains sticky.
Conclusion
The US 10-year Treasury yield remains elevated as markets weigh fiscal risks, inflation, and the Fed’s cautious stance.
The Fed is holding rates steady but signaling that two rate cuts remain possible in 2025, with future moves highly dependent on incoming data, especially inflation and labor market trends.
Investors should expect continued yield volatility as economic and policy uncertainties persist.

Us30 Key Levels on the Daily Timeframe – Quick Analysis:
🔴 Resistance Zones:
1. 42800 – 42950 🔺
• This area marked a strong top and rejected price multiple times
• If price returns to this zone, a strong rejection is likely
2. 42250 – 42400
• Previous correction area, may act as short-term resistance
• Useful zone to exit partial long positions if price bounces back
⸻
🟢 Support Zones:
1. 41700 – 41750 🧱
• Nearest support zone, price is currently close
• A break below this could trigger further downside
2. 41480 – 41550 🔻
• Medium support from a previous low (May)
• Breaking this opens downside toward 41000
3. 40700 – 40800
• Strong support from a major bottom
• A break here could open the way to 390 00–38000
⸻
📉 Chart Notes:
• Currently forming a potential double top near 42900
• The downtrend seems active as long as price stays below 42250–42400

Descending Channel Breakout Ahead for $NEARUSDTCBOE:NEAR is trading in a descending channel on the 6H chart.
After bouncing from $2.140 support, it’s showing signs of a short-term recovery, with a target of $2.50, 13.40%.
MACD crossover supports bullish momentum.
Holding support is key, or the downtrend continues.
DYRO, NFA

Fartcoin BullishCup and Handle formation showing on Fartcoin.
Bitcoin once it goes will lift a bunch of alt coins. I believe bitcoin is en route towards $130k next. Alt coins will likely move after.

AUD_JPY GROWTH AHEAD|LONG|
✅AUD_JPY has retested a key support level of 93.800
And as the pair is already making a bullish rebound
A move up to retest the supply level above at 94.600 is likely
LONG🚀
✅Like and subscribe to never miss a new idea!✅
Disclosure: I am part of Trade Nation's Influencer program and receive a monthly fee for using their TradingView charts in my analysis.

USD/JPY) Bearish reversal analysis Read The captionSMC trading point update
Technical analysis of USD/JPY 3-hour chart suggests a bearish reversal setup, based on smart money concepts (SMC), resistance rejection, and price action structure. Here's a full breakdown:
Technical Breakdown – USD/JPY
Big Resistance Zone (~145.800–146.300):
Price has tapped into a major resistance zone (yellow box) twice (highlighted with red arrows).
Both rejections indicate strong seller interest.
The latest candle structure shows clear rejection wick, signaling weakness at resistance.
---
Bearish Bias Confirmation:
Bearish structure forming after the second rejection.
Break of the rising trendline could accelerate selling pressure.
A measured move projection (-2.58%) aligns the downside target with the support level at ~142.144.
---
Support Zone (~141.800–142.400):
Marked as the likely target zone.
Historically acted as a strong bounce area (visible from late May to early June).
Completion of ABC bearish structure aligns here.
---
Indicators & Tools:
200 EMA (144.419): Price currently slightly above it — watching for a close below to strengthen bearish view.
RSI (14): Shows signs of bearish divergence and cooling off from overbought (was above 70 previously).
Volume spike during the rejection suggests institutional selling.
Mr SMC Trading point
---
Forecast Summary:
Bias: Bearish toward 142.144
Entry Idea: Look for confirmation of breakdown below trendline (~145.00)
Invalidation: Strong bullish close above 146.300 would break this idea.
---
Please support boost 🚀 this analysis)

Gold Nears A Bullish BreakoutDepending on one’s timeframe, gold has either stalled or is gradually grinding higher. This is because gold has been moving sideways since mid-April but has been trending upward within a technical trading channel since mid-May. It has been a frustrating period for gold traders, with numerous false starts moving higher and lower. However, long-term holders certainly can’t complain.
The rising trading channel and the ascending 10-day exponential moving average are bullish signals, suggesting that gold could continue to climb if these trends remain intact. Additionally, the Relative Strength Index (RSI) is also trending upwards, further supporting a bullish outlook.
The significant test for gold remains at $3,400, an area where gold has repeatedly failed to break through. Yet, one could argue that the more gold tests this resistance level, the greater the likelihood of an eventual breakout.
However, should gold fail to break out and instead slip below the rising channel and the 10-day exponential moving average, it would create a bearish scenario, potentially pushing prices beneath support at around $3,325. Breaking this support could set the stage for declines towards $3,230, and possibly even down to $3,170, although current indicators suggest this scenario is less likely.
With geopolitical tensions escalating and economic uncertainty heightened by global trade concerns, gold is likely to remain an attractive safe-haven asset in the near term. Nevertheless, should these tensions ease or uncertainties diminish, gold may face a pullback; yet, for now, further upside appears to be the most probable outcome.
Written by Michael J. Kramer, founder of Mott Capital Management.
Disclaimer: CMC Markets is an execution-only service provider. The material (whether or not it states any opinions) is for general information purposes only and does not take into account your personal circumstances or objectives. Nothing in this material is (or should be considered to be) financial, investment or other advice on which reliance should be placed.
No opinion given in the material constitutes a recommendation by CMC Markets or the author that any particular investment, security, transaction, or investment strategy is suitable for any specific person. The material has not been prepared in accordance with legal requirements designed to promote the independence of investment research. Although we are not specifically prevented from dealing before providing this material, we do not seek to take advantage of the material prior to its dissemination.

Fake breakout, support, trend line and stop loss for USDJPYI am still bearish on USDJPY. However, you can see from the shorter time frame, there are multiple occasions where fake breakouts happen. This usually stops out the traders with tight SL. Unless you have a clear strategy, after being stopped out from this pair, it is highly likely that you will move on to other pairs/asset classes to find your next pot of gold.
But if you are persistent and have the patience, you will notice this fake breakout patterns. It is getting shorter and shorter. Now, with the support at 142.472, a breakdown will be great as it sends the price to 140 level.
If you wants to short now, it would be better to have a wider SL, say 145.60 , the previous peak where it is more likely not to surpass. A higher SL will mean you cannot be greedy in your position size initially to rein in the gains if it moves in your favour. It is better to have a small position and the market agrees with you than to go on an aggressive mode of say 5-10 contracts position size and shortly market moves against you. The stress would be too much to bear seeing the losses running........
Find one strategy that suits your personality , risk profile and work on it tirelessly.

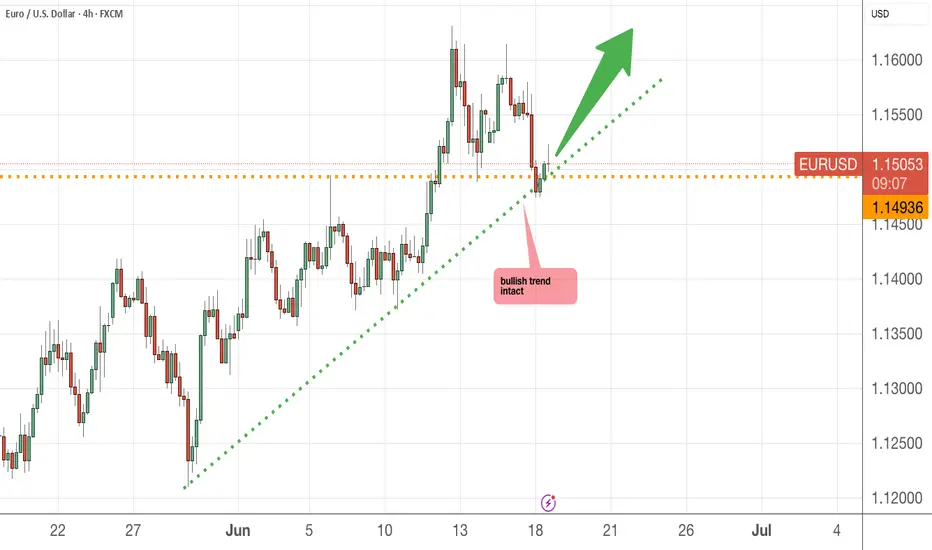
Going to accumulate more Euro dollars Looking at the 4H chart, it has come down to the important support level of 1.1493. If it is able to sustain above this level, then it should have no problem surpassing the previous high of 1.16 price level.
Thereafter, it may form a triple top formation and we see some retracement
GBP-NZD Will Go Down! Sell!
Hello,Traders!
GBP-NZD will soon hit
A horizontal resistance
Of 2.2556 and as its a
Strong key level we will
Be expecting a local
Pullback and a move down
Sell!
Comment and subscribe to help us grow!
Check out other forecasts below too!
Disclosure: I am part of Trade Nation's Influencer program and receive a monthly fee for using their TradingView charts in my analysis.

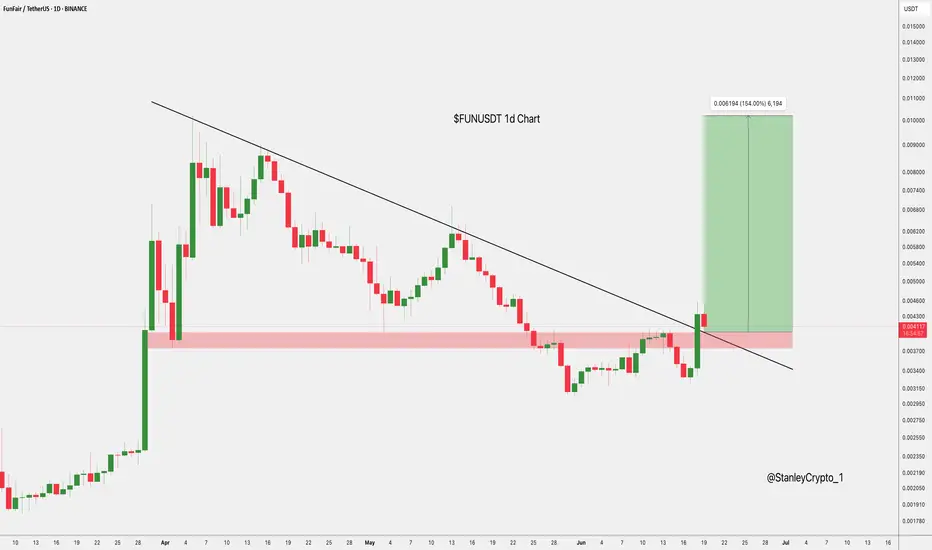
$FUNUSDT Breakout Setup NYSE:FUN has broken out of a long-term downtrend with strong bullish momentum.
It’s now retesting the breakout zone, which also aligns with a key support area.
If this level holds, the next target is 0.010199, a potential 154% move.
Clean breakout-retest setup in play.
DYRO, NFA
XRP ANALYSIS🔮 #XRP Analysis - Update 🚀🚀
💲 As we said earlier #XRP performed the same. Resistance1 achieved easily. Now we can see that there is a formation of Falling Wedge Wedge Pattern in #XRP and we can see a more retest before a bullish movement again.
💸Current Price -- $2.1729
📈Target Price -- $2.5964
⁉️ What to do?
- We have marked crucial levels in the chart . We can trade according to the chart and make some profits. 🚀💸
#XRP #Cryptocurrency #Breakout #DYOR

Where Most See Resistance, Smart Money Sees OpportunityDOGE is currently hovering around the 0.382–0.5 Fibonacci retracement zone after a reactive bounce from 0.618 (0.16784) — a critical discount level. Most traders panic at these levels, but experienced participants know this is the zone where price builds intention.
Here's the breakdown of the structure:
Price tapped into the 0.618 Fibonacci level (0.16784) and began showing signs of recovery — a typical Smart Money accumulation zone.
The next target is 0.17042, aligning with the 0.236 retracement level, followed by 0.17151, where previous supply might get mitigated.
Potential retracements are possible, but as long as price holds above 0.16670 (0.786), the bullish structure remains intact.
Execution strategy:
Entry (Accumulation Zone): Between 0.16784 and 0.16864
Invalidation: Break below 0.16600 would weaken the bullish case
Upside targets:
• TP1 → 0.17042
• TP2 → 0.17151
• Extension possibility beyond 0.17204
This move appears to be a classic premium-delivery setup — a structural reset, not a collapse. Smart Money steps in quietly when retail panic takes over. If you're trading DOGE like a pro, focus on levels, not emotions.
Let me know if you'd like this converted into a tweet format or turned into a technical newsletter paragraph.

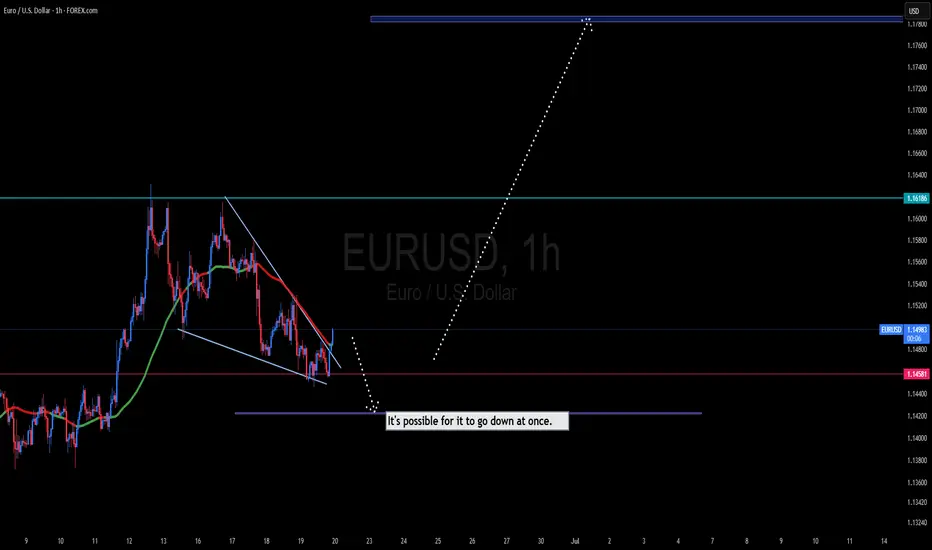
Eurusd 1Hr chart Analaysis EUR/USD is currently in a bullish trend and is expected to reach the 1.17801 – 1.18010 range. A bearish retracement is likely to occur around those levels.
Note: Ongoing tensions in the Middle East could have a significant impact on the market.