EUR_NZD SHORT FROM RESISTANCE|
✅EUR_NZD is going up now
But a strong resistance level is ahead at 1.9266
Thus I am expecting a pullback
And a move down towards the target of 1.9150
SHORT🔥
✅Like and subscribe to never miss a new idea!✅
Disclosure: I am part of Trade Nation's Influencer program and receive a monthly fee for using their TradingView charts in my analysis.
Chart Patterns

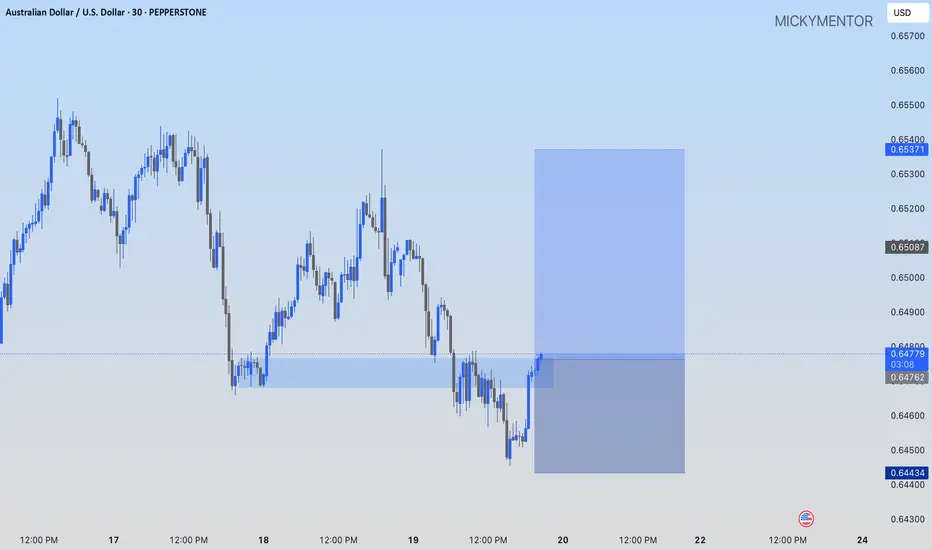
AUDUSD: AN OPPORTUNITY TO GO LONGPEPPERSTONE:AUDUSD I'm buying at the current market price to the 0.65371 price level
BTC to 102.5k game plan. here you can see that bitcoin is trading within a zone that will likely lead to a breakout to the downside, unless geopolitical tensions somehow get freed up. I believe that we will see 102.5k by the end of the month, if not sooner.

AETHIR Bought the DipATH filled Bart Simpson and is in weekly support area and has filled FVG 1(fair value gap). Another FVG yet to be filled but all in all good DCA + entering the Buy zone. Taking advantage of it and scaling in.

$HYPEUSDT Long Setup 6H Chart$HYPE/USDT – Long Setup (6H Chart)
- Entry Zone: $37.8 – $38.2
- Target: $45.8
- Stop Loss: $37.2
Price is bouncing off strong demand and an ascending trendline.
If support holds, we expect a bullish continuation
Break below $37.2 invalidates the setup.
DYRO, NFA

EUR-USD Will Keep Growing! Buy!
Hello,Traders!
EUR-USD is trading in an
Uptrend along the rising
Support and the pair will
Soon retest the support
From where we will be
Expecting a bullish rebound
And a bullish continuation
Buy!
Comment and subscribe to help us grow!
Check out other forecasts below too!
Disclosure: I am part of Trade Nation's Influencer program and receive a monthly fee for using their TradingView charts in my analysis.

BTC – 15min Reversal Structure & Fibonacci ReclaimWe’re currently witnessing a potential short-term reversal on BTC’s lower timeframe after a volume-supported breakdown and sweep of local lows.
🔍 Key Observations:
Price swept liquidity at local lows (~103,929.27)
Entered into a clear reaccumulation box with responsive buyers
Volume profile shows prior POC just above – room for fill
Fibonacci retracement aligns with key structure:
0.5 = 104,372.94
0.618 = 104,268.23
1.0 = 104,816.60 (final high target for this impulse)
📈 Potential Play:
Entry Zone: Just above the sweep candle (104,100–104,200)
Target 1: 0.382 at 104,477
Target 2: 104,816.60
Invalidation: Close below 103,926
🧠 Mindset:
This is a classic liquidity sweep → reaction → reclaim pattern. If BTC flips the 0.5 level with strong momentum, a short squeeze toward the 104.8K area becomes likely.
Great opportunity for scalpers or day traders.
Let me know if you want this turned into a long-form breakdown or sent in another format.

EURUSD 1Hr chart Analaysis EUR/USD is likely to enter a bearish phase, potentially reaching the 1.14069–1.13389 range. This area is a strong candidate for a potential rebound; however, the pair may continue its downward trend. One of the main driving factors behind this bearish momentum is the ongoing conflict in the Middle East, which is contributing to broader market uncertainty and risk-off sentiment.

XLK ETF. TO WAR, OR NOT TO WAR — THAT IS THE QUESTION..US stock futures edged lower Wednesday evening ahead of Thursday’s market closure for Juneteenth.
The moves came after the Federal Reserve held interest rates steady, with Chair Jerome Powell striking a cautious tone amid rising geopolitical and economic uncertainty.
Powell reaffirmed a data-dependent approach, pointing to unclear inflation impacts from President Trump’s tariffs and the risk of stagflation.
Fed projections now include two rate cuts in 2025, alongside downgraded growth expectations and higher inflation forecasts.
Investor sentiment was further dampened by escalating tensions in the Middle East, as the ongoing Israel-Iran conflict stoked fears of deeper US involvement, while North Korea has recently launched 10 rockets from near capital Pyongyang.
Futures for 7 of the 11 S&P 500 sectors ended the Prime Day holiday in the red, led by declines in energy, while technology outperformed.
What is more important Technology sector is the one and only over 11 S&P 500 sectors that has printed recently new all the history high, just one - two days before Prime Day.
What is XLK The Technology Select Sector SPDR Fund ETF
AMEX:XLK ETF is respectively The Technology Select Sector ETF, that seeks to provide investment results correspond generally to the price and yield performance of the S&P 500 Technology Sector Index.
The largest 5 holdings of this ETF are Microsoft NASDAQ:MSFT , Nvidia NASDAQ:NVDA , Apple NASDAQ:AAPL , Broadcom NASDAQ:AVGO and Oracle NYSE:ORCL , while all together they weight nearly 50 percent of the fund by market cap.
Microsoft NASDAQ:MSFT shares have experienced a significant upward trend in 2025, reaching new all-time highs and reflecting the company’s robust financial performance and strategic positioning in the technology sector.
Record Highs and Price Momentum
As of June 18, 2025, Microsoft’s stock closed at $480.24, marking its highest closing price ever. This price is just below its 52-week high of $481.00 and represents a 14% gain year-to-date, making Microsoft one of the best-performing stocks among the so-called “Magnificent Seven” tech giants in 2025. The stock’s average price over the past 52 weeks was $422.77, and its 52-week low was $344.79, which is 28.2% below the current level, highlighting the impressive rally over the past year.
Short-Term and Long-Term Performance
In the immediate term, Microsoft’s stock has shown steady gains. Over the past week, the share price rose by 2.03%, and over the past month, it increased by 6.36%. Looking at a broader horizon, the stock is up 6.79% over the last year, underscoring consistent investor confidence and the company’s ability to capitalize on growth opportunities.
Drivers Behind the Rally
Several factors have contributed to Microsoft’s recent share price surge:
Artificial Intelligence Investment. Microsoft continues to invest heavily in AI infrastructure, with plans to spend $80 billion in fiscal 2025. This aggressive investment is seen as crucial to maintaining a competitive edge in cloud computing and AI services, areas that are driving much of the company’s growth.
Cost Management. Despite the heavy spending on AI, Microsoft is also focused on controlling costs. The company is reportedly planning to trim thousands of jobs, particularly in sales, to offset rising expenses and protect profit margins. This follows earlier workforce reductions and reflects a broader trend among major tech firms to optimize operations amid escalating AI-related costs.
Diversified Revenue Streams. Microsoft’s strong position in software, cloud computing, and AI, along with its subscription-based business model and consistent dividend growth, have bolstered investor sentiment. The company’s cloud platform Azure and productivity tools continue to show strong adoption across industries.
Market and Analyst Sentiment
Microsoft’s market capitalization recently reached $3.55 trillion, with a price-to-earnings ratio of 36.94, indicating high investor expectations for future growth. Analysts’ price targets for MSFT range from $432 to $700, suggesting a wide spectrum of views but generally positive long-term sentiment.
Competitive and Operational Challenges
Despite its strong performance, Microsoft faces competitive pressures, particularly from OpenAI, which has been offering discounted ChatGPT subscriptions, impacting Microsoft’s own AI products like Copilot. Additionally, negotiations with OpenAI over continued access to its technology have reportedly stalled, introducing some uncertainty into Microsoft’s AI strategy.
Technical challenge and summary
While Microsoft shares have recently hit record highs, driven by aggressive AI investment, disciplined cost management, and strong core business performance, it robustly helped to all the Technology sector came back to 6-month key resistance after nearly 40 percent recovery rally.
While the market faces different challenges, we keep our strategic focus on next positions and further stock market development.
--
Best wishes,
@PandorraResearch Team 😎

SOL – Sweep & Spring Play at Local DemandWe’ve got a clean rounded top → breakdown → demand sweep setup.
Current price action suggests a potential reversal is brewing.
🔍 What’s happening on this chart?
Rounded top marks a local distribution — aggressive short entries
Price broke lower, swept the demand zone (gray box), and now shows rejection wick + bullish reaction
Fibonacci levels mapped out the structure
0.5 = 154.51
0.618 = 157.76 = key resistance liquidity zone
🎯 Trade idea:
Entry: inside demand zone (OB marked on chart)
Target 1: 151.25
Target 2: 157.76 (0.618)
Full fill: 162.40 – 168.30 (complete inefficiency sweep)
🧠 Mindset:
This setup is classic spring + reclaim. If price consolidates and flips 147.2, upside becomes favorable.
If you like clean trade setups with logic and clear invalidation, check the account bio for more updates and live breakdowns.


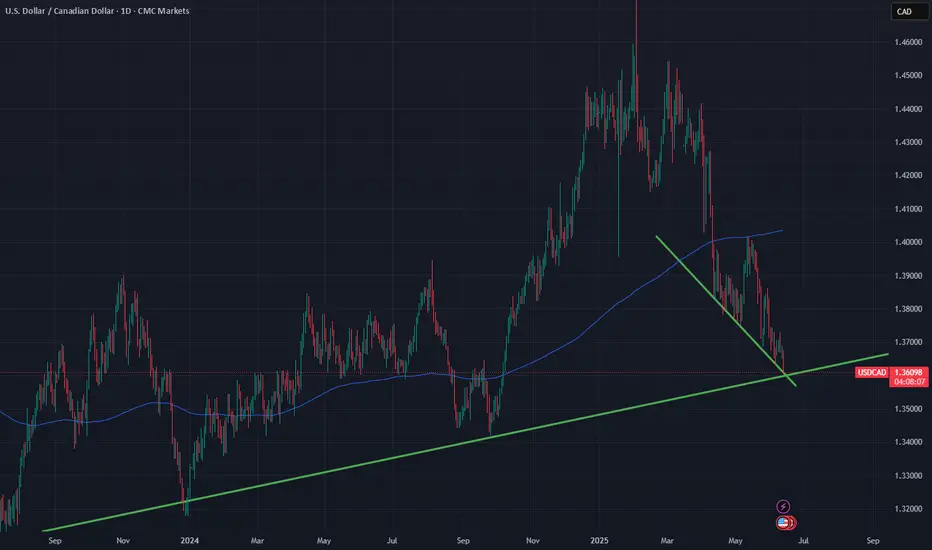
Long Idea for USDCADI beleive the USDCAD its in good spot to start rising again. The correction may be over and now I'm looking for a good bounce
Targets:
TP1. 1.37
TP2. 1.38
TP3. 1.40
Good luck
Rectangle ChannelHey traders, here’s one to watch closely 👇
GBPCHF is consolidating in a rectangle channel structure, marked by clear highs and lows — a classic coiled spring waiting for resolution.
📌 Key Notes:
Price has respected horizontal boundaries repeatedly
We’ve now broken above the top of the range with a reaction off point D
Both upside and downside breakouts remain valid — the key is confirmation
🔍 What to Watch:
A surge in volume and close above 1.10142 or below 1.09510 will confirm breakout direction
Fibs projected from XA and ABCD legs show both upside and downside targets
Range extension levels already plotted for reference
No prediction. Just structure and breakout readiness.
— C. Dela | #TradeChartPatternsLikeThePros.

Gold: update hello friends✋️
According to the recent growth of gold, you can see that it is constantly resisting and forming a falling pattern.
For this reason, it can be a warning that the fall can continue and the price will fall to the specified limits.
🔥Follow us for more signals🔥
*Trade safely with us*

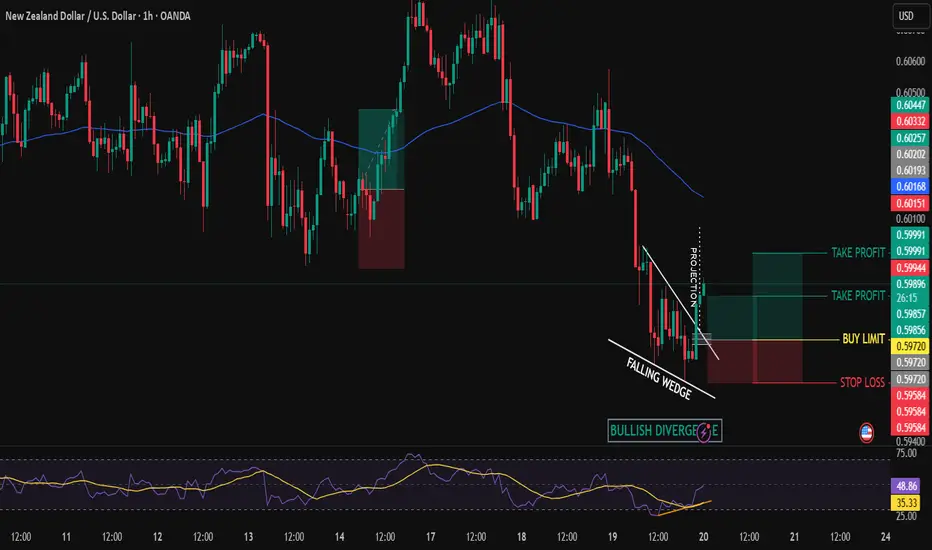
NZDUSD BULLISH SETUPNZDUSD is bullish trend start, previous LH break.
I would take entry with buy limit order at fib retracement.
Manage your trade accordingly.
SELL-THE -RALLY :Swing trade limit Trend & Structure Broken
The green up-trend line and the last swing low were breached (you saw a BOS and CHoCH). That’s your first clue that buyers have lost control.
Failed Rally into Supply
When price pulled back up, it stalled under the old swing high / “equilibrium” zone. It never made a fresh higher high—so there’s no reason to chase longs.
Entry (Blue @ ~21,689) 🔵🚀
After price broke the rising trendline and the last swing low, it rolled back up into the equilibrium/supply area. That gives you a “sell-the-rally” entry at the blue level—where late buyers and remaining shorts congregate.
Stop-Loss (Red @ ~22,071) 🔴❌
Placed just above the prior swing high and the upper edge of the supply zone. If price pops above this red line, it signals the short setup has failed and bulls are back in control.
Take-Profits (Greens @ ~21,448 → 21,066 → 20,718 → 20,306) 🟢🎯
These green levels are the next pockets of demand/value below:
21,448 – the minor PDL/PWL area 📉
21,066 – first major demand zone 💰
20,718 – deeper value area 📦
20,306 – unfilled gap that often attracts fast buyers ⚡
Happy trading! 👍
