Clear Buy side from this range In Day frame chart we can see a big consolidation happening from last few days or months its a great opportunity to buy in dips and hold atleast for 3M. Also stock is getting at more than 35% discounted rate
Chart Patterns

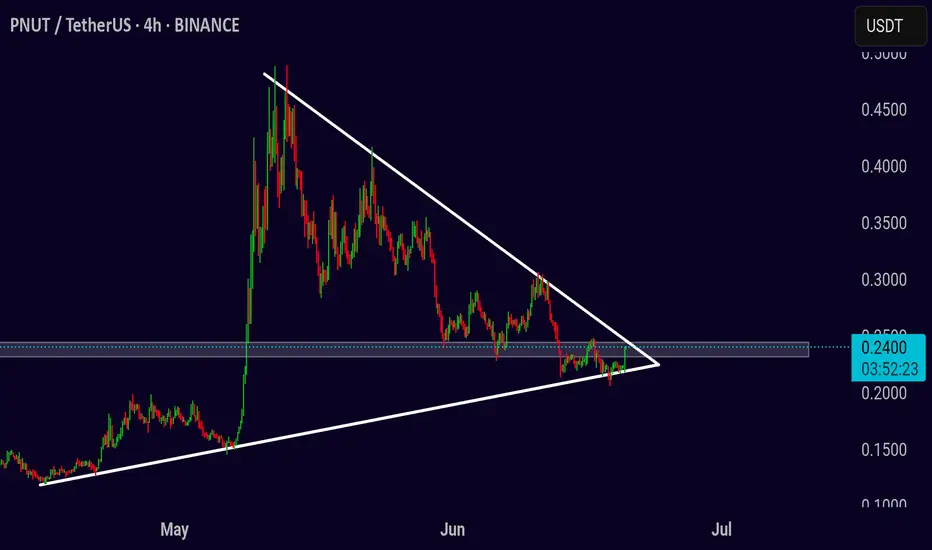
PNUT/USDT – Breakout Watch from Symmetrical TrianglePNUT/USDT – Breakout Watch from Symmetrical Triangle
Chart pattern: Symmetrical Triangle
Timeframe: 4-Hour
Published: June 20, 2025
PNUT/USDT is nearing the apex of a symmetrical triangle that has been forming over several weeks. The price is tightening between rising support and descending resistance, indicating a breakout is likely approaching soon.
Price is currently testing the upper boundary near 0.24. A breakout from this level with strong volume may trigger a bullish move, while rejection could keep price inside the range a little longer.
Bullish scenario
Entry: 4H close above 0.245 with volume
Target 1: 0.28
Target 2: 0.33
Stop-loss: Below 0.22
Bearish scenario
Entry: Break below 0.215
Target 1: 0.18
Target 2: 0.14
Stop-loss: Above 0.24
Wait for confirmation before acting — momentum will likely follow once the triangle breaks.
Gold Short Term OutlookGold extended lower after breaking $3,361, and has now tapped into the HTF retracement zone.
📉 Technical Outlook:
Price remains under pressure, trading below both the 50MA and 200MA, confirming a bearish bias.
Intraday resistance sits at $3,366–$3,376, with a stronger bullish shift only above $3,387.
If current support breaks, next targets remain $3,306 and $3,287.
📌 Key Levels:
Support: $3,342 • $3,327 • $3,306 • $3,287
Resistance: $3,366 • $3,376 • $3,387
⚠️ It’s Friday -Liquidity tends to thin out into the weekend. Traders should remain disciplined, protect weekly profits, and avoid overtrading unless high-conviction setups emerge.

$XRPUSDT 6h Chart. $XRP/USDT 6H chart shows a clean breakout above the descending trendline, followed by a successful retest at the key demand zone.
This confluence suggests bullish momentum is building up.
As long as price holds above the $2.1023 support, the setup points toward a potential 17% upside move targeting the $2.4873–$2.5035 range.
DYRO, NFA

UPDATE ON AERO SHORTS ,Perfect short area $0.95-0.98UPDATE ON AERO SHORTS
Perfect short area $0.95-0.98
Still targeting $0.77 or Down
Look like dumping time soon
Right now at $0.95
Not a Financial advice

XAU/USD,15M CHART PATTERN.gold at 3412, and im listed the following targets:
Target 3482 → This is above your entry price, so it looks like a mistake if you're in a sell position.
Target 3340 → Logical downside target.
Target 3320 → Another lower target, continuation of bearish momentum.
Corrected View (Assuming SELL from 3412):
Type Level
Entry 3412
TP1 3340
TP2 3320
SL (suggested) 3445–3450 (above recent highs)
Let me know if the 3482 was meant to be your stop loss instead — that would make more sense in this context.

BTCUSD MOVES H1 ANNALSIS OUTLOOK BULLISH 20/6/2025buy 10.3700
others limit 10.3300
Take profit 10.4200
take profit 10.4800
take profit 10.5500
stop los 10.2500
XAU/USD) 3H Analysis – Bearish Breakdown Toward $3,244 Support!Price at analysis: $3,340.99
Indicators:
EMA 50 (Red): $3,375.05
EMA 200 (Blue): $3,340.54
RSI (14): 31.10 (approaching oversold zone)
🔺 Key Resistance Zone:
Price consistently rejected at the upper blue trendline (highlighted by red arrows).
Double top pattern visible, with strong rejections from ~3,420–3,450 range.
Horizontal resistance area (green box) was tested multiple times without breakout.
🔻 Bearish Signals:
Price broke below EMA 50, retested, and failed to reclaim.
Currently sitting right around the EMA 200, acting as last dynamic support.
Breakdown below EMA 200 would signal strong bearish continuation.
RSI at 31.10, nearing oversold – however, no bullish divergence present yet.
🎯 Target Zone:
Bearish move could aim for support zone around $3,243.73, as shown in the purple box.
This target aligns with historical consolidation zone and is marked as “target point” on chart.
🔄 Scenario Outlook:
🔵 Bearish Case (more likely):
Breakdown confirmed ➡️ Sell rallies toward 3,375 with SL above 3,400.
TP: 3,244 support zone.
🟢 Bullish Case:
Only valid if price reclaims above 3,375–3,400 resistance.
Would invalidate short-term bearish outlook.
🧠 Trader's Tip:
Watch for volume confirmation on breakdown.
Monitor RSI closely—oversold bounce possible, but trend still weak unless 3,375+ reclaimed.
📉 Conclusion: Bearish structure emerging. A confirmed breakdown below 200 EMA supports short setups toward the 3,243 zone. Risk management is key—price action near 3,340 will determine next leg.

HATUSDT 1-Hour Heikin Ashi Chart Analysis BYBIT:HATUSDT
Analysis:
Recent Trend: The chart shows a sharp price drop recently, with red candles indicating strong selling pressure. 📉
RSI: The Relative Strength Index has fallen below 30, entering oversold territory. This suggests that selling may have been excessive, and a rebound could be possible. 📊
Support: A potential support level can be identified near the current price drop, around 0.00087 USD (based on chart figures). 🔽
Resistance: A possible resistance level could be near the previous trend’s low, around 0.0010-0.0012 USD. 🔼
Possible Targets:
Target 1 (short-term): 0.00095 USD - A small rebound after oversold conditions. 🎯
Target 2 (medium-term): 0.0011 USD - A test of the first resistance level. 🎯
Target 3 (long-term): 0.0015 USD - If a strong bullish recovery occurs after confirmation. 🎯
Set a stop-loss below the support level (e.g., 0.00065 USD) to manage risk. ⚠️

GOLD (XAUUSD): Technical Analysis & Important Pattern to Watch
For some known reason, Gold remains bearish this entire week.
The market is currently correcting within a falling channel - a bullish flag on a 4H time frame.
Ahead, I see a bunch of strong intraday supports.
From one of these structures, a bullish rally may resume.
A trigger that you should look for is a bullish breakout of
a resistance line of the flag and a 4H candle close above that.
A bullish continuation will be expected then.
❤️Please, support my work with like, thank you!❤️
I am part of Trade Nation's Influencer program and receive a monthly fee for using their TradingView charts in my analysis.

ETH ~Expansion done.Based on 3marketphase.
(contraction-expansion-trend, I learned this concept from dayya trading post)
ETH is at the box range.
(triangle-2024 August to October)
Plus, there is throwing-over with double-top (1week candle scale).
This means ethereum is at the end of contraction phase and it has high potential to trend phase. But I bet there is one more break-out from low before trend phase.
Keep an eye on all of break-out movements.

GOLD : Be Careful Of This Clear Bearish PatternGOLD : Be Careful Of This Clear Bearish Pattern
Israel and Iran's air war entered a second week and European officials sought to draw Tehran back to the negotiating table.
Stock markets ticked higher on Friday while oil skirted close to its biggest daily drop since April after President Donald Trump pushed back a decision on U.S. military involvement in the Israel-Iran conflict.
The U.S. is now giving itself two weeks and maybe some diplomatic opening window there to resolve the situation in Iran
European shares rose on Friday after declining for three straight sessions, as a stall in the United States' involvement in the Middle East conflict helped soothe investor concerns.
The foreign ministers of Germany, France and Britain plan to hold nuclear talks with their Iranian counterpart on Friday in Geneva, a German diplomatic source told Reuters.
The pause on GOLD price is related to the news above. we should be careful because if they reach any agreement gold can fall aggressively as long as it didn't manage to rise more.
Don't forget that the big trend is bullish but remains manipulated and also effected too much by the news
✅PS: GOLD has a bearish scenario from all perspectives. I wouldn't say sell it because it's very risky, but you can consider this scenario if you have long positions.
You may find more details in the chart!
Thank you and Good Luck!
❤️PS: Please support with a like or comment if you find this analysis useful for your trading day❤️

BITCOIN This is the long-term picture. Don't get distracted.Bitcoin (BTCUSD) has been consolidating lately after making a new All Time High (ATH) last month and this is already making part of the market nervous over whether that's the Cycle Top or not.
This is one of those times when it would be best to ignore the short-term noise/ volatility and stick to the long-term picture. And that's exactly what's shown on this chart, with BTC on the 1M time-frame showing the incredible symmetry among its 4-year Cycles, with Bear Markets lasting 12 - 13 months and Bull Markets 35.
Based on that, this Cycle's Top is expected to be priced by October (2025). This also matches the Sine Waves as implied by the 1M RSI, which as been trading within a Channel Down (diminishing returns) since Bitcoin's inception.
So do you also think that we have around 4 months before the market tops? Feel free to let us know in the comments section below!
-------------------------------------------------------------------------------
** Please LIKE 👍, FOLLOW ✅, SHARE 🙌 and COMMENT ✍ if you enjoy this idea! Also share your ideas and charts in the comments section below! This is best way to keep it relevant, support us, keep the content here free and allow the idea to reach as many people as possible. **
-------------------------------------------------------------------------------
💸💸💸💸💸💸
👇 👇 👇 👇 👇 👇

BITCOIN (BTCUSD): Strong Bullish Confirmation?!
Bitcoin has a high chance to rise more, following
a strong bullish reaction to a rising trend line on a 4H.
Goal - 108000
❤️Please, support my work with like, thank you!❤️

Daily EMA 55 needs to move above EMA 200!!
My general bias for Solana is bullish. However, the current setup is very similar to the setup in Feb-Apr 2022 before Solana started a macro bear trend. (see blue rectangular box)
I am still waiting for a long trade opportunity. I am not looking for a short trade. I just need to sit tight and see how the price is going to unfold in the next few months in the daily chart.
The 2022 setup (see blue rectangular box in the chart):
1) EMA55 crossed below EMA 200 on 16th Feb 2022. (red vertical line in the chart)
2)The price found the temporary floor around $80 and sharply moved above both EMA55 and
200. (see light blue rectangular box)
3) It was the dead cat bounce. It was the beginning of the macro down trend.
4)The price spent months and months under $40 in 22 and 23, however, the price eventually
broke above both EMA 55 and 200 and when EMA55 crossed above EMA 200 in Oct
2023 (red vertical line in the chart), the macro bull trend started.
The current setup (see orange rectangular box in the chart):
1) EMA 55 crossed below EMA 200 on the 4th March 2025.
2) The price moved down to $95 area and sharply moved above both EMA 55 and EMA200. However, it failed to stay above them.
3) The price has been oscillating between $140 and $18. The price is still below EMA55 and EMA200. (see orange rectangular block)
In order to start a strong bull trend,
1) the price needs to close and stay above EMA 55 and EMA200.
2) EMA 55 needs to cross and stay above EMA 200. EMA55>EMA200
3) MACD and RSI need to enter the bull zone.
EMA55 and EMA200 do not cross easily (I mean decisively cross). It only happened three times since 2022, however, when they cross, the price moves very aggressively in one direction.
I think Solana is bullish fundamentally. I am not suggesting it is going to start the macro bear cycle. I am pointing out the price is still not showing a clear direction. From a technical analysis point of view, it might take some time before the trend forms. For now, it is only testing my patience!

Middle East Tension: Read This Before You Trade today⚔️🕊️💣 Middle East Tension: Read This Before Markets close for the Weekend 🌍🔥✌️
Video:
Hey traders,
Today’s landscape is delicate and raw: we stand between a possible US strike on Iran and a chance for leaders to step back from the edge. Many are asking: Should I bet on gold? Should I short the indices? Should I buy oil?
Here’s my honest read, straight from today’s video (which I highly recommend you watch for full context 📺):
👉 Bitcoin (BTC)
Still ranging sideways. The last move hit my resistance zone perfectly. For now, BTC keeps its cool — but watch out: global fear can spark sudden moves, or the opposite, a liquidity crunch.
👉 Gold & Silver
Yes, they’re classic safe havens — but don’t fall for the textbook trap. When true chaos strikes, big players often sell profitable gold positions to cover losses elsewhere. So an initial spike is possible, but deep pockets can reverse it fast. This is why I’m cautious: I do not expect a guaranteed pump on gold or silver.
👉 Crude Oil (WTI)
The chart says it all: any strike in the Middle East fuels oil prices fast. But as I’ve always said — I do not long oil during human tragedy. Ethics over easy pips.
👉 Indices & USDJPY
Gaps are likely. Risk assets may get hammered if bombs fall. If leaders choose dialogue instead, expect a risk-on rebound. The USD stays a wildcard: trust in the US remains, but shocks test that trust.
👉 Airlines Pausing Flights?
Yes — major airlines are avoiding the Gulf. That alone signals how real this risk is.
✅ My plan is clear:
I never short disasters. I never profit from pain. I am LONG on humanity and peace. I’d rather lose a trade than wish for blood in the streets.
I do have some carefully calculated positions open tonight — fully risk-managed and small-sized. If Monday gaps bless me, fine. If peace wins and my trades lose? Even better.
👉 Watch the full video for my live charts, context, and unfiltered thoughts.
This text is just a recap — the full idea is already posted as a video.
Stay sharp. Stay ethical. Protect your capital and your soul — one good trade is never worth your humanity.
One Love,
The FXPROFESSOR 💙
Disclosure: I am happy to be part of the Trade Nation's Influencer program and receive a monthly fee for using their TradingView charts in my analysis. Awesome broker, where the trader really comes first! 🌟🤝📈

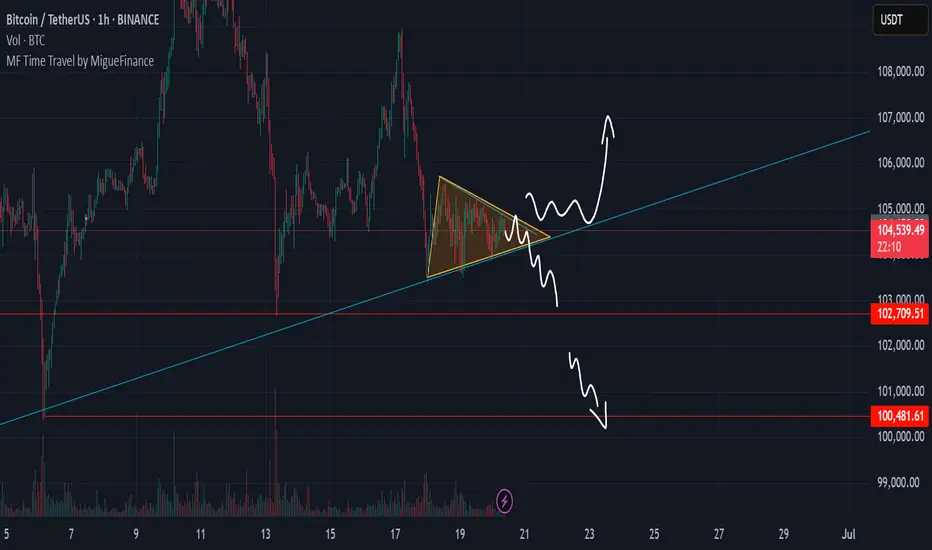
Bitcoin Triangle Pattern, Bullish or Bearish ?We can see LTF bitcoin create mini triangle pattern after downtrend, basically its called bearish triangle continuation. but lets see what is the side will be break
100k vs 107k
What could be the target for DELL?DELL can easily go up +25% in the next 2 months and 50% in the next 6 months.

Bitcoin Volatile After Fed Governor Hints at July Rate Cut!
Waller made these comments in an interview with CNBC on Friday, just two days after the Federal Reserve voted to keep interest rates unchanged for the fourth time in a row. Waller's dovish comments boosted Bitcoin, but only briefly.
Perhaps the constant insults from US President Donald Trump are finally having an effect, as Federal Reserve Governor Christopher Waller hinted at a rate cut "as early as July" in an interview with CNBC on Friday.
Crypto and stock markets initially rallied on the news, with Bitcoin climbing to over $106,000, but the cryptocurrency has retreated to $104,000 as of press time. Market performance was mixed, with the Dow up 0.16%, while the S&P 500 and Nasdaq fell 0.26% and 0.64%, respectively. Crypto markets also underperformed, initially rising 0.47% before falling 0.13% at the time of writing.
Trump has been making fun of Federal Reserve Chairman Jerome Powell for weeks, calling him a "dumb," "stupid," and "dumb" for not cutting rates. The president even coined the nickname "Too Late," accusing Powell of being slow to move and not moving fast enough to lower rates. But now, at least according to Waller, the president may soon see the rate cut he has been calling for, possibly as soon as next month.
"I think we're in a position where we could do that, and it could be as early as July," Waller said, referring to a potential rate cut. "That would be my view, and whether the committee would agree to it is another matter."
Bitcoin is currently hovering around $104K, trading between $103,932.09 and $106,539.38 over the past 24 hours. The current price represents a slight loss of 0.05% on the day, and a 1.22% drop over the past week.
Trading volume rose 1.54% to $42.65 billion, showing continued interest from market participants. Bitcoin's total market capitalization fell slightly to $2.07 trillion, down 0.06% from the previous day. Despite its choppy performance, BTC's market cap share rose slightly to 64.94%, indicating a slight increase in funds outflow from other cryptocurrencies.
Meanwhile, BTC futures open interest increased by 0.90% to $700.9 billion, which could mean increased speculation in the derivatives market. A total of $40.03 million in long positions were liquidated in the past 24 hours, painting a picture of overly aggressive bull market participants. At the same time, $22.61 million in short positions were also liquidated, totaling $62.64 million since yesterday.

#BTC bearish cup-handle structure, beware of a pullback!📊#BTC bearish cup-handle structure, beware of a pullback!
🧠From a structural perspective, we broke below the neckline, which means a bearish structure is established, so we need to be wary of further declines.
➡️Yesterday's decline was rapid, so we can wait for a rebound to appear and look for shorting opportunities near the blue resistance area or the downward trend line.
➡️Since it is the weekend, the trading volume may be less. If there is no rebound, then we need to wait patiently for a period of sideways consolidation before looking for shorting opportunities.
⚠️Note that the area around 106500 is a support-resistance conversion zone. If it breaks through here and stabilizes, we can remain optimistic.
🤜If you like my analysis, please like 💖 and share 💬 BITGET:BTCUSDT.P

XRP road map (Daily)This could be the last chance for Ripple; if the triangle breaks downward, the price could enter a channel below $2.
Best regards CobraVanguard.💚

Do you think I'm joking ???The price is currently forming the second corrective wave, and a slight price drop to reach higher levels is normal.
Best regards CobraVanguard.💚

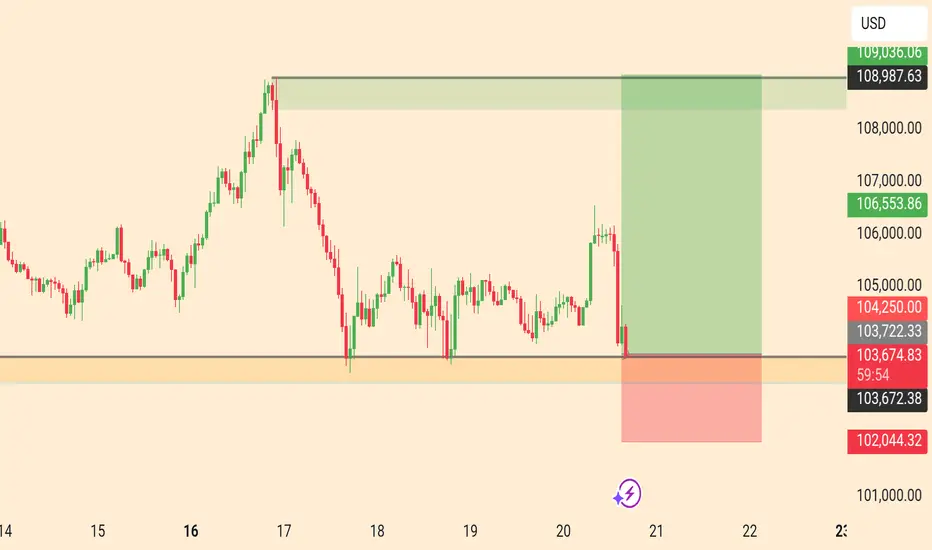
Bitcoin (BTC/USDT) – Bearish Breakdown in Play (4H)BTC has lost key support at $103,573 on the 4-hour timeframe, breaking down from the recent consolidation zone. The rejection from the lower highs and weakening RSI suggest more downside pressure ahead.
Technical Breakdown:
Support Broken: $103,573 (now acting as resistance)
Current Price: $102,246
Next Key Support Zones:
$101,410 (short-term bounce zone)
$97,340 – critical horizontal support
$93,343 – potential deeper flush area
Resistance to Watch:
$103,573 (retest = short opportunity)
$105,807 (major rejection zone)
Short Setup (Signal Style):
Short Entry: ~$103,500 (if retested)
Stoploss: Above $105,800
Targets:
TP1: $101,400
TP2: $97,300
TP3: $93,300
Final Note:
Trend remains bearish below $103.5K. Bulls need to reclaim that level fast or further downside becomes likely.
Not financial advice. DYOR.
