Potential Sell Opportunity EURUSDReasons I think this pair will fall:
- Bearish RSI Divergence on Daily chart
-RSI overbought on H4 and Daily
- Confirmed trend losing momentum with double top.
thoughts?
Chart Patterns

SPX vs VIX: Is this a sign of a bullish market?VIX has seen a strong decline in the past 2 months following the massive surge of Feb-March due to the Tariff War. In contrast, the S&P500 rose massively to almost its ATH, which is a natural response as the two assets are negatively correlated. This VIX pattern has been seen during every major market bottom in the past 15 years, the strongest of which was the 2020 COVID crash. This is a sign of a very bullish market, TP = 6,800 by the end of the year.
## If you like our free content follow our profile to get more daily ideas. ##
## Comments and likes are greatly appreciated. ##

ALTCOINS: Market bottomed and about to surge.The Altcoin market is almost oversold on its 1W technical outlook (RSI = 30.160, MACD = -0.160, ADX = 18.210) but this very same 1W RSI pattern has emerged numerous times before an altcoin market surge (Altseason). How high it can go depends on whether the Fed will cut on its next meeting or not. Nevertheless, this level is an excellent opportunity to start investing in altcoins.
## If you like our free content follow our profile to get more daily ideas. ##
## Comments and likes are greatly appreciated. ##

#Bitcoin is approaching a strong demand zone!#Bitcoin is approaching a strong demand zone!
This level has acted as solid support several times in the past.
According to the Fibonacci levels, we’re currently at the 0.5 level, which makes this area even more significant.
In my opinion, we’re likely to see a bounce from here.
However, if the price fails to hold this level, there’s a good chance we’ll retest the $92K zone.
But for that to happen, we need a daily close below $100K.
Until then, we’re still in a safe zone.
I’ll keep you updated as things develop.
If you find my updates helpful, don’t forget to like and follow for more!
DYOR, NFA

long term short on QQQ level $501 and 465there some level i would like to to look for on QQQ$
Main target is level $465- 495 -$ 501
Disclaimer- it a opinion

ZETA: when a wedge isn’t just a wedge — it’s a launchpadTechnically, this setup is textbook clean. Price completed the fifth wave within a falling wedge and instantly reacted with a bullish breakout. The expected breakdown didn’t happen — instead, buyers stepped in, confirmed by rising volume. All EMAs are compressed at the bottom of the structure, signaling a clear shift in momentum. The volume profile shows strong accumulation around $14, while the area above current levels is a vacuum — ideal conditions for acceleration.
The key resistance zone is $16.70–17.20 — former base highs and the 0.236 Fibonacci retracement. If price breaks this area with volume, the next stop is likely $24.48 (0.5 Fibo). Classical wedge targets land at $38.28 and $55.33 (1.272 and 1.618 extensions). If a trending leg begins, it could move fast — because there’s simply no supply overhead.
Fundamentals:
ZETA isn’t a profitable company yet, but it shows consistent revenue growth and aggressive expansion. Capitalization is rising, debt is manageable, and institutional interest has increased over recent quarters. In an environment where tech and AI are regaining momentum, ZETA could be a speculative second-tier breakout candidate.
Tactical plan:
— Entry: market or after a retest of $14.00–14.30
— First target: $17.20
— Main target: $24.48
— Continuation: $38.28+
— Stop: below $13.00 (bottom wedge boundary)
When the market prints a wedge like this and the crowd ignores it — that’s often the best trap setup. Only this time, it’s not for retail buyers. It’s for the shorts. Because when a falling wedge breaks to the upside with volume — it’s time to buckle up.

Next Week Gold Trend Forecast & Trading TipsDuring this round, the price was sold off sharply from the historical high of 3,500 to 3,120 before rebounding. After consecutive rallies, it faced pressure and fell back to 3,452 due to the fading of market risk aversion. On Friday, it rebounded from a low of 3,340. The daily chart recorded a consolidative bearish candle, with the K-line combination leaning bearish, while the 4H chart showed signs of stopping the decline.
In the short term, it is expected to consolidate below 3,400 next week. For the medium term, attention should be paid to the geopolitical crisis and the Federal Reserve's July interest rate decision. A breakthrough node will be ushered in after confirming the resistance above 3,400.
On the short-term 4-hour chart, the support below is focused around 3,340-45, and the short-term resistance above is around 3,380-85. The key focus is on the suppression at the 3,400-05 level. The overall strategy of going long on pullbacks within this range remains unchanged. For medium-term positions, it is advisable to stay on the sidelines, avoid chasing orders, and patiently wait for entry at key levels.
Investment itself is not the source of risk; it is only when investment behavior escapes rational control that risks lie in wait. In the trading process, always bear in mind that restraining impulsiveness is the primary criterion for success. I share trading signals daily, and all signals have been accurate without error for a full month. Regardless of your past profits or losses, with my assistance, you have the hope to achieve a breakthrough in your investment.

Gold Market Weekly: Analysis & OutlookI. Market Trends and Institutional Game Analysis
This week, the gold price exhibited a typical volatile downward pattern, starting its correction from $3,450 on Monday and hitting an intraday low of $3,340 on Friday before rebounding sharply to around $3,370 ahead of the close. This movement essentially represents a "market washing" maneuver by institutions leveraging the short-term lull in Middle East tensions, with bears repeatedly attempting to push prices down by $10–$20 per round. However, each decline encountered significant resistance, starkly contrasting with the unilateral drop in April. Order flow characteristics indicate that bearish momentum has notably attenuated, with low-level selling appearing as a deliberately constructed "bear trap"—a signal reinforcing the unbroken medium-term upward trend of gold.
II. Macro-fundamental Support for Gold's Resilience
1.Escalating U.S. Fiscal CrisisThe U.S. fiscal deficit has reached $1.4 trillion annually, and even the $80 billion revenue increment from tariff wars remains negligible in this context. More critically, the Trump administration’s proposed "Big Infrastructure Bill" is projected to add $4 trillion to the deficit, fundamentally eroding the credit of U.S. Treasuries and the U.S. dollar’s purchasing power. Historical data shows that fiscal deficit monetization consistently drives surges in gold’s safe-haven demand, meaning a decisive peak in gold prices remains unlikely until the deficit issue is resolved.
2.Hidden Geopolitical Risks in the Middle EastThe conflict between Iran and Israel has entered a critical phase, with Iran adopting a hardline stance in negotiations—demanding not only an immediate ceasefire from Israel but also accountability for war initiators and the retention of nuclear rights. Should the situation escalate abruptly over the weekend, the $110 correction seen this week could be fully reversed on the first trading day of next week.
III. Investment Strategy: Capitalize on the "Correction Entry" Window
The market currently exhibits the trait of "limited downside, unlimited upside": geopolitical risks and U.S. dollar depreciation expectations underpin gold’s floor, while unpriced macro uncertainties leave upward potential open. For investors, this correction presents an optimal opportunity to establish medium-to-long-term long positions. We recommend batch entry between $3,350–$3,380, targeting the $3,500 psychological level, with a stop-loss set below $3,320 to mitigate short-term volatility.
Risk Warning : Closely monitor developments in the Middle East over the weekend and the pace of U.S. fiscal bill implementation, as sudden events may trigger sharp fluctuations in gold prices.
I am committed to sharing trading signals every day. Among them, real-time signals will be flexibly pushed according to market dynamics. All the signals sent out last week accurately matched the market trends, helping numerous traders achieve substantial profits. Regardless of your previous investment performance, I believe that with the support of my professional strategies and timely signals, I will surely be able to assist you in breaking through investment bottlenecks and achieving new breakthroughs in the trading field.

TESLA SHORT SELL ANALYSIS – JUNE 21, 2025 (NASDAQ 100 | S&P 500)Technical Analysis/Short Sell Call: TESLA (U.S STOCK)
Current Status: Tesla recently reached a high of $368 in an uptrend within a larger downtrend. However, it broke down the trend line (marked in red dashed lines) and made a downward spike. Volumes suggest the stock is expected to continue its downward momentum.
Technical Outlook: The breakdown of the bullish trend line and the formation of a downward spike indicate potential further decline. Additionally, a bearish excess line formed around $330. Given the current technical setup, Tesla seems like a good candidate for a short trade or exiting any previous long trades.
🚨 TECHNICAL SHORT SELL CALL – TESLA 🚨
Short Sell Level 1: $322 (Current Price)
Short Sell Level 2: $331
Short Sell Level 3: $335
Targets:
TP 1: $310
TP 2: $293
TP 3: $281
Stop Loss:
Above $345 on closing basis
Risk Reward: 1:7
Caution: Please sell in 3 parts within the selling range. Close at least 50% of your position at TP1 and trail the stop loss to protect profits in case of unforeseen market conditions.

GBPUSD: Bearish After Opening 🇬🇧🇺🇸
There is a high chance that GBPUSD will drop after the market opening.
I see a strong bearish confirmation after a test of a recently broken trend line.
The price formed a head & shoulders pattern and violated its neckline
on an hourly time frame.
Goal - 1.3425
❤️Please, support my work with like, thank you!❤️
I am part of Trade Nation's Influencer program and receive a monthly fee for using their TradingView charts in my analysis.

Navigating a Pullback in Natural GasNatural gas prices have been on a wild ride lately, with a recent pullback raising questions about the future of this energy source. This video provides insights into navigating this market volatility, offering actionable strategies for live trading in the midst of uncertainty.
Current weather forecasts for the U.S. show neither extreme heat nor cold—limiting heating or cooling demand. This typical spring-to-summer lull supports low prices .
Although rig counts in the U.S. are falling—the latest count shows an 8‑week decline—production remains ample. Storage levels remain healthy, and oversupply worries persist .
Natural gas rallied earlier today but faced resistance at the $4/mmBtu mark—a major psychological barrier. After hitting that ceiling, prices gave back gains, a typical sign of "rally exhaustion"

Sei Goes Bullish, Same Pattern & SequenceIt is the same price pattern and sequence. A bullish wave ends December 2024 and leads to a correction. The correction ends with a bottom 7-April. This bottom marks the start of a new phase, the bullish cycle. Recently, SEIUSDT produced a higher low and this higher low marks the start of the next advance, a bullish continuation.
Makes sense?
Bullish action already confirmed —The bigger picture
Today we have three green candles and the most bullish since the end of the initial bullish breakout. If you take this chart together with my other recent publications: COIN, ETH, DOGS, NOT and BCH, you can start to decipher the bigger picture. It is already confirmed.
A great opportunity
I am here to alert you of the event before it happens. Taking action now can be life changing or simply put, taking action now can translate into huge profits; the best possible entry after the 7-April low.
Don't worry, even if this opportunity gets away from you, the market will continue to produce countless more; endless opportunities the Cryptocurrency market has to offer for sure.
Thanks a lot for your continued support.
Namaste.

GOLD → Continuation of the global trend... To 3350?FX:XAUUSD is testing trend support within a correction. Against a complex fundamental backdrop (the Middle East, Fed comments, Trump's desire to lower rates), the price may continue to rise.
The price of gold rose from a weekly low of $3,363 on Thursday thanks to increased demand for safe-haven assets following reports of possible US strikes on Iran. Markets are ignoring the Fed's hawkish decision to maintain its tight policy and rate forecasts. Traders are waiting for new signals from the Middle East, given the risk of increased volatility due to low liquidity in connection with the US holiday.
Technically, a bullish wedge pattern is forming as part of the correction. The breakdown of the pattern's support did not lead to a decline, but a return of prices and a breakout of resistance could trigger growth after liquidity returns.
Resistance levels: 3373, 3403, 3420
Support levels: 3349, 3320
Before growth, a retest of the trend support or the 3350 zone is possible. However, if the price goes above 3375 and the bulls hold their ground above this level, then we can expect growth to continue within the trend.
Best regards, R. Linda!

XAUUSD Beginning of a Trend Reversal? Bearish Move IncomingGold is showing signs of potential downside pressure on the 4-hour chart. After a rejection from the upper volatility band and a failure to sustain bullish momentum above the dynamic EMA cloud, price has rolled over and is now trading below the midline support area.
🔻 Bearish Structure Developing:
Price rejected strongly from the upper gray zone (Resistance band).
A new lower high has formed, aligning with bearish market structure.
Candles are trading under the red-to-blue transition EMA ribbon, indicating increasing bearish sentiment.
🎯 Trade Setup:
Entry: Near 3,365
SL: Above the recent high near 3,406
TP: Targeting the lower band support around 3,300 – 3,323

$IREN could be next...100%+ UpsideNext Retail Darling... NASDAQ:IREN TA looks the part! 👀
Breakout 🎯$22 then $31
CupnHandle almost breaking out here with measured moves a lot higher!
Volume shelf acting as a launch pad.
WR% is uptrnding as well!
This one's looking good based on the TA.

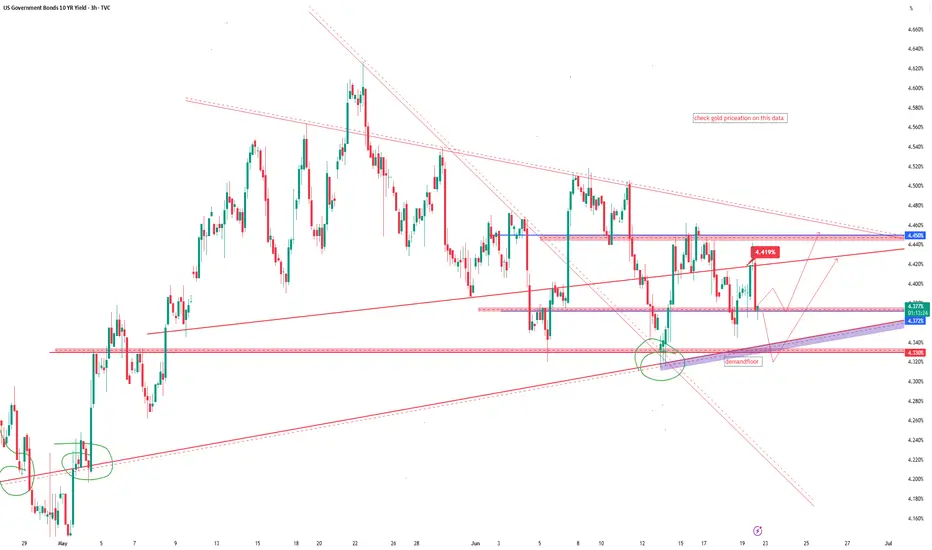
US10Ythe US 10-Year Treasury Yield (US10Y) stands at 4.39%-4.5%,The 10-year yield is a key benchmark for long-term interest rates in the United States and is closely watched by investors as an indicator of market sentiment regarding economic growth, inflation, and Federal Reserve policy.
The yield has been rising recently, reflecting investor concerns about US fiscal policy, inflation, and the outlook for Federal Reserve rate cuts.
Federal Reserve Interest Rate Decision (June 2025)
The Federal Reserve held its key interest rate steady at 4.25%–4.50% at its June 2025 meeting.
This marks the fourth consecutive meeting with no change in rates, as the Fed continues its cautious, data-dependent approach amid persistent inflation and moderate economic growth.
The Fed’s latest “dot plot” and projections indicate that two 25-basis-point rate cuts are still possible by the end of 2025, but expectations for cuts in 2026 and beyond have been reduced.
Key Drivers and Outlook
Yield Movements: The 10-year yield has climbed amid concerns about US fiscal deficits, credit rating downgrades, and the impact of tariffs and trade policy on inflation.
Fed’s Tone: The FOMC statement and projections reflect ongoing stagflationary pressures—slower growth, persistent inflation, and a slightly rising unemployment rate.
Market Expectations: Markets are pricing in two rate cuts by year-end, most likely in September and December, but nearly half of Fed officials see little or no room for cuts in 2025 if inflation remains sticky.
Conclusion
The US 10-year Treasury yield remains elevated as markets weigh fiscal risks, inflation, and the Fed’s cautious stance.
The Fed is holding rates steady but signaling that two rate cuts remain possible in 2025, with future moves highly dependent on incoming data, especially inflation and labor market trends.
Investors should expect continued yield volatility as economic and policy uncertainties persist.
LONG WEEKFor me the bias is bullish for next week and beyond.
Weekly support tapped and 3500 is next big restance for a PB.
Then ATH.
Good area to look for swing longs, possible longtime runners.

His name is Monero- Despite numerous attempts by various projects to create private coins or tokens, none have succeeded meaningfully.
- Monero is the Bitcoin of the darknet. They can delist it or try to kill it, but Monero is here to stay.
- With rising concerns over privacy and the inevitable push toward CBDCs, the next bullish cycle could drive XMR to a new ATH, $1,000 is a realistic target, not a fantasy.
- Everything you need is in the chart. This is not financial advice, buy only when you believe the time is right.
Happy Tr4Ding !

SILVERSilver, US 10-Year Yield, and Interest Rate Dynamics
the relationship between silver prices, the US 10-year Treasury yield (US10Y), and interest rates is characterized by strong inverse correlations, driven by macroeconomic forces and monetary policy expectations. Below is a detailed analysis:
1. Silver and US 10-Year Yield: Inverse Correlation
Core Mechanism: Silver prices typically move inversely to the US 10-year yield. When bond yields rise, silver becomes less attractive as a non-yielding asset, increasing its opportunity cost. Conversely, falling yields boost silver’s appeal.
Current Data (June 2025):
US10Y: ~4.377% (slightly down from recent peaks).
Silver (XAG/USD): ~$36.02.00/oz,
Historical Evidence:
A correlation coefficient of -0.94 between silver and 5-year yields (and -0.86 vs. 10-year yields) confirms this inverse link.
Periods of declining yields (e.g., 2024–2025) coincided with silver rallies (Aprail 2024 and jan 2025) silver buyers come bullish
2. Interest Rates and Silver: Opportunity Cost Driver
Rate Hikes: Higher interest rates strengthen the dollar and increase the opportunity cost of holding silver, pressuring prices.
Rate Cuts: Lower rates weaken the dollar and reduce silver’s opportunity cost, boosting demand.
Fed Policy Impact (June 2025):
The Fed held rates at 4.25%–4.50%, but signaled potential cuts in late 2025, will give silver under valued metal a bullish impulse.
Geopolitical/Safe-Haven Demand Conflicts (e.g., Israel-Iran) or recessions increase silver’s appeal.
Industrial Demand Renewable energy/electronics demand provides structural support.
4. Current Market Outlook
Bearish Pressures:
Rising bond yields or delayed Fed cuts could trigger silver selloffs.
US10Y above 4.5% historically pressured silver.
Bullish Catalysts:
Fed rate cuts (expected late 2025) and falling real yields could drive silver toward $40/oz. to 50$
Geopolitical risks and sustained central bank buying (e.g., inflation hedging) add upside.
Conclusion: Silver remains highly responsive to US10Y and interest rate shifts, with real yields being the paramount driver. In 2025, silver’s rally hinges on Fed easing, subdued real yields, and safe-haven demand—though bond yield resurgences pose risks.
#silver #gold #dollar

Bulls eating dips like a fat man eats chips! AMD hitting my next target here around 126, short term dip into new trend support is possible, looking for 140s after this small consolidation period is over..
pretty simple, boost and follow for more! ❤️🔥

gold bullish trading idea gold trading idea gold follow bullish channel gold make higher high and higher low now gold make higher high 3480

Bitcoin may rebound from support line of wedge and start to growHello traders, I want share with you my opinion about Bitcoin. Initially, the price was trading inside a well-defined range, moving sideways with repeated rejections from both support and resistance. After several attempts to stay above the support zone, BTC finally broke down and sharply declined below the 104000 level, entering the buyer zone. However, the decline was short-lived. Price quickly rebounded from the lower boundary and formed a strong bullish candle, suggesting that buyers were still active. After this recovery, BTC began forming a wedge pattern, with a gradually narrowing structure between the resistance line and the ascending support line. This kind of price action typically signals a buildup of pressure and potential breakout. Currently, BTC is once again testing the support line of the wedge and hovering near the buyer zone, where it previously reversed. This level has proven significant and is now being retested. Given the current structure, the wedge formation, and price behavior near the support, I expect BTC to rebound from this zone and start climbing back toward the upper resistance area. My current TP 1 is set at 106800 points, which aligns with the mid-level of the previous impulse zone and the inner resistance of the wedge. Please share this idea with your friends and click Boost 🚀
Disclaimer: As part of ThinkMarkets’ Influencer Program, I am sponsored to share and publish their charts in my analysis.

EUR/USD - H4 - Triangle Formation (31.05.2025)The EUR/USD pair on the H4 timeframe presents a recent Formation of a Triangle Pattern.
1. Wait for Breakout with Good Volume
2. Conformation in short Timeframe Must
🎁 Please hit the like button and
🎁 Leave a comment to support for My Post !
Fundamental Updates :
Dollar mixed on tariff uncertainty, U.S. President Donald Trump to battle a U.S. trade court ruling that blocked most of his proposed tariffs.
Your likes and comments are incredibly motivating and will encourage me to share more analysis with you.
Best Regards, KABHI_TA_TRADING
Thank you.
Disclosure: I am part of Trade Nation's Influencer program and receive a monthly fee for using their TradingView charts in my analysis.
