Geopolitical Hedging vs Monetary Policy: Gold Trading TipsGold prices continued this week's correction trend during Friday's Asian trading session, once falling near the one-week low. Although there was a slight rebound afterward, the overall trend remained in a weak adjustment pattern. This correction was mainly affected by the hawkish attitude of the Federal Reserve. At this week's policy meeting, the Fed kept interest rates unchanged, and the dot plot showed that only two rate cuts are expected by the end of 2025, while the rate cut expectations for 2026 and 2027 have been postponed. Even so, the US Dollar Index fell after hitting a weekly high, which provided some support for gold prices. In addition, growing trade concerns and escalating tensions in the Middle East have enhanced safe-haven demand, limiting the decline in gold prices.
From the 4-hour chart of gold, the current bullish momentum is dominant, and the resistance near 3375-3380 is clear. The pullback of gold prices has not broken through the upward channel for the time being, and the medium-to-long-term upward structure remains intact. If the Middle East conflict escalates or trade risks intensify, it may trigger a rebound and repair rally in gold prices. The daily chart closed in a doji star pattern, with prices retesting the middle 轨 of the Bollinger Bands, maintaining a volatile downward rhythm. The hourly chart shows significant downward characteristics, and a bearish strategy can be maintained before the resistance is broken. The resistance range is 3375-3380, and the support range is 3340-3345.
XAUUSD
sell@3070-3075
tp:3360-3350
Investment itself is not the source of risk; it is only when investment behavior escapes rational control that risks lie in wait. In the trading process, always bear in mind that restraining impulsiveness is the primary criterion for success. I share trading signals daily, and all signals have been accurate without error for a full month. Regardless of your past profits or losses, with my assistance, you have the hope to achieve a breakthrough in your investment.
Chart Patterns

ETH/USDT Bullish Reversal from Support Zone Chart Analysis:
The chart illustrates a range-bound consolidation with clear support around $2,381.45 and resistance near $2,556.54.
🔍 Key Observations:
✅ Multiple Support Tests: Price has tested the support zone several times (highlighted by orange circles) and respected it, indicating strong buying interest at the lower boundary.
📉 Fakeout and Recovery: A false breakout below support occurred, but the candle quickly reversed, signaling a bear trap and potential for bullish momentum.
🔼 Rejection Wick & Consolidation: A strong rejection wick on the most recent candlestick shows buyers defending the zone aggressively. The current price action shows consolidation — a bullish accumulation pattern.
🎯 Upside Target: Based on the range breakout projection, the price could potentially revisit the resistance zone at $2,556.54, marked as the TARGET on the chart.
📌 Technical Outlook:
🟢 Bias: Bullish as long as the price holds above $2,381.45.
💹 Entry Idea: Aggressive buyers may enter near current levels with a stop below the wick low.
🛑 Risk Level: Tight stop-loss needed as the structure relies heavily on support holding.
📈 Conclusion:
A classic range rebound setup is forming with potential for upside movement back toward resistance. A breakout above $2,556.54 could initiate a trend continuation rally

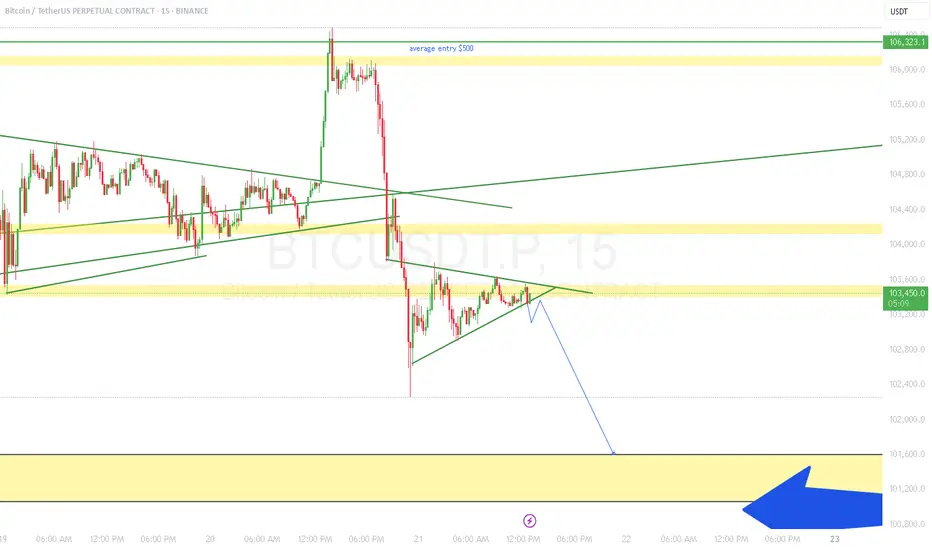
BTCUSD 15M CHART PATTERN This chart is a 15-minute candlestick chart of Bitcoin (BTC/USD) from TradingView, showing recent price movement and a potential bullish prediction.
Key Observations:
1. Downtrend & Reversal Point:
A significant downward move is marked with a red arrow, signaling a potential short-selling opportunity or a bearish trend that recently ended.
The price then forms a rising trendline (in red), suggesting an ascending triangle pattern — a bullish continuation signal.
2. Current Price:
As of the time on the chart (June 21, 2025, 04:56 UTC), the BTC price is approximately $103,441.
3. Breakout Projection:
A green arrow indicates a breakout point above the resistance level, supported by the red trendline.
The chart suggests a projected bullish move with a target near $108,090, illustrated with an upward zigzag path in a shaded box — representing the possible path price might follow post-breakout.
4. Chart Analysis Implication:
If the price holds above the red trendline and breaks above the consolidation range, the projection implies an upward target of around $108,000–$110,000.
Conclusion:
The chart author anticipates a bullish breakout from a consolidation pattern, aiming for higher levels in the short term. However, a failure to hold above the rising trendline might invalidate the bullish scenario.
Would you like a technical analysis summary, a trading strategy based on this chart, or help interpreting more details?

MAJOR TOP IS NOW IN PLACE 5th wave up from 4835 has ended 6059The chart posted is that of the sp 500 and I now have counted 5 waves up as ending based on this wave structure I will look for two things to happen a rather deep ABC if there is a bull market intact and it should decline in 3 waves back to .236/382 area from 6059 - 4835 The 4th wave or A low This MUST HOLD at .382 or The cycle has ended the 5 wave sup from march 23 low 2020 I sold longs this morning based on NAAII exposure and Now have moved to a 100 % long VERY DEEP IN THE MONEY PUTS 2027 Best of trades The WAVETIMER

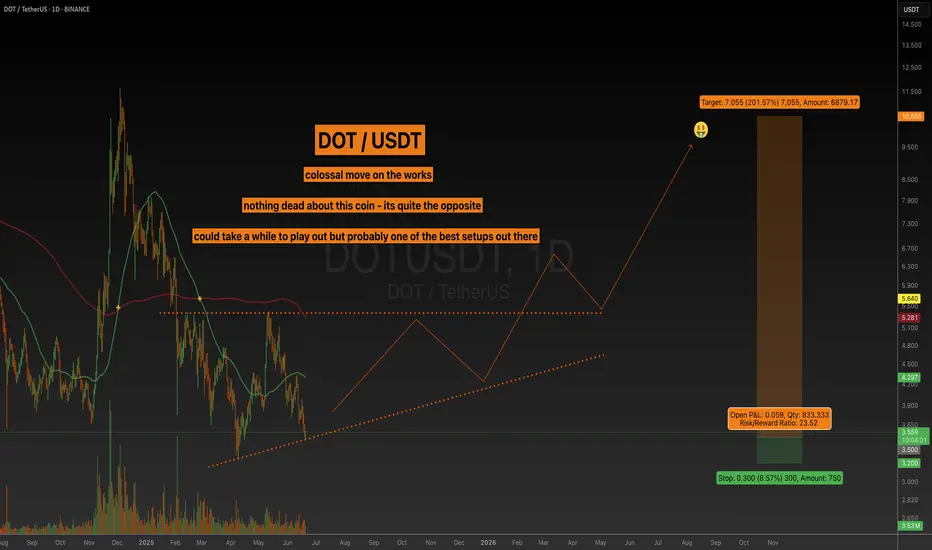
Polkadot - BEWAREI have been checking out some news and fundamentals lately on this coin.
LMAO makes me laugh people still look into trading memes, investing, whatsoever... Those might get burned once again, cause this BTC.D party aint nowhere to being done. It will continue to remove liquidity from coins with no use case.
Over 30 MILLION coins, and starting today, 99% of them will not recover!
Polkadot will though, BCH will, AVAX will, LINK will, well you get the drill.
This post is about DOT so i'll focus on it. Theres HUGE interest in these levels, and different than a lot of coins it hit a perfect .886 fib and is bouncing creating a massive Ascending Triangle, that most likely will finish by next year. Thats a good 6 months from now, but its worth it.
As a matter of fact, I dont think I could name 3 other coins that in the long run will out perform DOT. Right now they are, SOL for instance is... but I dont think SOL will out perform in a few years as DOTs fundamentals are way heavier.
TOWL LONG TRADE - (SECOND STRIKE) 21-06-2025TOWL SECOND STRIKE BUY CALL | 21 JUNE 2025
TOWL stock, as per our previous buy call, is in an uptrend and has already achieved TP1. It has now crossed above the axis line, which is expected to act as strong support and prevent further downward price action. Given this confirmation, we see a high-probability second strike entry opportunity developing for continuation of the uptrend.
🚨 TECHNICAL BUY CALL – TOWL 🚨
Buy Levels:
Buy 1: 164.85 rupees (current price)
Buy 2: 157.60 rupees
Buy 3: 150.00 rupees
Target Prices:
TP 1: 175.00 rupees
TP 2: 200.00 rupees
TP 3: 220.00 rupees
Stop Loss (Closing Basis): Below 140.00 rupees | Risk Reward Ratio: 1:3.6
Execution Strategy:
Enter in 3 parts at the listed levels. Book 50% profits at TP1 and then trail the stop loss. Do not invest more than 20% of your capital in one script.
📢 Disclaimer: Redistribution or use of these signals without prior permission and proper credit to The Chart Alchemist (TCA) is strictly prohibited — especially by paid groups. We are completely independent and not affiliated with any brokerage.
Kindly support our efforts by boosting and sharing this idea!

STML LONG TRADE 21-06-2025 (textile)STML Buy Call:
STML has been in a gradual downtrend after achieving a high of PKR 81, reaching a low of around PKR 26. After consolidating and observing supply at the support level, the stock seems ready for an uptrend. Volume Spread Analysis supports the probability of an upcoming uptrend.
📈 Buy Levels:
Buy 1: PKR 31.52 (Current Price)
Buy 2: PKR 29.00
Buy 3: PKR 26.70
Target Prices:
TP1: PKR 43.90
TP2: PKR 66.90
TP3: PKR 80.70
Stop Loss: Below PKR 20.00
Risk-Reward Ratio: 9.1

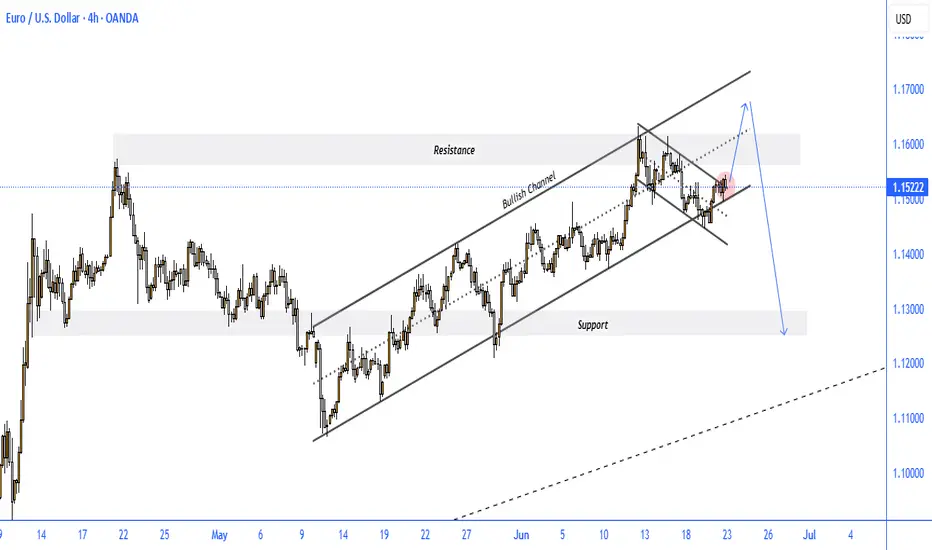
EURUSD BEARISH SETUP
The EUR/USD 4-hour chart reflects a significant technical setup, showing price action within a bullish ascending channel that has recently broken to the downside, forming a falling wedge pattern—typically a bullish continuation signal.
Key Observations:
Bullish Channel Broken: The price broke below the ascending channel earlier this month, signaling initial weakness.
Falling Wedge Formation: A bullish falling wedge has developed, and the pair is now testing its upper boundary near 1.1522, attempting a breakout.
Resistance Zone: The price is approaching a key resistance area between 1.1550 – 1.1600, which aligns with previous highs and the wedge's upper edge.
Scenario Projection:
A temporary bullish breakout toward the resistance zone is expected.
If the pair gets rejected from this resistance, a sharp decline toward the major support area near 1.1300 is likely.
Bearish Confirmation: A clear rejection at the resistance zone followed by a break below the recent minor support (red zone) would confirm the bearish move.
Conclusion:
While short-term bullish momentum may push EUR/USD slightly higher, the confluence of resistance levels suggests a high probability of rejection. Traders should watch for reversal signals in the 1.1550–1.1600 zone, as failure to break higher could lead to a bearish move toward 1.1300 in the coming days.
BTCUSD 1D | big consolidation
🧠 1. Pattern and Market Structure Identification
✅ Trend and Pattern: Bullish Flag
• Structure: Price forms a descending consolidation pattern (descending channel) after a sharp upward impulse — this is a classic characteristic of a bullish flag.
• Breakout volume occurred from the consolidation zone near the green support area → an early signal that bulls are active.
• However, the price is currently retesting the breakout area and is testing the demand zone again.
📊 2. Volume Analysis
• Volume spikes (purple arrows) occurred at several key points:
• Initial breakout
• Support retest
• High volume during the breakout = valid breakout confirmation.
• Currently, volume is slightly declining = a signal of consolidation and possible accumulation.
📉 3. Support & Resistance Levels
• Strong Support: 96,961 USDT (marked by the blue line and breakout volume).
• Major Resistance: 111,980 USDT (all-time high and projected target from the flag breakout).
• Current Price: 103,272 USDT → sitting between these two key levels.
🎯 4. Potential Price Direction
Bullish Scenario:
• If the 96,961 USDT support holds, price could continue upward → the bullish flag target = projected height of the flagpole.
• Conservative Target: 111,980 USDT (ATH)
• Aggressive Target (if ATH breakout occurs): 115,000+ USDT
Bearish Scenario:
• If price breaks below 96,961 USDT with strong volume, it could invalidate the bullish pattern and drop further to the 92,000 – 90,000 USDT range.

The Chart you don't want to see: Coinbase Vampire attacked ETHBrian Armstrong is a significant influencer in both Silicon Valley and now Washington, D.C., where he is instrumental in shaping legislation and attracting investments that benefit Coinbase and its shareholders.
Vitalik writes blogs and appoints EF directors who appear to have ambiguous gender identities and are quite out there on the spectrum.
Jesse Pollak is yet another astute player who has leveraged ETH's technology to transform BASE into a powerhouse integrating neatly into Coinbase platform for payments and now DEX trading within app.
ETH will thrive.
However, as we've observed, Joe Lubin's return as a public figure to advocate for and steer the future of Ethereum has never been more crucial.
But will it be sufficient to compete with Brian and Jesse? They seem to be operating on a significantly higher plane.
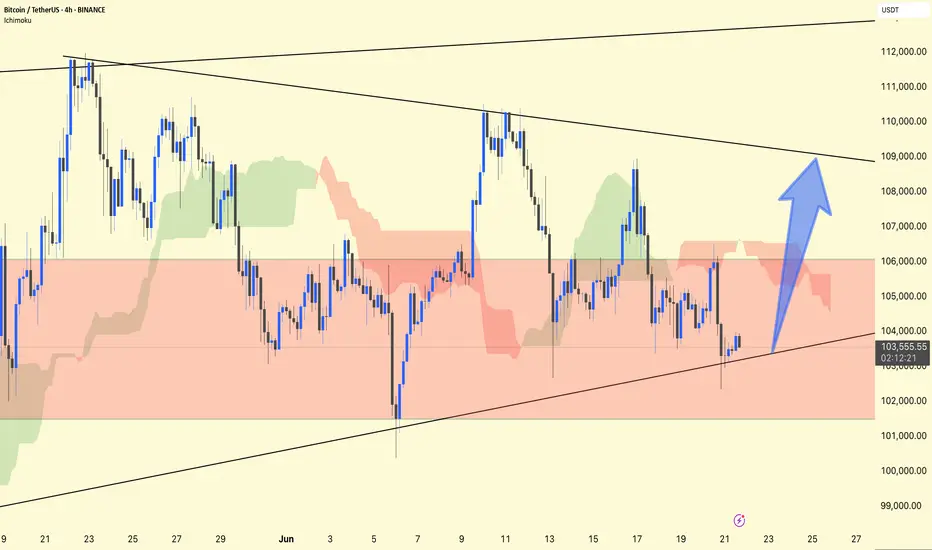
BTC/USDT 4H Technical Analysis UpdateCurrent Setup:
The price hovers within a range (highlighted in red), bouncing off its trendline support.
The RSI at 43 suggests it is close to the oversold zone, indicating a potential recovery.
Bullish Scenario:
If the trendline support holds, a breakout towards $108,000 is highly likely.
(Blue arrow points to the target zone.)
Risk Level:
Watch for a breakdown below the trendline, which could invalidate the bullish setup and send the price towards the $100,000 range.
Trade Plan:
Long entries near trendline support (around $102–103k), with a tight stop loss.
Target the upper trendline (~$108k), adjust as the price develops.
Stay alert!

BILF LONG TRADE/INVESTMENT CALL – 21-06-2025BILF LONG TRADE/INVESTMENT CALL – JUNE 21, 2025
Current Status: BILF has given a powerful breakout post-consolidation till August '24 and has been trading in an upward channel with massive volumes. It recently touched a high of PKR 31.85.
Technical Outlook: Given the stock's performance in massive volumes without shortening of thrust, we expect another leg upwards. After taking support from an axis line, BILF seems ready to resume its upward journey.
🚨 TECHNICAL BUY CALL – BILF🚨
Buy 1: PKR 18 (Current Level)
Buy 2: PKR 17
Buy 3: PKR 16
Targets:
TP 1: PKR 19.7
TP 2: PKR 23.4
Additional targets are PKR 25.9 and PKR 28.6 with a final target of PKR 31.8.
Stop Loss: Below PKR 14.6
Risk Reward Ratio: 5.7 -Day closing
Caution: Please buy in 3 parts within the buying range. Close at least 50% of your position at TP1 and trail the stop loss to protect profits in case of unforeseen market conditions.
📢 Disclaimer: Do not copy or redistribute signals without prior consent or proper credit to The Chart Alchemist (TCA).
If you find this idea helpful, please boost and share it!

short bitcoin In my previous analysis i already gave a short target of 101k
which is about to come by this week
any short holders can hold their trade with SL above 104300
taking new shorts is a risky bet here, which is why ill opt out for this week and wait for further price for a clear view
dont go for longs cause market have no bullish sentiments
liquidity
news
fomc
everything is against btc at this pont
let market come at the support of 101 if it holds and all macro factors agree we can turn bullish
stay safe trade cautious
thanks
BTC Consolidates 104000-105000: Bearish Breakdown Looming?BTC Technical Update: Bitcoin has been consolidating within the 104000-105000 range for an extended period, with the overall trend showing a downward bias. With the overall trend tilting bearish, traders should watch for a break below 103500 to confirm the next leg down. 📉
⚡️⚡️⚡️ BTCUSD ⚡️⚡️⚡️
🚀 Sell@ 105000 - 104500
🚀 TP 102500 - 101500
Accurate signals are updated every day 📈 If you encounter any problems during trading, these signals can serve as your reliable guide 🧭 Feel free to refer to them! I sincerely hope they'll be of great help to you 🌟 👇

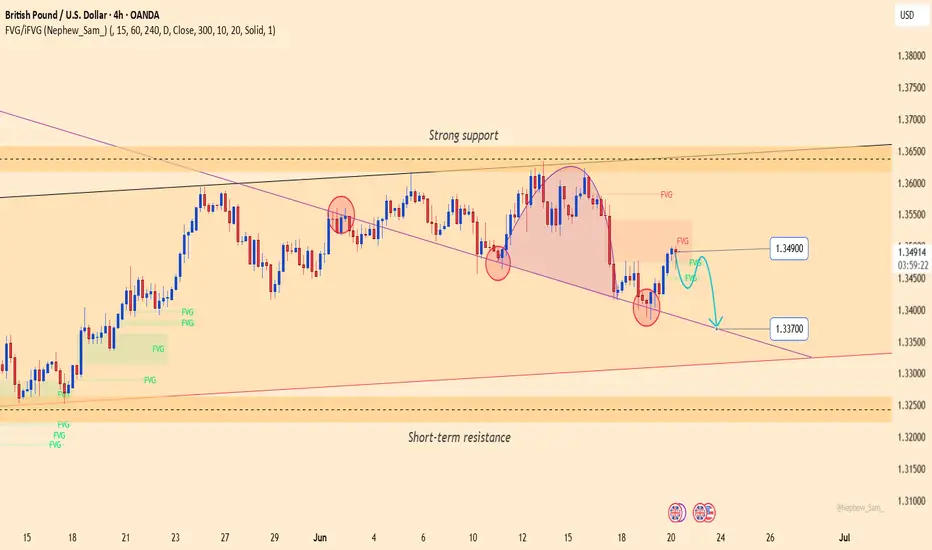
GBPUSD: Bearish pressure persistsGBPUSD is consolidating below a key medium-term resistance zone, with a rounding top and a minor head-and-shoulders pattern forming. The price is currently retesting the Fair Value Gap near 1.34900 — a potential reversal zone if it fails to break higher.
On the fundamental side, the Bank of England's decision to hold interest rates on June 19 disappointed the market. Meanwhile, the US dollar remains supported by safe-haven demand and the Federal Reserve’s hawkish tone, adding further pressure on GBP.
If GBPUSD fails to hold the trendline support near 1.33700, the risk of a deeper decline increases. Both the technical structure and macro fundamentals favor the bears.
ETH/USD Price forms a falling wedge (bearsh pattern).''MARKET WILL GO DOWN MORE SOON STAY STRONG
A potential short entry (sell trade) is plotted just below the supply zone, with stop-loss above the previous structure high.
Displayed trade setup shows a well-calculated R:R, favoring reward over risk.
SL: Tight and above supply
TP: Extends deep into the green demand zone below

BTC Drowdown SELL SETUPIf we will not see fast De-escalation with Middle East conflict we are going to 93k easy!
SELL SETUP
ENTRY: 103364.0
SL: 107635.0
TP: 93384.0
Follow me and you will see more and more good trade ideas
Please don't use big leverages and be carefull!

Bitcoin vs Global M2: The 90-Day Liquidity LagComparing Bitcoin’s price action to the Global M2 Money Supply with a 90-day offset reveals potential macro-driven trends. As liquidity expands or contracts globally, Bitcoin often reacts with a delay. This chart aims to visualize the relationship between monetary expansion and BTC price movement, helping spot broader cycle shifts and long-term momentum.

ETH/USDT 4H Technical Analysis UpdateChart Insights:
ETH is holding the lower trendline support (~$2,430), which indicates a potential reversal zone.
The RSI is hovering around 39, which indicates oversold territory, suggesting that buyers may step in soon.
Expected Move:
The chart predicts a strong move upwards towards the $2,800–2,900 zone (blue arrow), which aligns with the top range boundary.
Trade Plan:
Buy Zone: Near the lower trendline ($2,430–2,450)
Stop Loss: Just below the trendline ($2,400)
Target: Near the upper range boundary (~$2,800–2,900)
Stay alert!

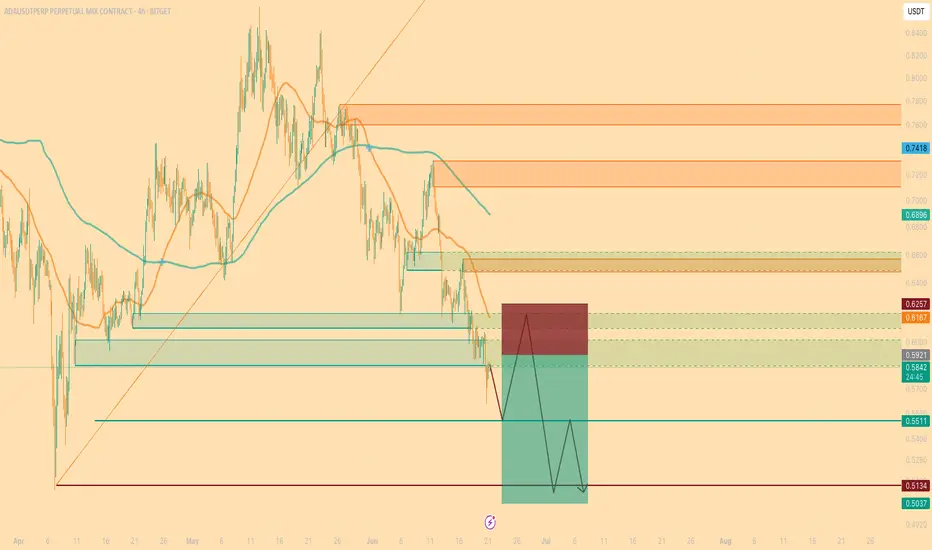
ADA/USDT SHORT SETUP | 4H STRUCTURAL BREAK & LIQUIDITY GRABAfter a confirmed structure break to the downside on the 4H chart, ADA appears to be retracing toward the previous demand zone, now acting as a potential supply/mitigation area.
📌 Idea Overview:
Price is expected to revisit the 0.5921 – 0.6167 range, which aligns with the last broken order block. This retracement would likely serve to collect liquidity above recent highs before a potential continuation to the downside.
📈 Key Technical Insights:
The retracement zone aligns with a former demand area and sits just below a strong resistance at 0.6257.
Confluence: Moving averages, previous imbalance fill, and liquidity resting above prior highs.
Anticipated rejection from this zone could initiate a fresh bearish leg.
📍 Trade Parameters:
Entry Zone: 0.5921 – 0.6167
Stop Loss: Above 0.6257 (4H close confirmation)
Target 1: 0.5511
Target 2: 0.5134
Target 3: 0.5037 (extreme liquidity target)
⚠️ Bias: Bearish
This is a textbook setup combining structure break, order block retest, and liquidity engineering principles. Monitoring price action closely around the retest zone for confirmation.
🧠 "Smart money moves after liquidity – not before."
ABCL: When biotechnology not only curesABCL: When biotechnology not only cures, but also makes your wallet happy!
Hello, fellow investors and those who just like to tickle your nerves on the stock exchange!
Today we have on our agenda (and on the chart) - the stock AbCellera Biologics Inc. (ABCL), which seems to have decided to prove that even at the bottom there is life, and then even throw a party with a breakthrough!
As you can see, our hero ABCL has been playing ‘hide and seek with the trend line’ for a long time, showing an enviable resilience in the fall, just like your sofa after a day at work. However, if you look closely, the ‘ma/ema below price’ signalled that buyers, like secret agents, had already taken control of the situation, preparing for the decisive throw.
And here it is, it's happening! The recent ‘breakout + retest’ is not just a technical term, but a real escape from the ‘bearish’ prison with a subsequent test of strength. Not only did price break through resistance, but it came back to see if it was indeed broken. It's like going out of the house, forgetting your keys, coming back in, getting them, and then going out again - only in the stock market it's a sign of strength and determination!
Now that the dust has settled and the ‘1d’ trendline is behind us, our sights are set on the upside. Targets? Of course! ‘tp1-4.81’ and ‘tp2-6.00’ are not just numbers, they are potential points where we can pat ourselves on the shoulder and say, ‘I told you so!’. А ‘2,618 (6,61)’ - is for the very brave and patient who are willing to wait for the true bull dance.
All in all, ABCL seems to have turned a page in its history, swapping sad ballads for upbeat dance hits. But remember, friends: the market is a capricious thing, and even the most beautiful charts can bring surprises. So, act wisely, don't forget about risks and, of course, enjoy the process! Have a good trading!

ETH: Nice setup patternETH:
Nice setup pattern.
Wait for a shakeout and jump on board.
.
US STOCKS- WALL STREET DREAM- LET'S THE MARKET SPEAK!
