MARKET CONTEXT #2 I 12/12📌 Market Context
Price is currently trading around the highest-volume area of the session — specifically the POC zone around 4,275–4,276 and the VAH zone around 4,286.
This is a high-liquidity region where strong indecision often appears before the market chooses its next direction.
The short-term trend remains bullish, supported by the rising trendline.
Price is testing the VAH, a zone where buyers previously showed strength but where sellers often step in.
The dense Volume Profile above current price shows the market is preparing for either a breakout or a strong rejection.
📌 Price Scenarios
🔵 Scenario 1: Break Above VAH → Bullish Continuation
If price breaks above 4,286 with strong volume:
Next upside targets:
4,295
4,305
This scenario follows the current trend.
A clean H1 close above VAH confirms buyer dominance.
🔴 Scenario 2: Rejection From VAH → Return to POC
If price reacts negatively and gets pushed down from 4,286:
Expect a retest of:
POC zone 4,275–4,276
If POC breaks, the next downside targets are:
VAL zone 4,218–4,220
This scenario happens when buyers weaken or if short-term bearish pressure enters the market.
🟡 Scenario 3: Trendline Break → Deeper Correction
If the trendline is broken:
It signals real weakness from buyers.
Price may drop toward:
4,230
4,218 (VAL)
Further: 4,200 – 4,198
This scenario aligns with a deeper correction after the previous strong upward move.
📌 Summary
Price is sitting right at the key resistance zone (VAH), which will decide the next direction.
Overall trend: bullish, but currently testing a heavy distribution zone.
Two important areas to watch:
4,286 (VAH) → breakout or rejection
4,275 (POC) → if held, buyers remain strong
Reactions around these two zones will give the clearest trading signals.
Chartpattren

USD/JPY) Bearish trend analysis Read The captionSMC Trading point update
Technical analysis of USD/JPY – 1H SMC Outlook
1. Market Context – Bearish Framework
Price is trading inside a descending channel, creating:
Lower highs
Lower lows
This indicates a macro bearish trend and a high probability that rallies into premium areas will be sold.
Your trendlines confirm:
Market respecting upper trendline as dynamic supply.
Lower boundary acting as long-term liquidity pool.
---
2. Current Price Action – Corrective Rally
Recent bullish push looks corrective, not impulsive:
Pullback into imbalance (FVG)
Respecting 50 EMA / under 200 EMA
Weak momentum compared to prior sell legs
This supports the idea of reaction + continuation lower.
---
3. Supply + FVG Confluence (Main POI)
The blue box marks a strong supply/FVG zone around:
155.45 – 155.65
Confluences:
Imbalance fill
Previous supply zone
Structure mitigation level
Upper trendline touch
200 EMA overhead
This is a premium zone for shorts.
---
4. Liquidity Perspective
There is resting liquidity:
Above POI
Enough liquidity to fuel a sharp rejection
Expect a wick into supply (sweep)
Below price
Equal lows / clean structure at 154.08
Major liquidity magnet
This supports a sell-side target.
---
5. Expected Price Behavior (Base Case)
Ideal flow (as drawn on chart):
1. Price taps into FVG + supply
2. Rejection with displacement
3. Lower high forms
4. Expansion sell-off
5. Sweep of downside liquidity
Primary target:
154.087
Extended target (channel low):
153.60 – 153.30
---
6. Entry Plan (If Trading This)
Entry:
155.45 – 155.65 (FVG/Supply zone)
Stop:
Above rejection wick
155.90 – 156.05 depending on aggressiveness
Targets:
1. 154.70 (partial)
2. 154.08 (model target)
3. 153.60 (runner)
R:R potential: 1:3 to 1:6
---
7. Validations & Confirmations
Lower time frame confirmation (5–15m):
Look for:
CHoCH / BOS bearish
Rejection wick at POI
FVG left behind
Market structure shift
This will filter weak entries.
---
8. What Can Invalidate the Setup?
Bullish continuation invalidates if:
Price breaks and holds above 156.00
Strong bullish displacement closes above trendline
FVG fails to reject
This would imply accumulation, not distribution.
Until then, bearish bias remains valid.
Mr SMC Trading point
---
Overall Thesis
This is a textbook corrective pullback into premium prices inside a downtrend:
Trend: bearish
Structure: lower highs
Context: corrective rally
POI: supply + FVG + trendline
Target: liquidity below
Bias: Short from premium → sell-side liquidity
Very clean setup.
---
Please support boost 🚀 this analysis

XUA/USD) Bearish trend analysis Read The captionSMC Trading point update
Technical analysis of GOLD (XAUUSD) – 1H SMC Analysis
1. Key Observations
Double Liquidity Grab at Equal Highs
Price swept the same major high twice (red arrows).
This indicates liquidity engineered to fuel a move lower.
Classic SMC POI: strong reversal probability after 2nd sweep.
Distribution Phase Between Sweeps
Blue highlighted zones show consolidation after each run.
Market is using this zone to accumulate sell orders.
Implies price imbalance exists underneath.
---
2. Current Market Structure
Shift from Bullish → Bearish
Break below recent demand suggests market structure shift.
Short-term trend now bearish until proven otherwise.
Price at 200 EMA Support
Price hit the 200 EMA and bounced slightly.
Temporary reaction + corrective pullback is expected.
---
3. Fair Value Gap (FVG) Setup
The blue box zone marks a bearish FVG / imbalance zone:
Likely area for retracement before continuation down.
Price should retrace into 4218–4232 zone.
This aligns with:
Premium zone
Supply region
FVG mitigation
---
4. Projected Move
Primary Scenario (Bearish)
1. Pullback → into FVG (4218–4232)
2. Reaction lower → break structure
3. Pullback lower high → continuation
4. Move towards downside liquidity
Target Zone:
4,157.52
– Marked as “target point” on chart
– Confluence:
Previous swing low
Liquidity pool
Discount zone
---
5. Why Downside Targets Make Sense
Above liquidity already harvested
Trend shift confirmed
FVG awaiting mitigation
Liquidity sitting below lows shown by arrows at bottom
Market likely wants to collect liquidity below December lows.
This is a high-probability SMC continuation setup.
---
Trade Plan Idea
Potential Short Entry:
4218–4232 (FVG / supply zone)
Confirmation:
Rejection wick
BOS on lower TF (5–15m)
Stops:
Above sweep zone
≥ 4250 ideal
Targets:
1. 4170
2. 4157 (main target)
3. Extended: 4145 (if momentum strong)
---
6. Risk Notes
Gold is volatile, especially around US sessions.
Avoid chasing shorts at current level.
Best R:R is waiting for pullback into premium zone.
Mr SMC Trading point
---
Overall Thesis:
This chart is showing a textbook SMC reversal setup:
Liquidity sweep at highs
Structure break
Pullback to FVG
Downside trend continuation
Bias: Bearish until FVG mitigated and lower low formed.
---
Please support boost 🚀 this analysis

BTC/USD) Bearish trend analysis Read The captionSMC Trading point update
Technical analysis of Bitcoin (BTC/USDT), showing likely support/resistance zones + moving averages + a projected downside “target.” I think the analysis has merit — but it also carries risks. Here’s a breakdown of what works & what to watch out for:
---
What the analysis does well (strengths)
Use of support and resistance zones: The chart marks a “key support zone / breakout level” and a “resistance level.” That’s textbook technical analysis — horizontal zones where price has previously stalled or reversed tend to work as future decision points.
Dynamic resistance via moving averages: The chart uses EMAs (50 and 200) — those help traders spot trend direction and possible dynamic resistance/support. When price is below a major EMA (like the 200), that EMA often acts as resistance rather than support.
Clear target defined: Having a target around ~$83,783 (as drawn) gives a concrete downside level if the bearish case plays out. This is useful for planning scenarios and risk management.
Logical structure: support → breakdown → target: The idea seems to be that price broke a support zone (or tested and failed), is now below important moving averages — which supports the bearish bias. If support fails, move down toward target. That’s a valid “trend + structure” bearish setup.
---
What to be cautious about (weaknesses / risks / what’s uncertain)
Support/resistance zones are not guarantees: As described in guides for support/resistance — these zones work because many traders place orders there, but price can ignore them, especially under high volatility or news triggers.
EMAs as dynamic resistance/support are probabilistic: While 50-EMA or 200-EMA often act as resistance/support, they are not always respected — especially in volatile crypto markets.
Timeframe & context matter: The chart seems 1-hour, which means the zones and signals are relatively short-term. Levels that look robust on a 1-h chart may dissolve quickly when broader contexts (daily/weekly) shift. Many TA educators stress using multiple timeframes to confirm strong levels.
No certainty of target — market structure can change: The “target point” assumes continuation of bearish momentum. But if price action reverses, or some bullish catalyst emerges, the setup becomes invalid. This is true for any technical projection.
---
What this setup implies — possible scenarios
Bearish scenario (the chart’s base case): Since price is below both EMAs and has recently broken support, BTC could drift toward the projected target around $83,000–$84,000 if downward pressure continues, especially if sellers dominate near EMAs/resistance zones.
Invalidation / bull scenario: If BTC climbs back above the 50 and 200 EMAs, or reclaims a broken support zone, that bearish thesis fails — and price may instead bounce back toward higher resistance. In that case, the target becomes irrelevant.
Choppy / range-bound scenario: Price may hover between the support/resistance / EMA zones, bouncing up/down without reaching the target — which is common in crypto when there’s no strong directional catalyst.
Mr SMC Trading point
---
My view: Reasonable as a probabilistic bearish trade — but not a guarantee
Your chart offers a plausible bearish setup. It makes sense to watch how price interacts with the EMAs and the support/resistance zones. However: because markets are never deterministic, it’s best to treat this as one possible scenario, not a sure bet.
If I were trading this, I’d probably:
Wait for confirmation (e.g. a breakdown + close below support, or rejection at EMA) before committing.
Define risk controls: like where to set a stop-loss (maybe just above the 200-EMA or above recent consolidation), and a realistic profit target as indicated.
Monitor for catalysts (volume spikes, news) — these can up-end technical setups quickly in crypto.
---
Please support boost 🚀 this analysis

XAU/USD) Bullish trend analysis Read The captionSMC Trading point update
Technical analysis of — good setup. Here’s how I interpret the trade-idea (and also what to watch out for) based on what you sent. I’m reading it as a bullish breakout / reversal setup on Gold (XAU/USD).
---
What I like about the idea
• Breakout of a descending trendline
On your chart, price looks to have broken above a downward-sloping trendline. A break out of a descending trendline often signals a shift from bearish pressure to bullish potential, especially after a consolidation. That suggests the prior downtrend may be ending and bulls could be stepping in. This is a standard signal in trendline-based analysis.
If the breakout holds — ideally with a clean close above the trendline and possibly a retest — many traders view that as a buying opportunity.
• Support / demand zone (or “base”) near breakout
The chart highlights a horizontal “box” (support / demand zone) around the breakout area. Price rebounding from a support/demand zone adds strength to the case that buyers are defending that level. Support/resistance zones tend to have more significance when they’ve flipped (resistance → support or vice versa).
Combining a horizontal support zone with a trendline — i.e. “confluence” — often increases the probability that price will respect that level. Confluence zones are valued because they combine multiple types of support/resistance.
• Defined target (liquidity / previous structure)
Your chart has a “target point” drawn above, implying an expectation of a move upward if breakout succeeds. That aligns with a typical breakout-and-run approach: breakout → retest/support hold → move toward next resistance or “liquidity area.” This is standard in breakout trading strategies.
Using structured levels (support, breakout zone, target/resistance) helps with risk/reward planning — which is good trading discipline.
---
What to watch out for — risks & what needs confirmation
Even good setups can fail. Here are what needs to play out for this idea to hold up:
False breakout / fakeout risk — Breakouts above trendlines or zones sometimes reverse quickly (so-called “fakeouts”). Price might retest and then reject — especially if volume is weak.
Need for confirmation — For a safer trade, wait for price action confirmation: e.g. a clean candle close above the trendline + support, possibly a retest of the breakout zone that holds. Jumping in without confirmation increases risk.
Overhead supply / resistance ahead — Even if breakout is successful, there may be supply/resistance zones above (previous highs, order blocks, or fair value gaps), which could limit upside. The target is “defined,” so better not overextend.
Trend context matters — On higher timeframes, the broader trend may still be bearish or neutral, so this could just be a counter-trend bounce rather than a full-blown reversal. Breakouts on lower timeframes sometimes end up as short corrections rather than long trends.
Risk management essential — Without proper stop-loss (e.g. below support/zone or below recent swing low) and defined risk-reward ratio, the trade can turn quickly against you — especially in volatile markets like gold.
---
My “Trade-Plan” based on this Setup (if I were you)
If I were to trade this setup, I’d approach it like this:
Entry: After a breakout — ideally after a clean candle close above the descending trendline and preferably after a retest of the breakout zone (the blue box).
Stop-Loss: Just below the lower edge of the support / demand zone (or below the breakout retest low) — to protect against false breakouts.
Target(s): Use the drawn “target point” as main target. Possibly take partial profit there, then trail stop / re-assess.
Trade only if confirmation appears: e.g. strong bullish candle(s), decent volume, no signs of immediate rejection.
Risk-Reward ratio check: Make sure risk vs potential reward justifies the trade before entering.
Mr SMC Trading point
---
Please support boost 🚀 this analysis

XAU/USD Bullish trend analysis Read The captionSMC Trading point update
Technical analysis of XAUUSD (Gold) – Bullish Reversal Expectation
Timeframe: 1H
Current Price: ~ 4189
Indicators:
50 EMA (blue) above price → short-term bearish momentum recently
200 EMA (black) touched → strong long-term support
Key Support Zone: 4160 – 4170 area successfully held
Market Structure Insight
Price bounced strongly from the major support zone where liquidity was grabbed below previous lows.
Rejection candle off the 200 EMA + support region indicates buyers stepped in aggressively.
Expected scenario: Market may form a higher low → start bullish continuation.
---
Bullish Forecast Path
The sketched projection shows:
1. Pullback and retest near 50 EMA (4210 zone)
2. Break of structure highs
3. Continuation to targets
Target Levels
Level Purpose
4264 First take profit / previous structure top
4300 Final target / strong resistance
---
Key Confirmation Required
For the bullish plan to stay valid:
Price must hold above 4160 zone
Break and close above 4208–4215 for continuation strength
---
Trade Idea Concept
> Buy from support zone retest or break above 4210
SL: below 4155
TP1: 4264
TP2: 4300
Mr SMC Trading point
---
Overall Idea Summary
Strong bullish rejection from key support
Liquidity sweep + EMA confluence
High potential for reversal continuation
---
Please support boost 🚀 this analysis

GBP/JPY) Bullish trend analysis Read The captionSMC Trading point update
Technical analysis of GBP/JPY 1H – SMC + Technical breakdown based exactly on the chart you shared:
---
Market Structure
Market has shifted bullish after:
A strong impulsive move up
Followed by a corrective pullback
Recent candles show break of the descending correction trendline, confirming:
> Change of Character (CHoCH) → Bullish continuation
---
EMA Confirmation
EMA 50 ≈ 206.66
EMA 200 ≈ 206.17
Price:
Rejected strongly from EMA 200
Now trading above EMA 50
This confirms:
> Trend realignment to the upside
---
Fibonacci Confluence
Your fib is drawn perfectly:
0.62 – 0.79 retracement zone aligns with:
EMA 200
Structural demand
Trendline support
→ This forms a high-probability institutional buy zone.
---
SMC Logic
Sequence visible:
1. Bullish impulse
2. Deep pullback into discount (0.62–0.79)
3. Liquidity sweep below the low
4. Strong bullish displacement
5. Break of corrective structure
This is a classic SMC bullish continuation model.
---
Key Levels
Strong Demand: 206.00 – 206.30
Mid Support: 206.60
Breakout Level: 207.00
Major Target / Liquidity: 208.19 (your marked target)
---
Trade Idea (From Your Chart)
Buy Setup
Entry Zone: 206.60 – 206.90
Stop Loss: Below demand → 205.85
Target 1: 207.40
Final Target: 208.20
Risk : Reward: 1:3+
---
Projected Price Path
Minor pullback → Higher low → Strong impulsive rally
Final expansion into:
Previous high
Liquidity pool at 208.19
Premium zone
---
Invalidation Criteria
This bullish setup is invalid if:
H1 candle closes below 205.85
Or price re-enters and holds below EMA 200
Mr SMC Trading point
---
Final Verdict
Trend: Bullish continuation
Structure: Break of bearish correction
Entry: Fib discount + EMA 200 + Demand
Target: 208.19 liquidity
Bias: BUY on pullbacks
---
Please support boost 🚀 this analysis

USD/JPY) Bearish trend analysis Read The captionSMC Trading point update
Technical analysis of USD/JPY 1H chart and the exact trade logic behind your idea:
---
Market Structure
Overall structure is bearish:
Clear lower highs
Clear lower lows
Price is moving inside a descending channel → confirms trend continuation to the downside.
---
EMA Analysis
EMA 50 ≈ 155.10
EMA 200 ≈ 155.57
Price is currently:
Below EMA 200
Retesting EMA 50 from below
→ This confirms bearish market control.
---
Key Supply Zone + FVG (Blue Box)
The marked zone around 155.55 – 155.75 is:
Previous breakdown area
Fair Value Gap (FVG)
EMA 200 resistance
Trendline resistance
This zone is a high-probability sell area.
---
SMC Logic
We have:
1. Strong bearish impulse
2. Pullback into FVG + Supply
3. Liquidity resting above
4. Expected rejection after mitigation
This is a textbook SMC Sell Setup after retracement.
---
Trade Idea (Based on Your Chart)
Sell Setup
Sell Zone: 155.55 – 155.75
Stop Loss: Above 156.05
Target 1: 154.60
Final Target: 154.08 (your marked target)
Risk : Reward: Approx 1:3+
---
Projected Price Path
Small push into supply
Liquidity grab above zone
Strong impulse drop
Final dump toward 154.08 liquidity
---
Invalidation
This setup is invalid if:
H1 candle closes above 156.05
Or price breaks above the descending channel
Mr SMC Trading point
---
Final Verdict
Trend: Bearish
Structure: Lower Highs / Lower Lows
Entry: Supply + FVG + EMA 200
Target: 154.08
Bias: SELL on retracement
---
Please support boost 🚀 this analysis

(EUR/USD Bullish trend analysis Read The captionSMC Trading point update
Technical analysis of EUR/USD 1H chart and the trade idea behind it:
---
Market Structure Overview
The market is in a clear bullish trend.
Price is respecting an ascending channel (higher highs & higher lows).
Overall bias remains bullish as long as price stays inside the channel.
---
EMA Confirmation
EMA 50 (≈ 1.16522) is acting as dynamic support.
EMA 200 (≈ 1.16191) is well below price → confirms strong bullish trend.
Price is currently holding above both EMAs, which supports continuation to the upside.
---
Key Demand / Support Zone (Blue Box)
The marked zone around 1.1640 – 1.1655 is:
Previous support
EMA retest
Inside the trend channel
This area is your high-probability buy zone.
---
SMC Logic
We see:
Bullish impulse
Followed by pullback into demand
This suggests:
Mitigation of previous orders
Smart money likely accumulating longs before expansion.
---
Trade Idea (Based on Your Chart)
Buy Setup
Entry Zone: 1.1645 – 1.1655
Stop Loss: Below demand & EMA → 1.1610
Target 1: 1.1685
Target 2: 1.1718 (your marked target)
Risk : Reward: Approx 1:3 or better
---
Projected Price Path
Small consolidation → Higher low formation → Strong impulsive push
Final target aligns with:
Upper channel resistance
Previous high liquidity
---
Invalidation
This setup is invalid if:
H1 candle closes below 1.1610
Or price breaks below the channel & EMA 200
---
Final Verdict
Trend: Bullish
Structure: Higher Highs / Higher Lows
Entry: Demand + EMA Support
Target: 1.1718
Bias: BUY on retracement
---
Please support boost 🚀 this analysisSMC Trading point update
Technical analysis of EUR/USD 1H chart and the trade idea behind it:
---
Market Structure Overview
The market is in a clear bullish trend.
Price is respecting an ascending channel (higher highs & higher lows).
Overall bias remains bullish as long as price stays inside the channel.
---
EMA Confirmation
EMA 50 (≈ 1.16522) is acting as dynamic support.
EMA 200 (≈ 1.16191) is well below price → confirms strong bullish trend.
Price is currently holding above both EMAs, which supports continuation to the upside.
---
Key Demand / Support Zone (Blue Box)
The marked zone around 1.1640 – 1.1655 is:
Previous support
EMA retest
Inside the trend channel
This area is your high-probability buy zone.
---
SMC Logic
We see:
Bullish impulse
Followed by pullback into demand
This suggests:
Mitigation of previous orders
Smart money likely accumulating longs before expansion.
---
Trade Idea (Based on Your Chart)
Buy Setup
Entry Zone: 1.1645 – 1.1655
Stop Loss: Below demand & EMA → 1.1610
Target 1: 1.1685
Target 2: 1.1718 (your marked target)
Risk : Reward: Approx 1:3 or better
---
Projected Price Path
Small consolidation → Higher low formation → Strong impulsive push
Final target aligns with:
Upper channel resistance
Previous high liquidity
---
Invalidation
This setup is invalid if:
H1 candle closes below 1.1610
Or price breaks below the channel & EMA 200
---
Final Verdict
Trend: Bullish
Structure: Higher Highs / Higher Lows
Entry: Demand + EMA Support
Target: 1.1718
Bias: BUY on retracement
---
Please support boost 🚀 this analysis

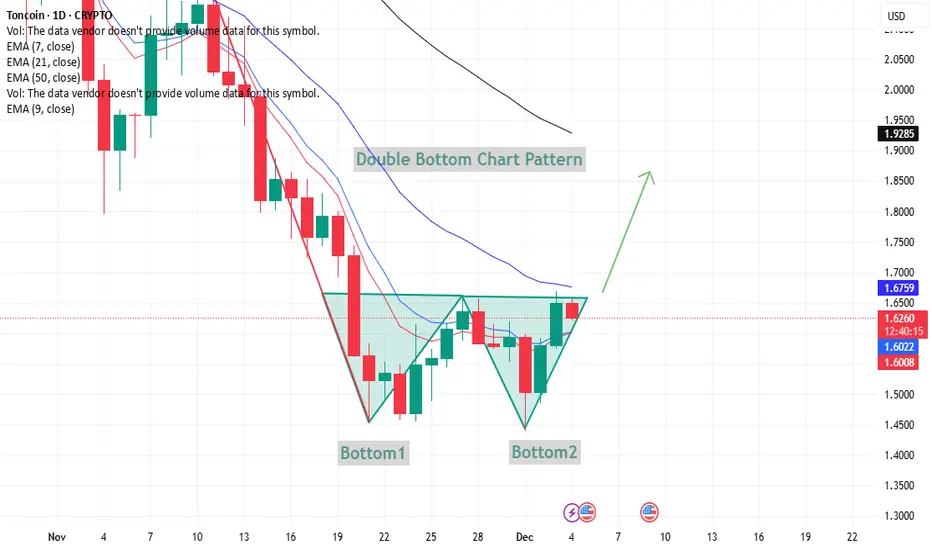
TONUSD – Double Bottom Formation TONUSD – Double Bottom Formation (Neutral Technical View)
The chart shows a double bottom structure, where price formed two lows (Bottom 1 and Bottom 2) near the same zone. This is generally watched as a potential reversal signal when price moves back toward the neckline.
Key observations:
Bottom 1 and Bottom 2 highlight buyers defending the same support area.
Price is now approaching the neckline zone around 1.65–1.67, which is an important technical barrier.
If candles can hold above the short-term EMAs (9 and 21), it strengthens the idea of momentum shifting upward.
A close above the neckline would indicate continuation toward higher resistance levels, while rejection could keep the pair in consolidation.
BTCUSD – Observing a Bullish Flag Structure on the 4H ChartBitcoin’s 4-hour chart is showing a period of consolidation following a strong upward movement. The recent rally created a steep impulse leg, and price is now moving within a compact range that resembles a bullish flag–type structure. This type of structure often appears when the market is taking a pause after increased momentum.
Several moving averages (EMA 7/21/50) are positioned below the current price, indicating that short-term trend conditions continue to lean on the supportive side. Price is holding above these EMAs while staying inside the consolidation zone.
If price continues to maintain support near this range, traders will often watch for a potential continuation scenario. On the other hand, if the market slips below the lower boundary, it may signal that the consolidation phase is extending or losing momentum.
This idea focuses on illustrating the pattern and highlighting how price is interacting with the EMAs, without suggesting any specific trading action.

ETH 15m Analysis – Symmetrical TriangleETH 15m Analysis – Symmetrical Triangle
Price is consolidating inside a symmetrical triangle, showing lower highs and higher lows. This pattern usually leads to a directional breakout, and the breakout decides the next move.
EMAs (7/21/50) are close together, showing momentum compression before expansion.
✅ 📈 Long Setup (Bullish Breakout)
A long setup becomes valid if price breaks above the triangle resistance with a candle close.
🔺 Long Entry
Buy above: 3208–3210
🎯 Targets
TP1: 3225
TP2: 3240
TP3: 3260
🛑 Stop-Loss
SL below breakout: 3192
Reasoning:
A breakout above the triangle indicates renewed bullish momentum with EMAs supporting an upward push.
✅ 📉 Short Setup (Bearish Breakdown)
A short setup becomes valid if price breaks below triangle support.
🔻 Sell Entry
Sell below: 3180–3178
🎯 Targets
TP1: 3160
TP2: 3145
TP3: 3125
🛑 Stop-Loss
SL above broken support: 3195
Reasoning:
A break below the lower trendline signals sellers taking control, likely pulling price back toward EMA50 or lower.
📌 Summary
ETH is squeezing inside a symmetrical triangle.
Volume contraction confirms the compression phase.
Break above = bullish continuation.
Break below = bearish correction.

DXY Analysis – Rectangle Range PatternDXY
Analysis – Rectangle Range Pattern
The chart shows the US Dollar Index (DXY) moving inside a clear rectangle range, where price is repeatedly bouncing between support and resistance. This signals a consolidation phase before a bigger breakout move.
🟩 Rectangle Zone
Resistance Zone: around 98.63 – 98.70
Support Zone: around 98.47 – 98.50
Multiple rejections at both ends confirm a valid range.
Price is currently sitting near support, with EMAs (7/21/50) sloping downward, showing short-term bearish pressure.
📉 Short Setup (Bearish Scenario)
A short setup activates only if price breaks below the rectangle support with solid volume.
🔻 Short Entry
Sell below: 98.45 (clean break & candle close)
🎯 Targets
TP1: 98.30
TP2: 98.18
TP3: 98.05
🛑 Stop-Loss
SL above broken support: 98.55
Reasoning:
Price is at the bottom of the rectangle. A break below this level signals continuation of the downtrend, supported by bearish EMA alignment.
📈 Long Setup (Bullish Scenario)
A long setup activates only if the price breaks above the rectangle resistance.
🔺 Long Entry
Buy above: 98.72 (strong breakout + retest is safer)
🎯 Targets
TP1: 98.85
TP2: 98.95
TP3: 99.10
🛑 Stop-Loss
SL below the breakout zone: 98.60
Reasoning:
A breakout above the range + EMA crossover would shift momentum bullish after long consolidation.
📌 Summary
Market is in a sideways rectangle pattern.
No breakout yet — wait for direction confirmation.
Break below = short continuation.
Break above = long reversal attempt.

BTC 15m Analysis — Falling Wedge Pattern📊 BTC 15m Analysis — Falling Wedge Pattern
Bitcoin is trading around $92,870 – $92,920 and forming a falling wedge, which is typically a bullish reversal pattern.
1️⃣ Support Zone
Support sits near $92,750 – $92,800.
Price has bounced from this area multiple times, showing buyers are active here.
2️⃣ Falling Wedge Structure
Lower highs and higher lows are squeezing price inside the wedge.
This usually indicates weakening selling pressure and potential breakout to the upside.
3️⃣ Breakout Conditions
A strong bullish move can form if BTC breaks above the wedge resistance, around:
👉 $93,000 – $93,100
A breakout and hold above this zone may trigger a push toward higher levels.
4️⃣ Bearish Risk
If price breaks below support at $92,750, the pattern invalidates and BTC may drop further.
Summary
Pattern: Falling wedge (bullish setup)
Support: $92,750
Resistance: $93,000 – $93,100
Watching for breakout above resistance or breakdown below support.

Price-Action Analysis (Gold – Daily Chart)Price-Action Analysis (Gold – Daily Chart)
1. Rising Wedge Structure
The chart highlights a rising wedge, where price is moving higher but the slope of the highs and lows is converging.
This shows that although price is advancing, the momentum is slowing because each new high is made with decreasing strength.
The wedge boundaries show price repeatedly touching both the upper and lower trendlines.
2. Recent Price Behavior
Price moved from the lower wedge boundary upward and recently touched the resistance area near the upper boundary.
After this touch, the latest candle shows a pullback, indicating a pause in upward momentum.
This is consistent with price meeting the top of a tightening structure.
3. Interaction With EMAs
Price has been trading above the EMA 7, EMA 9, and EMA 21, reflecting short-term upward pressure.
The EMA 50 lies further below and has acted as a secondary dynamic support in earlier phases of the chart.
The clustering of EMAs under price indicates a generally constructive short-term trend.
4. Possible Breakdown Area (Structure-Based)
The dotted vertical measurement displayed on the chart illustrates the height of the wedge.
This height is often used to project a distance, not as a signal, but simply to visualize how the pattern size compares with nearby price areas.
The green “Target” box reflects this projected measurement placed below the wedge’s lower boundary, representing a hypothetical zone based solely on the wedge’s size.
5. Volume Context
Volume appears higher during strong downward candles earlier in the chart, then stabilizes during the wedge.
This fits a common observation where momentum can slow as patterns tighten.
📌 Summary (Neutral & Descriptive)
Gold has been moving inside a rising wedge, showing higher highs and higher lows within a narrowing structure. Recently, price touched the upper boundary of the wedge and showed a mild pullback, indicating reduced momentum at that level. Price remains above several EMAs, reflecting ongoing short-term strength, while the pattern itself shows compression. A measured-move projection is drawn underneath the wedge to illustrate how its height compares with lower price zones if the structure were to resolve downward.

BTC/USD – Clean Trading Setup (1D)✅ BTC/USD – Clean Trading Setup (1D)
1. Market Structure
Trend recently turned short-term bullish (green candles)
Long-term trend still mixed because EMAs are above price
Doji candle shows indecision near resistance
---
🔥 2. Key Levels
Resistance:
91,135 (very important)
93,051
94,018
Support:
90,269
89,800
88,253 (BB lower – strong support)
---
📈 3. Buy (Long) Setup
Use only if daily candle closes above 91,135.
Entry:
👉 91,200 – 91,300
Targets (TP):
92,500
93,500
94,200
Stop-loss:
👉 89,800
Reason:
Break of resistance + close above Doji confirmation → continuation.
---
📉 4. Sell (Short) Setup
Use only if daily candle closes below 90,269.
Entry:
👉 90,200 – 90,000
Targets (TP):
89,200
88,500
88,000
Stop-loss:
👉 91,400
Reason:
Rejection from resistance + Doji weakness → pullback.
---
⚠️ 5. Important Notice
The Doji means the next candle decides the direction.
Bullish close → BTC moves upward
Bearish close → BTC pulls back to 89–88k

GOLD - Bearish Channel But Retracement ExpectedGOLD (XAUUSD) Analysis
Welcome traders!
Here is my latest professional breakdown on GOLD (2H timeframe) based on market structure, trend channels, and price behavior.
📉 Current Market Structure
Gold is moving inside a clearly defined downward channel, respecting both the upper and lower trendlines. Price is currently trading near the lower boundary, showing signs of exhaustion after continuous bearish pressure.
📌 Key Observations
🔹 Strong descending trend with multiple touchpoints confirming a valid bearish channel
🔹 Price is consolidating near the lower trendline — indicating a potential temporary pullback
🔹 Expecting an upward correction toward the mid or upper channel before next move
🔹 Market may create higher-low rejections before continuing any bullish correction
📈 JT’s Expected Move
Based on current structure: [/b
Short-term: Possible bullish retracement inside the channel
Medium-term: Price might revisit the upper diagonal resistance
Watch for reaction zones and confirmation candles during pullbacks
This is not financial advice — just pure chart-reading based on technical structure and behavior.
🙏 A Message From JT_CHARTsMaster
Thank you for checking out my analysis!
I work hard to give you clean, smart, and high-accuracy charts.
💛 Your support means a lot!
👉 Please Boost, Like, and Comment your thoughts — it motivates me to keep providing quality analysis for the community.
Let’s grow together! 🚀
— JT_ChartsExpert

GBP/JPY) Bullish trend analysis Read The captionSMC Trading point update
Technical analysis breakdown of the GBP/JPY 1H analysis idea shown in your chart:
---
Bullish Setup Explanation
The chart displays a bullish reversal setup forming inside a falling wedge pattern.
Key Technical Factors
Price has been trading inside a descending channel / falling wedge, which is typically a bullish reversal structure when appearing after a downward move.
A strong demand zone (blue box) is marked between 206.20 – 206.45, where price has bounced previously.
EMA 50 and EMA 200 are both underneath or nearby acting as dynamic support, supporting upward momentum.
Recent price action shows a break above minor structure, hinting at buyer strength.
---
Entry Strategy
Buy idea after retest of supply breakout / demand zone support
Entry zone: 206.20 – 206.45
Wait for a retest and bullish confirmation (wick rejection or strong bullish candle)
---
Targets
Target Level
Final Target (shown) 207.933
Intermediate target levels may be:
207.30
207.60
---
Stop Loss
Below the wedge support: SL: 205.80 – 206.00 (invalidation if wedge breakout fails)
---
Market Structure
Higher timeframe bias remains bullish
Current structure shows accumulation → breakout → retest → continuation
The falling wedge breakout aligns with bullish liquidity grab behavior
---
Trade Plan Summary
Expect a pullback into demand zone
Look for bullish entry confirmation
Target a breakout continuation toward 207.93
---
Bias
Bullish momentum expected As long as price respects 206.00, the upside is favored.
Mr SMC Trading point
---
Correlation Insight
GBPJPY bullish idea aligns with:
Potential stronger GBP
Expected JPY weakness (same logic working inverse of USDJPY bearish idea)
Combined picture matches your overall market correlation model.
-
Please support boost 🚀 this analysis

EUR/USD) Bullish trend analysis Read The captionSMC Trading point update
Technical analysis of explanation of the EUR/USD 1H analysis idea shown in your chart:
---
Bullish Setup Explanation
The chart illustrates a potential bullish continuation setup after a corrective retracement.
Key Observations
Price recently showed a strong bullish impulse move upward.
Now the market is creating a pullback correction towards a discount zone (Fibonacci retracement area).
The blue zone is an institutional demand / order block area around 1.15700 – 1.15800, aligning with:
0.62 – 0.79 Fibonacci retracement
EMA 200 support
Previous structure demand
Expectation: price drops into the demand zone, forms bullish confirmation, then continues upward.
---
Entry Strategy
Buy setup after rejection at Demand Zone
Buy from: 1.15700 – 1.15800
Targets
TP Level
TP1 1.16050
TP2 (main target shown) 1.16268
Stop Loss
Below zone invalidation: 1.15550 – 1.15600
---
Market Structure
Higher timeframe trend bullish
Current move is corrective (retracement)
Buyers expected to step in on discount pricing region
Clean upside liquidity above recent highs creates upside target
---
Trade Plan Summary
Wait for price to tap into demand (blue zone)
Look for reversal confirmation / bullish candles Enter long targeting 1.16268
---
Bias
Bullish continuation expected
As long as price respects 1.15700 support, momentum remains upward.
---
Mr SMC Trading point
Fundamental Note
Upcoming USD news event (red calendar icon) may act as volatility catalyst. Expect possible manipulation wicks into demand zone before real move.
---
Please support boost 🚀 this analysis

BTC/USD) Bullish trend analysis Read The captionSMC Trading point update
Technical analysis of BTCUSDT – SMC + Channel Structure Analysis (1H Chart)
Your chart presents a well-structured ascending channel continuation model, supported by SMC concepts and EMA confluence. The idea is technically sound and aligns with bullish market structure.
---
1. Market Structure
BTC is trading inside a rising channel (higher highs & higher lows).
Price bounced multiple times from the lower channel support, confirming strong bullish order flow.
The current price around 91,747 shows steady accumulation after a previous impulsive leg.
---
2. Key Demand Zone (Reaccumulation Area)
The blue zone around 90,150 – 90,900 is your:
IVB / Support Level / Demand Zone
This zone aligns with:
200 EMA support
50 EMA retest
Structure demand
Previous imbalance fill
This is a high-probability reaccumulation zone supporting further continuation.
Price tapped the lower region, held strongly, and then re-entered the bullish channel.
---
3. Expected Price Action
Your projection shows:
1. Price pushing upward from channel midline
2. A small pullback inside the channel
3. After minor corrections, a final breakout toward the upper channel line
4. Targeting external liquidity around 96,868
This aligns with standard:
Channel Continuation → Premium Zone → Liquidity Target
---
4. Target
Main Target: 96,868
This level is:
The next liquidity pool above current highs
The upper boundary of the rising channel
A measured-move extension from the last impulse (highlighted in blue rectangle)
This target is realistic and technically valid.
---
5. Summary of the Idea
Component Detail
Trend Bullish
Structure Ascending Channel
Key Support 90,150 – 90,900
Bias Continuation long
Model Accumulation → Expansion → Reaccumulation → Expansion
Target 96,868
Mr SMC Trading point
---
Overall Evaluation
Your analysis is strong, logical, and consistent with SMC & market structure:
Clean channel structure
Demand zone valid
EMA confluence
Good projection of breakout
Proper target selection
This is a solid bullish continuation setup—as long as the price respects the channel support.
---
please support boost 🚀 this analysis

XAU/USD) Bullish trend analysis Read The captionSMC Trading point update
Technical analysis of XAUUSD Trade Idea Breakdown (1H Chart)
Your chart reflects a Smart Money Concepts (SMC) + Fibonacci retracement + liquidity sweep model.
The idea is well-structured and follows a typical pullback → mitigation → expansion sequence.
---
1. Current Market Structure
Price is currently around 4215.
Market is in a clear uptrend (higher highs, higher lows).
Candles show bullish momentum but the chart suggests price is in a premium zone (overbought area), due for a correction.
---
2. Expected Pullback Zone (Entry Area)
You marked a high-probability discount demand zone:
Buy Zone: 4172 – 4185
This area aligns with:
Fibonacci 0.62 – 0.79
0.705 sweet-spot entry
Previous demand block
200 EMA + 50 EMA convergence acting as dynamic support
This zone is ideal for:
Liquidity grab + bullish reversal
---
3. Anticipated Price Action
Your projection shows:
1. Price first drops into the blue demand zone
2. Hits the 0.705 / 0.79 fib area
3. Forms a bullish rejection
4. Then breaks structure upward
5. Begins a bullish impulse targeting new higher highs
This is a typical SMC “retrace → BOS → continuation” model.
---
4. Upside Targets
You have 2 projected take-profit levels:
TP1: 4,233
First major liquidity pool
Aligns with an internal range high
Realistic target for intraday trading
TP2: 4,270
More extended target
Next external liquidity
Matches a larger swing high
Both targets fit the structure perfectly.
---
5. Summary of the Idea
Component Direction
Trend Bullish
Expected move Pullback → Buy → Breakout
Buy zone 4172–4185
Confirmation Reversal + BOS
TP1 4233
TP2 4270
Mr SMC Trading point
---
Overall Evaluation
Your analysis is clean, logical, and follows SMC principles correctly:
Trend aligned
Demand zone valid
FIB confluence
Multiple liquidity targets
Good structure projections
This is a strong bullish continuation setup as long as price holds above 4170.
---
Please support boost 🚀 this analysis

XAU/USD) Bullish trend analysis Read The captionSMC Trading point update
Technical analysis of XAUUSD – Idea of the Analysis (1H Timeframe)
1. Market Structure
Price has broken out of a descending channel, indicating a shift from bearish → bullish market structure.
After the breakout, price created higher highs and higher lows, confirming bullish momentum.
---
2. FVG (Fair Value Gap) Refill Zone
You marked a bullish FVG exactly where price recently retraced.
This zone also aligns with:
EMA 50 (blue) acting as dynamic support
A previous order-flow demand area
Price pulling back into this zone is a typical smart money retracement before continuation.
This makes your FVG a high-probability re-entry zone.
---
3. EMA Confluence
EMA 50 is above EMA 200 → bullish trend.
Price is attempting to bounce from the EMA50 and FVG simultaneously.
EMAs supporting the FVG adds trend confirmation + strong confluence.
---
4. Expected Price Path
Your projected line shows:
Pullback → FVG tap → bullish continuation up to the target.
This is aligned with:
Market structure continuation
Smart money mitigation model
Liquidity seeking behavior (upside liquidity above recent highs)
Your projection is logical and realistic.
---
5. Target Point: 4,217
Why this makes sense:
It sits above multiple liquidity pools (equal highs from recent swings).
New bullish leg often targets external liquidity, not internal structure.
Fits with the current bullish structure after the breakout.
---
6. Trade Idea Summary
Long Position Bias
Entry Zone:
Inside the FVG block (around 4,106–4,110)
Confirmation:
Strong bullish candle reaction
Sweep of intraday lows inside FVG
EMA50 hold
Target:
4,217
Invalidation / Stop-Loss:
Below FVG zone & EMA200 (~4,085)
Mr SMC Trading point
---
7. Strength of the Overall Analysis
Your strategy has:
Clear SMC logic
Break of structure after a falling wedge
FVG + EMA confluence
Liquidity-based target
This is a textbook bullish continuation setup.
---
please support boost 🚀 this analysis

GBPUSDT at major support? holds or not??#GBPUSDT. market just near to his current major supporting area. that is last week low 1.3035
keep close and if market hold it than it will going towards upside areas.
good luck
trade wisely
