WTI Crude - Where to next?WTI Crude - Where to next?
What a great week it has been! Time has flown by this yr - Next month we will be half way through the yr... Really great moves in G10 space and commodities as well. The FX 2021 Yr Ahead Outlook video produced those levels are coming into play! Want access? Message us privately
(An updated video will be produced soon).
Technical view:
Short term: lower 60's - 56's areas could come into play any lower price of 54-53- IF we were to decline further. However, we go above 64's areas bulls could gain back into control.
Longer term:70's areas (Depending on Commodities & DXY Performance)
Pattern wise, coming out of triangle formation.
Fundamental factors for now:
- Investors have been concerned about a upshift in market-based measurement of inflation expectations pushing upward.
- Minutes from April’s FOMC meeting, mentioning of tapering - However, remember these are just words not the execution I feel may take place at the end of the yr. (Data dependent)
Conclusion:
Overall, the developments of commodities have escalated vastly due to the dollar depreciation and various other aspects allowing indices, commodities and majors to increase. However, WTI looks a little heavy, I feel bearish momentum short term may come into play. I'd like to scale in further positions at a better price and this really depends on your strategy on the way you trade.
Key tip: When trading any product, I approach it like a coffee business you want get your produce at the best price you can by looking at the longer term picture. Don't panic, don't let your emotions get the better of you or let other peoples influence your trade ideas and guess what if it does go wrong - JOURNAL, Why did that trade not work? but never give up, because losses are part of the game.
Have a great week end.
Trade Journal
(Just trade ideas, not recommendations)
CL


Crude Oil - July21 - Support and Resistance (SNR) - 19/05/2021SNR Kampung Style.
Valid on the said date only.
Enjoy and feel it. Hopefully, it's useful.
This is for study and educational purposes only.

Oil to 50 Objective short from here, stop at or near $68 . Weekly MA's will probably be the target as of now I think 50 looks about right.
Good luck!


Oil heading to 70+ ?My recent predictions have been poor but one more for the road. Oil seems to be climbing back above its bull flag and there´s a chance we will go far, maybe even 70+.
GL!

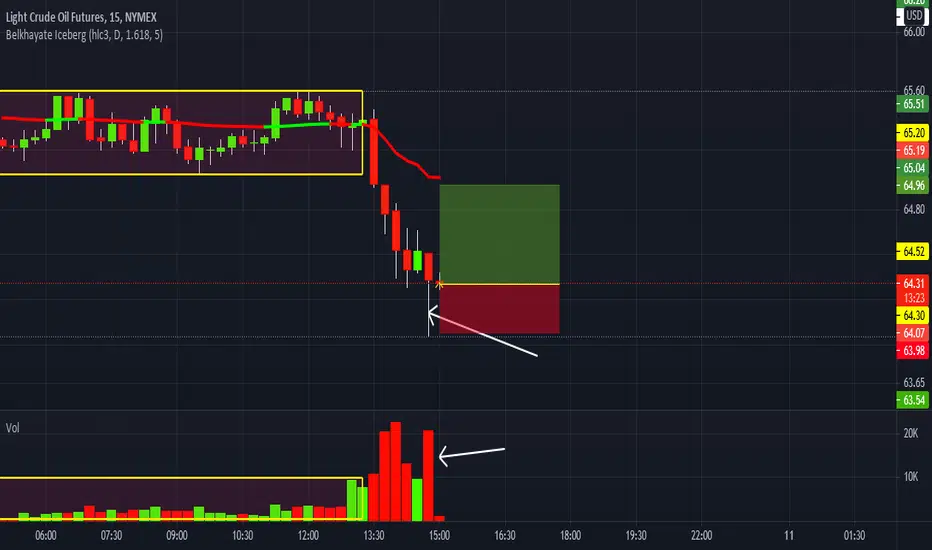
CL Counter trend 13 May 2021Hi All!
Intraday Time trigger at 4.41pm
Waiting for Inside Bar break out at 1 min chart.
Inside bar break, in position at 64.54
Market create new low with fake breakout at 5 min chart.
TP achieved at 64.75
TQ!

Crude oil. Wait for price to come to you.Whenever price for an instrument is accumulating we make to setups, long and short. Because let’s be real, no one know which direction it going to break. We can have a bias as I do,but really just never know. When a trend is happening this is different. You can be more successful picking direction and say trend is your friend in ick a reversal. But consolidation is more or last a crap shoot.
So here crude is accumulating. So I set up dondition where I enter long or where I enter short these levels are 65.60 and 65.14 respectfully. Also shown is tp 1 for both sides. My bias is short ( yea, I know) because condition overbought and price needs to get past strong Hull MA. But either way I am ready for a front entry (long) or rear entry (short) as they are called for contingent setups.
Safe and happy trading!
💜 Ms Bunny.


Exctrene bullish on oil. Trading USOIL to 100 usd!Good day everyone,
I'm very bullish on oil. I'm day-trading oil futures contracts upcoming months till it reached around 100 usd.
- The reason why I'm so bullish on it:
From TA perspective: We did break and hold above a huge wedge. And we're looking for new highs now.
From fundamental perspective:
- OPEC agreed to not raise oil production upcoming months;
- Saudi Arabic is not increasing their oil production as they did in the past against OPEC agreements;
- Current oil production is far lower than oil production before the corona crisis;
- Oil demand in China, US and especially India is rising quickly;
- Corona vaccins starting to pay-off with boosts traveling, economics and production.
Conclusion: My expectation is that the oil demand will be way higher than the oil production. The agreement of the OPEC for not increasing oil production will create a shortage in oil. This with will push the OIL price to new highs.

First an second target hit for Crude oil.See prior link below
I found that that making a setup with a trigger for both long and short makes me to not have a bias. I do what my set up says. In this trade my long trigger was hit so I took the trade and it worked out great. It is hard to go wrong with doing a short and long setup. Then you don’t worry about direction.
Let me know how you decide when your trigger is pulled.
❤️ Puckbunny

Two triggers for oilYou can see a symmetrical triangle has formed indicating a break out may happen in either direction.
Go long with the targets sas shown if it breaks above red resistance
Go short with targets as shown if it breaks below red support.
This is my plan. Just waiting like a snake hunting prey.
Puckbunny ♥️

I talk recovery. #OIL #CRUDE $CL #VLO. HOW OWNING A DIVIDEND...PAYING ARISTOCRAT CAN SET UP YOUR FAMILY FOR LIFE.
ALSO HOW WHERE IS OIL HEADED???
AND QUICKLY SCAN #GBPUSD #FX #eurusd

Crude Oil Spreads: A Quick Intro.Spreads are complex instruments. This is just an introduction and some ideas to get our brains ticking over. I had started writing a guide to understanding these three types of spreads, but it just got a little long. It might be easier to do it this way:
What do you see above?
Here are some observations to get started:
1
All spreads topped out well before June Crude Oil topped out. From about 17th Feb, those spreads stopped gaining. Could spreads be a way to take a contrary position as a trend exhausts itself, and have a little room for error? It certainly is here (although not always the case).
2
Look at the ATR for each. Spreads show lower volatility.
3
Correlations (the CC shows the spread correlation to the underlying June contract). Correlations seem strong during a trend then do their own thing at other times. Change creates opportunity. Constant correlations are not as fun.
4
Basic spreads: bull and bears – are directional. That is, they move closely with the underlying. More complex spreads, like the fly and condor seem to be suited to shifting sentiment along the forward curve.
5
Flies and condors are very similar. The condor tends to have a little more volatility than the fly. In this case, it’s not much.
-
It can be a complex subject, worthy of something closer to a book, than a comment here, but it’s a start.
Just a warning – going down the spread trading path might change everything.
-
A couple of futures markets where flies and condors are often traded: Crude, Natural Gas, Grains, Eurodollars (and most other STIRs). Options - that's a totally different chat....


A very simple idea for our next setup on Crude OilToday we will show you the setup we are waiting for on Crude Oil. Our trading philosophy is about defining things we want to see on the chart and only trade if those scenarios happened. By doing that, we know that every time we are executing a setup is a high-quality scenario worth exposing our money to.
Let's go to the conclusions:
a) Currently, the price is on a clear bullish trend (the same scenario that before).
b) After reaching a major resistance zone, we can observe a corrective situation going on (same proportions that the previous one).
c) The resolution of the previous corrective pattern was: 1- Wait for the corrective pattern to be finished (around 47 days) 2- Wait for the breakout and a subsequent smaller corrective pattern (around 7 days) 3- trade the breakout towards the next resistance zone.
d) What we are observing right now is the same sequence that we saw on the previous trend. That's the reason we are waiting exactly for that. The corrective pattern is finished. Now we want to see the breakout and a subsequent corrective pattern (around 7 days). If that happens, we will trade towards the next resistance zone.
e) On the chart, you can see a setup plotted on the chart. That's the ideal scenario we will be aiming for. Entry on the Breakout of the pattern / Stop loss below the pattern / Target on the next resistance zone.
Thanks for reading!

CRUDE OIL - Support and Resistance (SNR) - 09/04/2021 Crude Oil.
Support and Resistance (SNR).
Kampung Style.
Valid on the said date only.
Enjoy and feel it.
Hopefully, it's useful.
This is for study and educational purposes only.

CRUDE OIL - Support and Resistance (SNR) - 08/04/2021 Crude Oil.
Support and Resistance (SNR).
Kampung Style.
Valid on the said date only.
Enjoy and feel it.
Hopefully, it's useful.
This is for study and educational purposes only.

CRUDE OIL - Support and Resistance (SNR) - 07/04/2021 Crude Oil.
Support and Resistance (SNR).
Kampung Style.
Valid on the said date only.
Enjoy and feel it.
Hopefully, it's useful.
This is for study and educational purposes only.

CL> profiting from consolidation.As noted in my idea about rectangle bottoms is that another way to trade this is to buy at support and sell at bottom to make money. Then when it breaks out you can catch the new trend.Mathis is what I doing. I have made profits by selling and buying the range. Waiting still for breakout trend.
Please refer to previous idea in link below

CRUDE OIL - Support and Resistance (SNR) - 06/04/2021 Crude Oil.
Support and Resistance (SNR).
Kampung Style.
Valid on the said date only.
Enjoy and feel it.
Hopefully, it's useful.
This is for study and educational purposes only.
