Litecoin Hinted at Bitcoin's Move Up, More to Come?Apologies for not posting yesterday. I was trapped with work and mentally drained from all the news coverage of our Fed Chair Jerome Powell. Honestly, it was a disappointment in terms of price action. For stock market bears, today there has been a lack of follow through to the down side. Yes, that should keep you up at night if you are short this market. The gold breakout was...meh. Oh and Bitcoin did what it does best and filled its ridiculous gap early this morning. Let's get into some charts. Today I'll focus on Litecoin, Grayscale Bitcoin Trust, SPDR Gold Shares, and the United States Oil Fund.
Litecoin Warned Us and it Delivered
A few days ago I posted on how Litecoin was retesting support at 40 and may hint of a Bitcoin rally. I explained that it is informative to use other altcoin charts to gauge the future direction of Bitcoin. We reviewed Litecoin and it delivered. Bitcoin ripped from early week lows and has now filled the infamous 1200 point CME gap. Just ridiculous . However, the Litecoin price is lagging Bitcoin significantly (red flag). Below is the daily chart of Litecoin.
As you can see, Litecoin is rallying off the lows but the lack of follow through should be concerning. In the coming week or two there is also the risk of a Head and Shoulders reversal top forming. Could this reversal pattern provide us with another hint for Bitcoin?
Below is the daily chart of the Grayscale Bitcoin Trust (GBTC). Notice the lack of follow through for the bulls on the daily candle close. I view this as a sign of exhaustion which could lead to consolidation or a reversal. GBTC will be an important chart to watch in the coming weeks.
For crypto in general, there are signs that are pointing to continued consolidation, with potential of further dips to as low as 6,000. In the meantime continue to BTFD and sell into rallies. Bias: Bearish .
Follow through ASAP
Maybe I am impatient, but gold needs to follow through asap! Below is the daily view of GLD.
What we see here is potentially the next steps to a all-time high test . Momentum is beginning to build as GLD is breaking out from a month long symmetrical triangle. Don't short here, the trend has been bullish and the with the current state of the global economy there may not be a safer place to stack your cash.
With that said, there are levels of support I would like GLD to hold. See below the 4-hour chart of GLD.
A break below 161 support and there is cause for concern. In the interim my bias remains.... Bias: Bullish .
Onto Black Gold
I haven't talked about any oil stocks on this channel yet so why not begin with USO. Below is the 4-hour chart of USO.
For the last 10 days USO has been in a sideways consolidation known as a rectangle . These types of formations often take form at the beginning of major trends. Last point on rectangle consolidations, is that they rarely have false breakouts outside of the rectangle. Whichever direction USO breaks will likely define the trend. Keep an eye on this chart as it could be a big winner heading into the summer. Short term, Bias: Bullish .
Tomorrow is the weekly close. In the morning I'll be reviewing Zoom and possibly Tesla. I hope you have a great evening!
CL

WTI \ OIL \ CL still moving UP!!!The easy upside movement is coming. No sales yet. Don't get yourself into bears' trap

OIL: Too Fast and Too High ??? Selling rallies...Hi,
is it too high and too fast ?
Well maybe, Im going to check that with
selling rallies towards 27,30/50
Stop above 27,90
First target 25
Second target 22,50
Good Luck

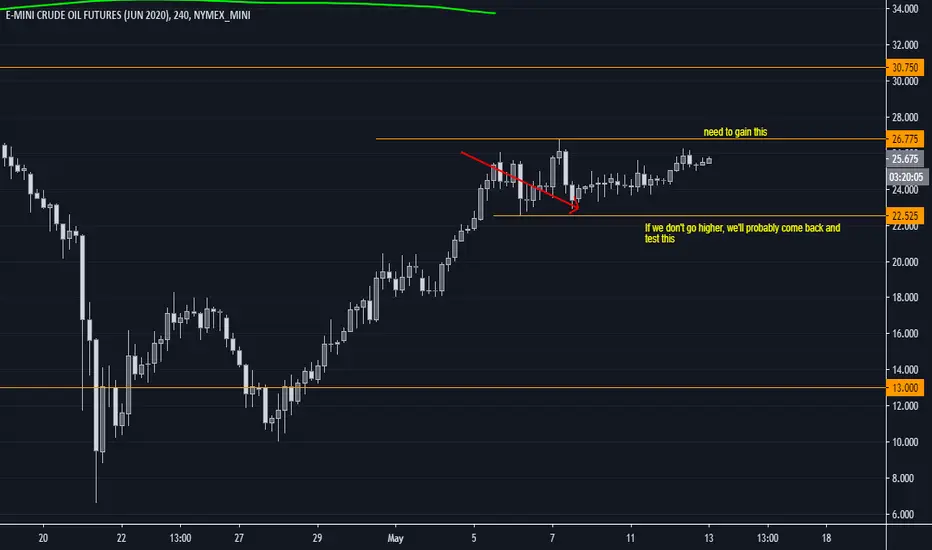
OIL: At a decision point.To go higher, oil needs to keep gaining levels. Looking at the four hour, it looks like momentum to the upside has been slowing down, notice the smaller candle sizes.
If we don't make a higher-high, then we're probably going to go back and test support. And, I have a feeling that bid support lower is not that strong.
If oil prices turn south, then CAD/NOK/NZD/AUD will also go lower. (FX)
Oil Slides Despite Saudi Arabia Announcing Additional CutsHeadlines:
- Energy & Financial Lag Whilst Indexes Finished Mixed in US
- Oil Slides Despite Saudi Arabia Announcing Additional Production Cuts

cl, oil trading for May 11th 2020Oil got a snap higher on SA talking about cutting 1 million more barrels a day of production.
CL is very range bound and needs a solid directional break out for some unbalanced action.
I can not use the usoil chart right now due to not knowing what it is tracking

Let's wait for the correction / Crude Oil by ThinkingAntsOkUse this as a guide to develop your view of the situation:
Main ítems we can see on the 4hs Chart:
a) We have 2 descending trendlines, one has been broken, and the other one isn't
b) In general, after a structure is broken, we should expect a correction or a retest of that broken structure
c) In this case, we will wait for a correction with similar proportions to the two yellow lines we draw on the chart
d) If the Price makes something similar to that pattern (it can be a zig-zag / Flat / Irregular / Triangle) we Will be trading long towards the 2nd descending trendline
e) By the moment, this is just an analysis let us know what you think on the comments.

Crude Up in Morning US Trade Before Retracing as Optimism FadesHeadlines:
- Crude Higher in Morning US Session Before Retracing Back to $23 Handle as Optimism Begins to Fade
- Natural Gas Falls After Release of Storage Data Posting Build of 109bcf for Week
- US Stocks Push Higher with Energy and Financials Leading Whilst Futures in Asia Slightly Mixed Heading into End of Week

WTI OIL, Weekly - time for a reboundIn our previous analysis, we mentioned key levels near 161,8 Fibo expansion where also the target for a head and shoulders pattern has been set. Precisely in this chart, the price has bounced back near these levels fulfilling an Elliott wave impulse structure.
We may clearly see that the recent drop consists of five waves. As a consequence currently we could expect a rebound which should at least could consist of three waves labeled as abc.
The potential resistance for wave a is located at 29,14 USD. When it is finished the market could create another wave in corrective structure - wave b with potential support at 20 USD. After that, the market may create another upward wave - c.
________
Daniel Kostecki, Chief Analyst Conotoxia Ltd.
Materials, analysis and opinions contained, referenced or provided herein are intended solely for informational and educational purposes. Personal opinion of the author does not represent and should not be constructed as a statement or an investment advice made by Conotoxia Ltd. All indiscriminate reliance on illustrative or informational materials may lead to losses. Past performance is not a reliable indicator of future results.
66% of retail investor accounts lose money when trading CFDs with this provider. You should consider whether you understand how CFDs work and whether you can afford to take the high risk of losing your money.

EIA Posts Lower Than Expected Crude Inventory BuildHeadlines:
- EIA Posts Lower Than Expected Build Whilst Gasoline Inventories Posts Cut
- Energy Sector Slides in US Session as Large Caps Drag Sector Lower -2.63%
- Futures Lower in Asia as Stocks Set to Follow Suit with US Indexes

oil for May 6th 2020Looks like an important support level at 22.45 with first target shown. In the event we go higher will find a upper target then.

WTI Surges Above $25 Handle as Lockdowns Ease and Demand PicksupHeadlines:
- WTI Surges Pushing Above $25 Handle as Lockdowns Ease and Demand Begins to Pickup
- Markets in Asia Poised for Slightly Mixed Day Despite US Indexes Finishing Higher
- Energy Giant Shell Sells Appalachia Assets to National Fuel For $541 Million


cl, oil, day trades idea for May 4th 2020Today after a down move from Sunday open oil has been working in complete balance with a slight skew to the lower side. will be watching the red zone close along with the signals after teh opening of the RTH session.


High probability of an increase in the #CL High probability of an increase in the #CL
I do not recommend #CL for sale

Daily Review: Bitcoin (Yes BTFD)!!!You feeling it yet? The FOMO. Yup, that is exactly what's been happening today across U.S. equities and cryptocurrency. Ignited by Alphabet, Inc.'s stronger than expected earnings report, the market gapped up above the bearish daily close yesterday. Today, I was originally going to review Shopify, Amazon and Virgin Galactic, but last minute I decided to review the cryptocurrency space as my Elliott wave count has now shifted a bit. Now let's get into it Bitcoin .
More than a GAP?
As I was writing this post Bitcoin had just filled the CME Gap at around $9090. This may be significant a significant top. Since the CME opened its Bitcoin futures, the Gaps have for the most part been filled up. Now that it is filled, what can we expect going forward from the King of Crypto!
On the chart above you can see that Bitcoin is knocking right into resistance, a level in which served as the rejection that led to the strong sell off in March. Can Bitcoin continue beyond this point? Absolutely. However, the result could lead to a parabolic run up similar to June 2019. You remember what happened afterward right? The point I am trying to drive is DO NOT FOMO. Bitcoin will pull back at some point. The question is will you be buying?
From an Elliott wave perspective please view the chart below. I highlighted each correction. So far, highlighted in blue, between the December 2017 - December 2018 is a zig zag ABC correction (A). Currently, highlighted in grey (b) retraced nearly 90% of (a) and Bitcoin has reacted off the low impulsively. Conclusion: Bitcoin and the broad crypto space are beginning the (c) wave to complete the larger (B) wave. The targets are 90% of the larger (A). So targets are approaching $16,500 - nearly $20,000.
It isn't far fetched that Bitcoin return to $20,000. The bigger question is what happens afterward? If this is a large flat correction, Bitcoin could retrace all the way back down to $3,000 after $20,000. Wouldn't that be amazing? I wouldn't bet against it.
In the short term, Bitcoin is over extended and heading into the weekend I'd be expecting some shenanigans. Ultimately, I am a buyer on the dip, preferably a dip to the 0.618 fib of the completion of this move up. Bias: Bullish .
Finally a Bull Market?
MAYBE . Although, I am ready to say BTFD and HODL until approximately $16,500 - $20,000, I am not ready to say that this is the bull run everyone is anticipating. Remember, crypto is still very young and immature. There is a lot of hope riding on a bull run. Loads of people will begin clamoring that Bitcoin is digital gold... etc. What if we just treat Bitcoin and crypto in general as a tech. Similar to all those stock on the Nasdaq the cryptocurrency market has been a leader since the March low. In fact, I'd say the cryptocurrency market has never been so correlated to the stock market. It has nearly gone in lock step all month long.
As a final note, some cryptocurrencies I believe will outpace Bitcoin in USD gains are Ripple and Bitcoin Cash. These crypto's have very bullish set ups and I will share them on a later post!

cl, oil, day and trading for apr 29th 2020I know this is going to get me lots of hate mail. but a very good oil short is setting up today.

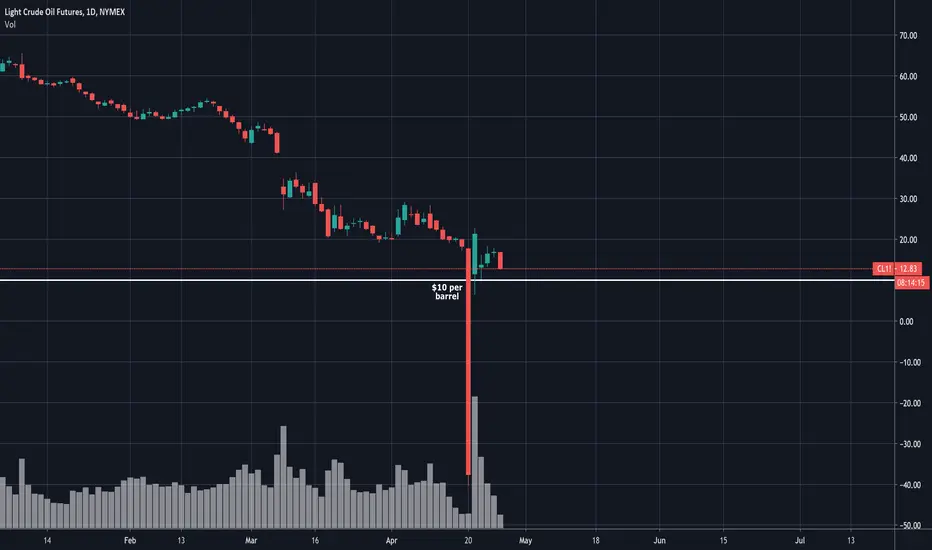
Who said that oil matters, anyways?Crude oil, the thing which drives not only the energy sector, but fundamentally drives the economies of large swaths of the planet, is trading at $11 with weeks left on the futures. But the economy is in great shape, here, folks, nothing to worry about.
The Federal Reserve can just press a button on its keyboard, add $6,000,0000,000,0000 and the economy is magically wonderful again.
NOTHING TO SEE, HERE, FOLKS.
MOVE ALONG. BELIEVE WHAT YOU ARE TOLD.
/s

oil, cl, trading for Apr 27th 2020I do not have much to say, other than I have been and remain short oil!

oil, cl trading oil : looks to be getting some relief from the restriction of retail trading on the front contracts and the ETF's pushing there buying further out in the cycle but the condition that caused negative prices has not been resolved so remain leaning on the short side, looking long term for the major turn point.

$10 oil coming again!? Psychological level to watch$10 seems like a psychological level to watch.
I've marked it down on this chart.
I will be watching.
It will be really crazy if, for a second, time, crude oil goes negative.
oil, cl, trading for Apr 24th 2020I find it interesting that I got many comments on my call to remain short oil. I would like to expand on this concept. First thing to point out is no one asked me how I plan to short or, and what part of the oil complex i am shorting, and additionally is there anything in the sector I am long.
Second part is the price is low and looks attractive to be long, but the question is how do you get long oil at this time as we deal with a very significant contango situation.
Here is my advice, Be very careful!!! and happy to have private chat and even a chat group to discuss the oil structure o complex.
