April 24th WTI CrudeOil Chart Analysis
Hello,
“Make it simple, make profit”
It’s BitcoinGuide.
Don’t forget to
“Follow” me and press “Likes”.
I will begin WTI ZeroMarket CrudeOil Chart Analysis for April 24th .
30 minute chart, long position strategy.
On the blue path,
If , green parallel line Break Away,
Strategy is invalidat.
After that, check the long position entry position.
entering After,
At the bottom,
it's sad expression "Stop loss".
Thank you.
CL

cl, oil, trading Apr 21 2020Oil is a longer term short and even at these levels is not a long yet. Day trading is hard in oil but has some big moves, I would remain leaning short even in day trades.

Oil with stiff overhead resistance. But mostly clear to $23-24.1. Oil futures did not go to zero, dummies. Learn how futures contracts work.
2. Been a while since we've seen $25+ oil, which is why we see the light blue, orange, and purple levels above price.
3. That said, I can't recommend shorting the bottom on oil. Oil from $20 - 23 is a 10% increase, and we're pretty clear to get back to $23-24. You could easily blow out your account if oil prices suddenly rise 10% one day ($20 to $22).

cl oil day trading for Apr 17th 2020Today we roll to June contract and that is a big jump, will expect oil to migrate to the 20 on the front again. Today like yesterday will have lots of rolling volume so will be a choppy trade sitting out oil today other than short time spreads all ready in play.

BUY WHEN other are dumb lol thanks for paniclol speculator thinks oil will go to zero, seems like stupidity is contagious
bear trap elow support
buy and forget it

Crude oil - Lows of the 35-year cycle Today, when I opened the chart, I saw a price of $12 for 1 barrel of oil.
I remember when in 2017 I talked about this price.
WTI
We are now at the strongest support level. This is a minimum of a 35-year cycle. And according to my trading system, levels are now a great entry point into the market. But we can be at these levels for a long time
Follow risk management
Best regards EXCAVO

Bullish on OilCrude just hit $13. either we bounce here or oil is dead forever.
Long term, i think its very unlikely for oil to stay this low for long.
Just look at these companies break-even cost for oil.
www.reuters.com
to summarize -Russia break-even cost $25-$30 per barrel
I would imagine that applies to most of the middle east countries.
In addition to that, most oil reserves around the world will be filled to the max by end of April so once it bursts, they will have to pay people to buy oil lol.
we know that's not happening.
Why is oil price so low then?
because in the past few years, american oil company started to dominate the world market, we were producing tons and tons of oil and selling it, thus driving oil price down. the opec no longer had a monopoly and there is no better opportunity for them to kill these american oil company than now.( i know it's horrible for us )
So with the demand driven down 75% due to corona virus and they increased their supply by 400% ( that's a huge surplus)
they instantly crushed the oil price and are forcing a lot of the us shale company to go out of business because their balance sheet was already weak. a lot of them are in the process of pending doom so they are kind of putting a clearance sale on all their oil at like $8 a barrel.
Btw, 1 barrel is 42 gallons. if oil is $13 a barrel, that's $13/42g= .31cent per gallon.
so?
I would go long at $13, and continue to add more every $2 drop. on longer dates.
or do uso.

Important time for oilIn the last 20 years the average return was the following on a month to month basis:
Jan: -.7%
Feb: +.5%
March: +.9%
April: +1.4%
...
May: -.5%
June: +.4%
July: -.6%
August: -.1%
September: -.4
October: -1%
November: -1.1%
December: -.5%
We are entering a seasonally negative cycle and a critical level this month (PER THE 200 MONTH MOVING AVERAGE). Watch how it closes at the end of APRIL.

Oil WTI, D1 - new lows after an irregular correctionThe price of WTI oil has reached the new low after a described earlier an irregular correction. As we mentioned in the previous analysis, the price of oil could be under pressure even after production cuts. Looking at the whole structure the price may head towards the 161,8 Fibo expansion near 10 USD per barrel.
________
Daniel Kostecki, Chief Analyst Conotoxia Ltd.
Materials, analysis and opinions contained, referenced or provided herein are intended solely for informational and educational purposes. Personal opinion of the author does not represent and should not be constructed as a statement or an investment advice made by Conotoxia Ltd. All indiscriminate reliance on illustrative or informational materials may lead to losses. Past performance is not a reliable indicator of future results.
66% of retail investor accounts lose money when trading CFDs with this provider. You should consider whether you understand how CFDs work and whether you can afford to take the high risk of losing your money.

cl, oil day trading and big picture Apr 15th 2020Today will update after the inventory report with day trading ideas and also my concept for oil going into the next few months

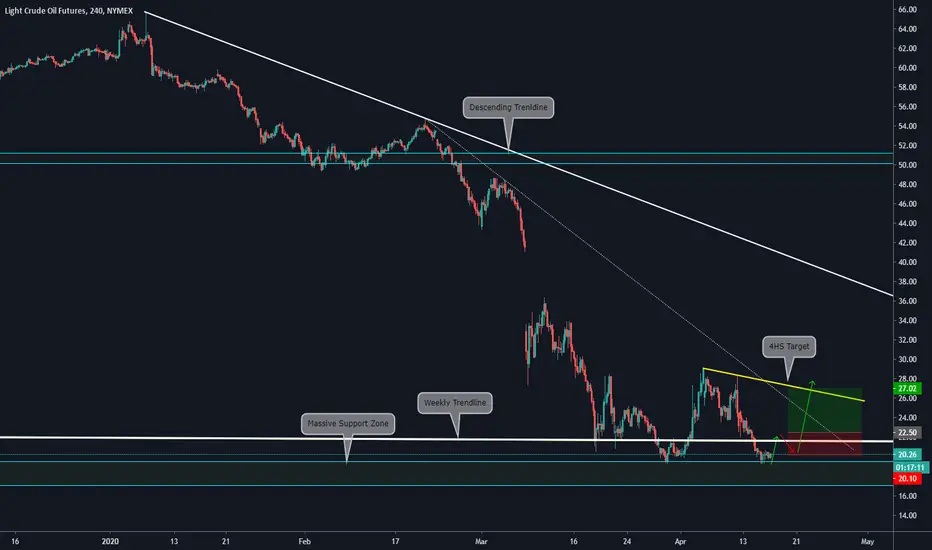
Weekly and 4HS analysis + Trade idea on Crude Oil ThinkingAntsOkUse this as a guide to develop your view of the chart:
FIRST, let's start with the Weekly Chart:
a)The price is on the lower trendline of a massive corrective Structure + Support zone
b)We expect a Bullish movement on the long term towards the next Dynamic Resistance zone
c)ABCDE Patter is finished. We should deduce a bullish movement
SECOND, let's go to the 4hs chart:
a) The price is on the massive Support zone of the Weekly chart on its 3rd attempt to break it.
b) If the price failed. We should expect a bullish movement towards the secondary trendline of the bearish movement (4HS Target)
c) We will wait for an impulse and a small correction
d) We will set our orders above the structure and our stop below it.
e) Our Expected Risk Reward Ratio will be 1.8 more or less.
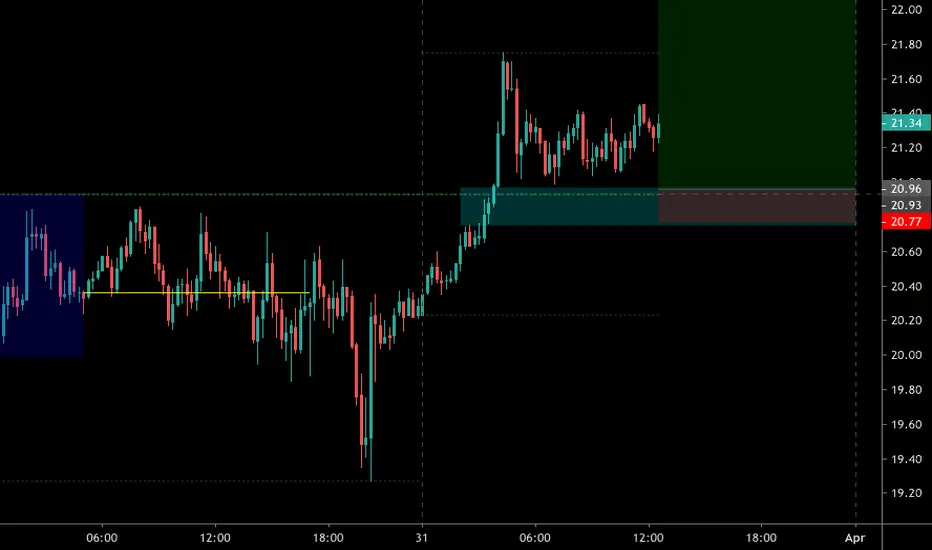
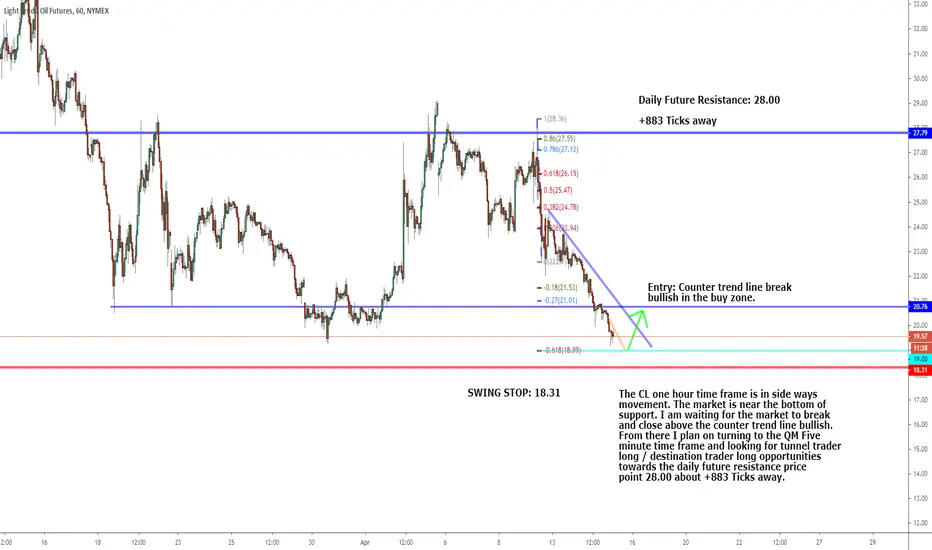
Could 18.99 be the bottom for CL?CL is in a sideways movement. The monthly time frame shows the market is at support and hitting a down monthly fib extension. The one hour is in sideways movement near the bottom of support and there is a one hour fib extension at 18.99. I am looking for a counter trend line break bullish. I'll be looking to buy the U-turn and not guess the U-turn (Big mistake when you try and jump in early). First target around 28.00 the Daily future resistance.
Oil WTI, H4 - new downard impulse wave?As we mentioned in the previous analysis, the price of WTI oil has accomplished the pattern of an irregular correction. Currently, the potential support at 23,52 USD seems to be broken and the new downward impulse wave may occur.
As a consequence, the low of wave B may be broken in the near future and the way to the new lows may be open.
________
Daniel Kostecki, Chief Analyst Conotoxia Ltd.
Materials, analysis and opinions contained, referenced or provided herein are intended solely for informational and educational purposes. Personal opinion of the author does not represent and should not be constructed as a statement or an investment advice made by Conotoxia Ltd. All indiscriminate reliance on illustrative or informational materials may lead to losses. Past performance is not a reliable indicator of future results.
66% of retail investor accounts lose money when trading CFDs with this provider. You should consider whether you understand how CFDs work and whether you can afford to take the high risk of losing your money.

Analyse on Crude oilThe oil still very bearish! For those who look for buy the oil, I recommend being very cautious and waiting for breakouts of the important levels!!

CL Monthly time frame bullish, +3,700 ticksCL Monthly time frame is in a down channel. The market has hit support and hit a down fib extension. I am expecting the market to U-turn bullish and head towards the top of the resistance which is about +3,700 ticks away.

Oil WTI, H4 - the end of an irregular correction?In the previous analysis, we mentioned that an irregular correction labeled ABC may appear on the oil price chart. Since then, wave C has ended and the price of oil has started to fall. As a result, the irregular correction may have ended, which in turn may lead to a new downward impulse.
Therefore, the area of USD 28.20 remains an important resistance point and until the level is not broken, the downward trend could be continued.
________
Daniel Kostecki, Chief Analyst Conotoxia Ltd.
Materials, analysis and opinions contained, referenced or provided herein are intended solely for informational and educational purposes. Personal opinion of the author does not represent and should not be constructed as a statement or an investment advice made by Conotoxia Ltd. All indiscriminate reliance on illustrative or informational materials may lead to losses. Past performance is not a reliable indicator of future results.
66% of retail investor accounts lose money when trading CFDs with this provider. You should consider whether you understand how CFDs work and whether you can afford to take the high risk of losing your money.

I recommend buying for the next few minutesI recommend buying for the next few minutes looking for profit as soon as possible

Light Crude Futures - 14:39:56 (UTC) Mon Apr 6, 2020 Light Crude Futures - 14:39:56 (UTC) Mon Apr 6, 2020


oil, cl, day trading for Apr 2nd 2020the early session has been all long and is balancing near teh highs so will be watching for a test of the lower balance (Red low) for a continuation long or a break lower, So that lays out plan a and plan b.
Everything will depend on how we respond off the lows. and in the event we only test the high will look for break that retests for a long.

cl, oil, day trading for Apr 1st 2020Today is simple due to the oil report and think we stay inside the red zone until report.
however if we do break the zone will still wait till post report, I think we will soon start to see some big inventory builds

cl, oil, day trading for Mar 31st 2020oil has been moving up but is now testing its entire current range and the bottom of this range is critical to the bull case for the day. W also could be expanding the chop zone to include yesterday and today, we will know this better by days end.
I will be looking for the long and short inside the red zone until the red zone is broke and at that point trading in the breaking direction trying to make the targets posted.