CL, Oil day trades June 12thToday's back and forth range could be 51.20 to 52.50 with most of the traffic around 51.75, So the trade plan will be to look for longs from bottom and shorts from top, and in the event we move out of this range then will watch mostly for longs above this level targeting 53.50, and a break below will have a target of 50.50
CL


oil, CL, day trading for June 11thToday will keep it real simple, will be looking at the 53.08 to 54.58 as teh trading range and looking for shorts from top to the hash line as target and same from the bottom long. This idea will be revised in the event we break this range.

CL OIL day trading Jme 10thwill remain looking long if we remain above 52.87, lower target levels are shown on chart, Will be trading the range until the break above or below is presented

oil CL day trades June 7yhToday the middle of my chop zone will be 53 and the top of the range is 53.85 and the bottom is 52.30.
Trading above this range will target 54.28 and trading below target 51.50
would be fun to see this trend but have a feeling we will stay pretty close to the trading range today

cl oil day trading June 6thtoday's trading range of 51.50 to 52.50 is not giving much more info to today's trades other than further down is most likely in a bit bigger picture. above 52.50 will be looking for resistance at 53 area and below 51.50 will be looking to retest yesterday low.
So Today my idea is to be range trading in the range and then look to be holding long from range bottom in the event of a up side break and holding short from the range top in the event of a down side break. In the range its self will be protecting gains at range top and range bottom

oil CL day trading june 5thlooks like more range trading until it break out of the 52.6 and the 53.4 boundaries, if we go out of this range the targets are marked on the chart

CL oil day traing for June 4thtoday will be trading a chop pattern if we remain between 53.29 and 52.45. above this range will look towards 54 and below 52.11 and 51. The over night is balanced and provides no clear direction on open

OIL day trades June 3rdToday looks like a 54 to 56 trading range could be the play so will look to trade back and forth if we remain in this consolidation. A break below will have me hold shorts from above if the signals are bearish, and a break above 56 I will hold the long from below if the signals are bullish. So summary is 54 to 56 I will short the top of this range and long the bottom but as the trade moves towards the opposite range boundary will see if I see enough strength to carry me past this range and if not will take off the profit. alternatively if trading more than 1 lots will reduce size and boundaries and hold a single runner for possible break out

oil, CL day trades for May 31This could be a good day for trading oil even if we consolidate due to the possible large consolidation range of about 1 point. so that will be primary focus until the over or under line gets violated. In the event we move out of this range will update with targets and ideas at that point. other wise will be keeping it very simple and looking for reactive triggers to trade off of.

Crude melting in trade WarWelcome to all traders
This is the broader picture of the correction pattern of CL
we all know that crude prices are effected by Trade War but chart is also directing towards a correction that is going on that started around 66 area and now heading towards 50% entrancement zone that lies around 54.40 0.382 just broken yesterday expect further drop in coming days

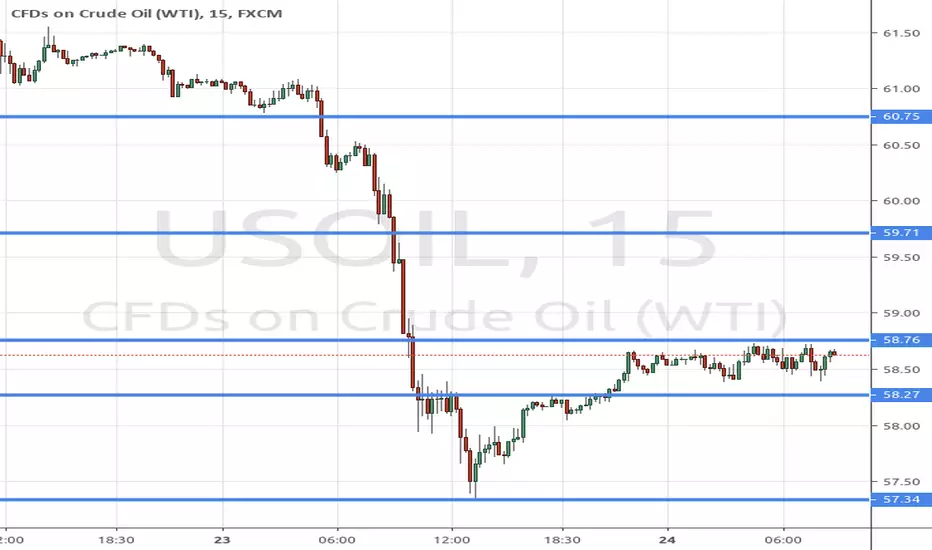
cl oil day trades may 30Today oil is not giving me much info to create from so will be watching 58.56 for a bounce and 59.48 for rejection. Moves out of this range will have me stalking continuation action. will keep you posted

day trading Oil, CLToday will be looking for a break above 5770 for a long idea up to first target of 58.33, and a break below 57.14 for a first target of 56.75. If we remain between these tow prices will be trading it as a consolidation range

$CL_F crudeoil day trading May 28Looking to trade in a range below over line and above under line until this market breaks out, then the next shown lines will become the next target. After break out and based on how it breaks out will dictate how I will pick my trade.

$CL_F Oil day trades May 14thToday after a big down move yesterday will be looking to see if oil is just going to consolidate sideways, will be watchful for any impulsive moves out of the area set out and then take a long or short based on how the market performs, will update as the info flows in
CL $cl_F usoil day trade may 23strong down move that might need a bit of buying to re balance and then find more sellers, for a couple targets lower that will show up if the move gets going. would need a move above 60.44 before even thinking to the long side. so plan will be to stalk shorts on a small bounce up

CL day trading May 22Today if 61.90 holds as support then think we move back up to 63 area and just chop around after that. and a move below 61.90 then will target 61.20 for the short

Oil Looking Ready to BreakoutOil seems poised to rip to higher prices after yet another Trump tweet knocked it down 300 ticks or so from the 66 handle down to the 63 handle. Historically, the markets take his tweets seriously in the short term, but nothing has changed in the way of the fundamentals for CL. There is still turmoil in the middle east, Venezuela, and with Iran. Libya and Nigeria in particular have been on the map as of late.
Technically, we appear to have completed a nearly perfect Elliott Wave corrective phase. If this is the case, we can expect a breakout from current levels, if not, we will know very soon. We are wrong if it breaks down from $61.71.
The Kovach Momentum Indicators note decline in momentum. This has leveled off suggesting a breakout is near. The Kovach Reversals Indicator posits that we are in the middle of a range confirming that a breakout should be near.

MASSIVE OIL Sells on Daily chartAs i mentioned before in my post - we're waiting for OIL shorts. So now we have:
1) Huge false break out on DAily of S/R level.
2) False breakout of 61.8 FIBO zone.
3) Short candlesticks formation on DAILY.
4) Engulfing DAILY candle
5) Close lower previous HL (higher low)
6) Break of DAILY trend line
7) MAssive volume over $65 zone

strong frist-step for bear ! foucsing on forming reversal singalPut the eyes on first B-C wave
it must be deeply enough to recoginzed long-term bear-side
i would continue short if B-C wave beyond 2 dollar (66.60-64.60)

CL - Crude Oil Future - Sell @66.25 SL @66.45 TP @ 65.56CL - Crude Oil Future -
Sell @66.25
SL @66.45
TP @ 65.56

"Starting the week on USOIL” Multi timeframe view by TAvisionThis is our “Every-Monday” report on USOIL with a full vision over 3 timeframes.
4H CHART EXPLANATION:
- Price is on a confluence level (Pullback to TL + Resistance Zone).
- Bearish Divergence on MACD.
- if price breaks the ascending channel (63.60), it has potential to move down towards the support zone (62.2)
- We will be looking for sell setups on lower timeframes.
Updates coming soon!
MULTI TIMEFRAME VISION:
Weekly:
Daily:

Crude oil Big shortBig short
We touched resistance line and dont break this is mean OIL need show correction
Volumes decrease
W1 chart
