EURNZD Getting Bearish wait to sustain below the point of 1.60226
then with confirmation, we'll take sell entry
Comex

CADJPY is falling (swing trade )We have a cadjpy analysis here where it has to retest our point first so we can enter and if it reaches around our point or above or below like 10/20 pips we'll take a sell entry with a goal of approximately 280 pips. FX:CADJPY

EURUSD get bullish here we have a good point with perfect retracement and we take a buy entry and wait for our tp which is around 60 pips

GBPJPY Is it BEARISH OR BULLISH ?well here we have some conditions and if they work according to us then we'll take an entry

CHFJPY about to breakout we'll wait for the point and once it touch our point and sustain and take a retracement then
we enter in trade and each side we have 130 pips

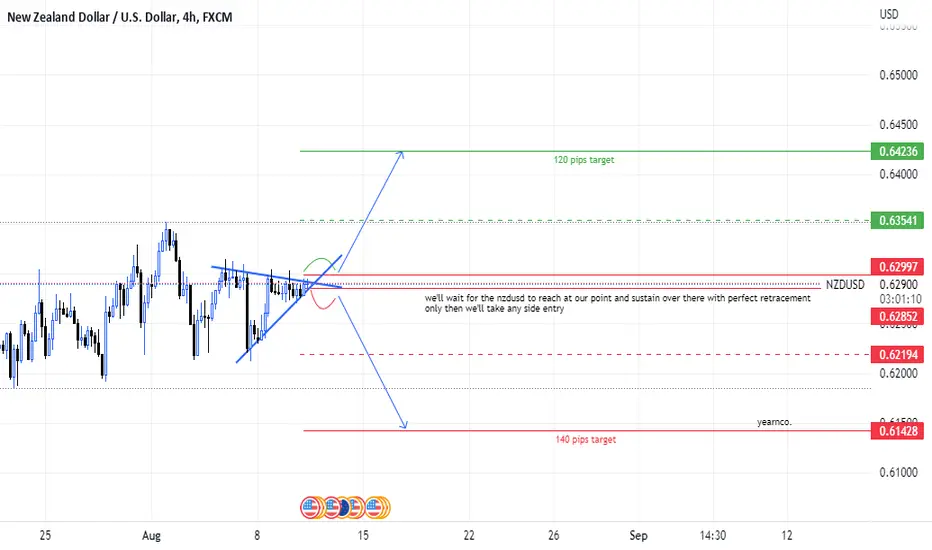
NZDUSD pattern ?well here we have a good pattern where we can easily take 120 to 140 pips on each side and all we need to wait and let the retracement happen after that we can take easy good pips by making entry
GBPJPY likely to give 90 pips easily well we have a point to take an entry
for the sell entry we have to wait for the retracement and for buy entry, we'll wait for the breakout of our point
and sustain over the line and perfect retracement and once it fulfill our requirement we can take a entry

XAUUSD next move so here we have the proper points where we can take the entry according to the gold sustainability and wherever it get sustain first then we'll take the trade as we have given 2 points one for buy and one for sell

EURCAD new ideas Here we have a good point for the breakout from the rectangle and once it goes the whatever direction we'll take that trade because it can simply make 40 pips in next momentum

CADJPY should be fall well it's good point from cadjpy can fall 200 pips down from here all we need to wait and take a entry at our point when it sustain below the line

USDJPY getting bearish Here we have a good point where usdjpy can get fall around 145 pips so from this point we'll short the usdjpy

AUDJPY Upcoming movement well here have good chart pattern where we have to wait a while and wait for our point and if it reaches our point then we can take an entry according to our analysis

EURUSD upcoming move we have 2 possibilities and have to be patience and once t reach the point only we'll take the trade for the sell entry, it has to retrace till my point, and once it touches and sustains below this then we'll take sell entry and like same for the buy trade we have to wait for the point and wait for the retracement till our point and take a by entry.

EURNZD Going short we are expecting eurnzd to get down from this point we'll have to wait this hourly candle if it sustain below the point then we can take sell entry

EURCAD new possibility EURCAD has good chances with the price action so for now as you can see there are chances of fall but if the fundamental hit the technical and price get sustained above the buy zone then we can take a buy trade

DAX Analysis 02/08/2022From a technical perspective, last week Friday saw a monthly candle close as a bullish candle of a level of support. We closed above the 50-SMA while at the same time maintaining a bullish structure (higher highs and higher lows) on the monthly timeframe. The daily timeframe saw another bullish candle close as we now trade between the 50 and 100-SMA.

NZDCAD more likely chances to fall from here NZDCAD can fall from this point
as there is strong resistance which is stop nzdcad to get bullish and i have used some technical pattern and some price action into this
NZDCAD

Gold Forecast 21/07/2022Gold is expected to move a further down more as the chart says a low of 1667 is expected

Gold Price ForecastGold prices are trading in a descending triangle, which signals volatility control. The downtrend line is projected from a high of $ 16,857.58 on June 16, while horizontal support is placed from a low of $ 1,815.73 on June 16. The golden bulls included a 20-fold exponential moving average (EMA) of $ 1,821.22. The Relative Force Index (RSI) (14), meanwhile, was able to recover in the range of 40.00-60.00, indicating that a new part of the downward motion has now been postponed.

Gold Weekly Technical Analysis 27/06/2022On an hourly scale, the gold prices are trading in a symmetrical triangle that signals a slippage in the volatility. The upward sloping trendline is placed from June 14 low at $1,805.11 while the downward sloping trendline is plotted from June 16 high at $1,857.88. The greenback bulls are defending the 50-period Exponential Moving Average (EMA) at $1,828.75. Meanwhile, the Relative Strength Index (RSI) (14) has shifted into a 40.00-60.00, which bolsters a rangebound move ahead.

GC Comexthe cold in the next days shows a bullish signals the price will gonna arrive to 1958.8. this is obvious due to a lot of politics and fondamental causes...

GOLD as we suggested ..... jump in bullion ..next update join spot gold has reached the target . jump up we suggested to buy in mcx gold

Gold Futures Do Not miss this Swing short opportunity Looking at the Monthly chart we can see a clear similarity in the price action from the present time to
the previous ATH back in 2011.
With HTF Resistance above us and previous attempts to retest those highs creating monthly lows since the
August 2020 ATH I anticipate a potential SFP into the red box marked RESISTANCE before a move to the downside.
This presents a great opportunity to open shorts with a generous risk reward .
I have pulled some key fib levels that align with the EMAs in chart for additional confluence in those lower regions .
Set alerts and wait for the trade to come to you .
Always know your invalidation and stick to your trading plan .
I will post my monthly Chart of the DXY index also as that analysis correlates very well with this idea.
Thanks for stopping by and be sure to follow me for future analysis and updates
