Go long on gold in the 4185-4205 range after the market opens!Last week, the gold market performed steadily overall, with prices rising steadily and limited intraday pullbacks, avoiding significant volatility and creating a favorable market environment for traders. In terms of trading strategy, we maintained a long position strategy for several trading days from opening to closing, aligning our overall approach with market trends. Our previous prediction that Friday's closing price would break through $4200 has indeed materialized. It's worth noting that we still have long positions established at the $4050 level in our account. Readers who have not followed this viewpoint can refer to historical analysis records to understand the complete logical context.
From a technical perspective, gold is gradually regaining its strength, with prices effectively recovering previous losses and continuing to approach previous highs. On the weekly chart, prices have stabilized above major moving averages, and the daily and hourly charts also show positive signals. Based on the current trend, the trading strategy after the market opens will still focus on going long. I plan to build positions in batches within the 4185 to 4205 range. This area has strong technical support and the risks are relatively controllable.
The above are personal analyses and opinions, for reference only. For investors who have not yet developed a clear trading system or lack independent market analysis capabilities, we welcome exchanges and discussions to jointly improve our professional skills. If significant changes occur in the market, relevant adjustments will be promptly announced through this channel.
Commodities
Hellena | GOLD (4H): LONG to resistance area of 4382(Wave 3).In the past forecast, many have rightly pointed out that wave “4” went behind the high of wave “2” and yet we are not dealing with a diagonal.
This means that the waves have stretched and have a larger range of motion and now the correction in wave “2” is ending.
Essentially the upward movement is still prioritized and I expect two scenarios:
1) Continuation of the upward movement to the resistance area of 4382 (market entry)
2) Reaching the support area 3994.4, after which the correction can be considered complete and only then the movement to the area 4382 will start.
Manage your capital correctly and competently! Only enter trades based on reliable patterns!

Silver Cup and HandleAfter some consolidation silver has started showing immense strength. Silver is buy on dips. Take long positions in silver in any dip you get. Check the chart for the cup and handle pattern on the daily timeframe.
Support will be the low of the handle as seen on the chart for big risk takers and for small risk takers sl can be around 157000.
Target- One can look for all time highs as target and then 180000.
Disclaimer- This is just for educational purpose.
Jai Shree Ram

Gold remains bullish.From a technical perspective, the monthly chart continues its bullish trend, while the weekly and daily charts closed with significant gains. Last week, after testing the 10-day moving average (MA10) at 4050/40, the price regained support in that area. The daily chart also shows strength, with the MA10 and 7-day moving averages trending upwards, and the lows gradually moving higher. The price is trading within the upper Bollinger Band channel, and the RSI indicator is above the midline. The short-term 4-hour and 1-hour charts also show an upward-trending moving average system, with the Bollinger Bands expanding upwards. The initial trading strategy for gold at the start of the week should focus on buying on dips, followed by selling at key resistance levels.
In the short term, gold prices finally broke through the resistance at 4210, after which they pulled back slightly. Currently, a strong upward trend has formed on a smaller timeframe, and further gains are possible after the pullback. On the 4-hour chart, the main support level is at 4200. If the upward trend continues, a significant pullback is unlikely; therefore, it's important to watch for buying opportunities after a short-term bottom is established.
Key Levels:
First Support: 4208, Second Support: 4190, Third Support: 4172
First Resistance: 4260, Second Resistance: 4276, Third Resistance: 4298
Gold Trading Strategy:
BUY: 4195-4200, SL: 4185, TP: 422-4230;
SELL: 4270-4275, SL: 4285, TP: 4250-4240;
More Analysis →

Gold market {Trend Analysis}Last week we saw gold buy up to 4200's after a delayed bullish momentum until the close of last week's candle. Gold extended its bullish strength up till the 4220's where we closed off for last week. This week we saw gold continue on its bullish sentiment up till the 4250's before the ongoing bearish retracement.
fOLLOWING THE ANALYSIS, we see that gold mitigated its 50% trend channel on the 4hour time-frame before the bearish turnaround back to the 4220's. A break below this zone insinuates more lower liquidity grab back to the 4100's.
Further updates would be given as the market gains momentum

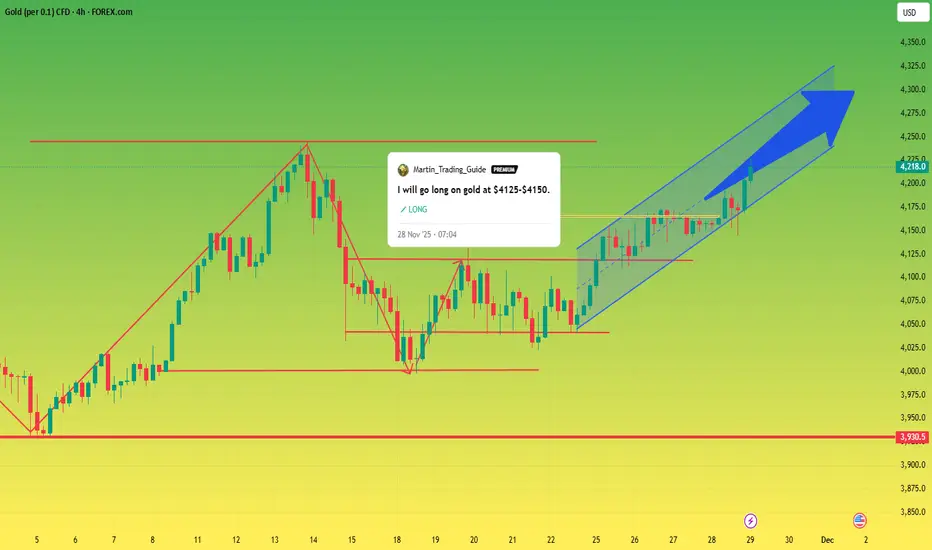
After the market opens, I will continue to go long on gold!The countdown to the opening of the gold market has begun! Before the market opens, let's review last week's market movements and trading strategies.
Last week's market performance was very stable compared to previous weeks, with an overall upward trend and relatively small intraday pullbacks without significant volatility. This kind of market movement is very favorable for traders. Our trading strategy, from opening to closing, focused on going long on gold for several trading days, with our thinking largely in sync with the market movement, including our prediction that Friday's closing price would be above $4200, which all came true. It's no exaggeration to say that I still have long positions held in my account, bought at $4050. For those who haven't followed me, you can check out my historical perspectives.
As seen from last week's price action, gold is regaining its strength, gradually recovering lost ground and approaching previous highs. The weekly price has rebounded above all major moving averages, and the daily and hourly charts also show strength. Therefore, after the market opens, our strategy will remain primarily long. I plan to enter the market in batches in the $4190-$4210 range, a level with strong support and relatively safe entry.
The above views represent my personal thoughts. If you do not yet have a clear trading strategy or the ability to independently analyze market trends, you are welcome to refer to them! Let's improve together! If the market changes, I will notify you in the channel!

Heading into key resistance?WTI Oil (XTI/USD) is rising towards the pivot, which acts as an overlap resitance and could reverse to the 1st support.
Pivot: 62.24
1st Support: 56.51
1st Resistance: 65.75
Disclaimer:
The opinions given above constitute general market commentary and do not constitute the opinion or advice of IC Markets or any form of personal or investment advice.
Any opinions, news, research, analyses, prices, other information, or links to third-party sites contained on this website are provided on an "as-is" basis, are intended to be informative only, and are not advice, a recommendation, research, a record of our trading prices, an offer of, or solicitation for, a transaction in any financial instrument and thus should not be treated as such. The information provided does not involve any specific investment objectives, financial situation, or needs of any specific person who may receive it. Please be aware that past performance is not a reliable indicator of future performance and/or results. Past performance or forward-looking scenarios based upon the reasonable beliefs of the third-party provider are not a guarantee of future performance. Actual results may differ materially from those anticipated in forward-looking or past performance statements. IC Markets makes no representation or warranty and assumes no liability as to the accuracy or completeness of the information provided, nor any loss arising from any investment based on a recommendation, forecast, or any information supplied by any third party.

XRP outcome!XRP did a drop in the Asian session after markets opened up. Possible reversal near this zone going to the London session or a reversal at the bottom of the channel or near it.

GOLD ANALYSIS (1 W)To understand the psychology in Gold,
I use only two tools:
Fibonacci retracement,
Trend-based Fibonacci extension.
We will use these two tools to measure the weekly cycles.
Since November 2022, Gold has been forming a pattern that can only be explained by Fibonacci principles.
Using Fibonacci retracement for each swing high and low, you'll realize that each retracement equals around 50%.
In only one example, we see that a higher low reaches the 61.8% level, which is also acceptable.
After these retracements, the next leg of the impulsive move always reaches around the 1.618 Fibonacci extension.
According to these two basic technical factors, Gold should first reach around $3,800, and then aim for the $6,600 level during the next impulsive leg in the coming years.
I’m not even going to list all the reasons why Gold tends to go up over time.
Most people reading this analysis are already aware of the fundamentals behind Gold’s long-term bullish nature.
Thanks for reading.

Cup & handle, bull flag - look for a breakoutCommodities are bullish right now if you didn't know.
Silver, Gold, Natural Gas, Palladium and more. They are all interesting right now. Commodities is the sector you should be looking at right now.
We had tech, weedstocks, cryptos, ai
now look for commodities for near term plays.
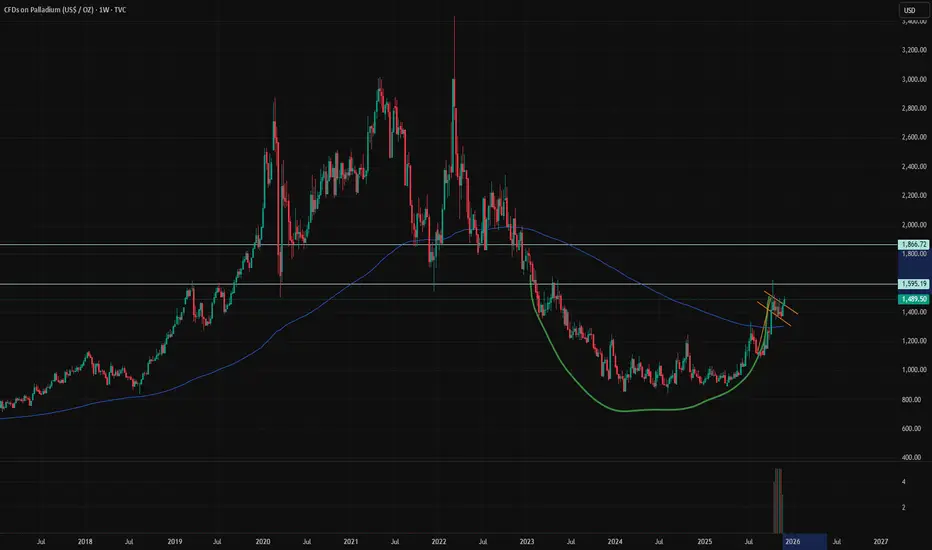
Speaking of Palladium, I love this chart. Beautiful.
We have a nice formation of a 2 year cup with a resistance at 1600$
Short term, we have near break out of bull flag at 1500$
The blue zone extending to may should be a zone where you have to keep close attention to this chart.
I'm expecting a breakout with target of 1870 ish on palladium. I'm early on this one, there is no breakout at the moment. I just follow the good sector and bet on the nice chart.
Natural Gas - New 52 Week High? Natural Gas appears to be setting up another bullish move this week.
A sweep of its 52 week high seems very likely.
If this sweep of the massive March 2025 high pivot occurs there is a very high probable day trade short scalp opportunity.
I'm watching the next inventory report on Thursday very closely.

Natural Gas | | Oil | Dollar | Silver | Gold Price ForecastNatural Gas | | Oil | Dollar | Silver | Gold Price Forecast
NYMEX:NG1! NYMEX:CL1! COMEX:GC1! COMEX:SI1!

BRIEFING Week #48 : Monthly Hanging ManHere's your weekly update ! Brought to you each weekend with years of track-record history..
Don't forget to hit the like/follow button if you feel like this post deserves it ;)
That's the best way to support me and help pushing this content to other users.
Kindly,
Phil

GOLD FREE SIGNAL|SHORT|
✅XAUUSD strong sweep into the supply zone triggered a premium-priced rejection, aligning with the ICT narrative shift for a short-term distribution leg targeting inefficiency below.
—————————
Entry: 4,215$
Stop Loss: 4,240$
Take Profit: 4,185$
Time Frame: 4H
—————————
SHORT🔥
✅Like and subscribe to never miss a new idea!✅

Gold Intraday Range With Highlighted Reaction ZoneThe chart shows price moving into a marked zone after a steady intraday climb.
A lower reference level is outlined, while the upper shaded area represents the region where recent movement is being observed. This layout helps visualize how price is currently interacting within its short-term structure.

Silver’s Cup & Handle Breakout – Road to $60+ Silver has completed a textbook cup and handle formation and is breaking above the key resistance level at $54. The pattern shows a rounded bottom (cup) formed between $46-$54, followed by a consolidation handle, with price now surging toward new highs at $56.5
Technical Setup:
• Cup depth: Approximately $8 (from $46 low to $54 resistance)
• Breakout level: $54.00
• Price target calculation: $54 + $8 = $62.00+
With momentum like this, the technical target comes in around $62
As long as silver stays above old resistance ($54–$55), bulls are in the driver’s seat.
Risk Management: Consider stops below the handle low around $50 to protect against false breakouts.
This setup aligns with broader precious metals strength and represents a continuation pattern following silver's major 2025 rally.

GOLD (XAU-GC) BUY PLAN📊 Market Sentiment
Market sentiment for GOLD remains strongly bullish. One of the key drivers is the aggressive accumulation by global central banks. Recession concerns and persistent inflation fears continue to position gold as one of the most attractive safe-haven assets.
📈 Technical Analysis
Price has completed the expected accumulation phase and broke out strongly from the accumulation range. This former range has now turned into a clear demand zone. Price has pulled back into this zone again and is currently testing the $4060 level.
📌 Game Plan
The $4060–$3900 zone is my primary buy zone. I will continue accumulating within this range.
My first target is $4250, followed by $4400, which aligns with new all-time-high expectations.
If price closes below $3900 on the daily, this idea becomes invalid. Therefore, my stop is a daily close under $3900.
💬 If this breakdown aligns with your outlook, like and comment below.
For deeper sentiment and strategy insights, subscribe to my Substack free access available.
⚠️ This analysis is for educational purposes only and does not constitute financial advice. Always conduct your own research before trading or investing.

SILVER Massive Short! SELL!
My dear friends,
Please, find my technical outlook for SILVER below:
The price is coiling around a solid key level - 56.402
Bias - Bearish
Technical Indicators: Pivot Points High anticipates a potential price reversal.
Super trend shows a clear sell, giving a perfect indicators' convergence.
Goal - 54.067
About Used Indicators:
The pivot point itself is simply the average of the high, low and closing prices from the previous trading day.
Disclosure: I am part of Trade Nation's Influencer program and receive a monthly fee for using their TradingView charts in my analysis.
———————————
WISH YOU ALL LUCK

GOLD MARKET ANALYSIS AND COMMENTARY - [Dec 01 - Dec 05]This week, international OANDA:XAUUSD prices rose from 4,040 USD/oz to 4,226 USD/oz and closed at 4,219 USD/oz.
Gold prices continued to rise this week because the market is “betting” that the FED will cut interest rates this coming December. In addition, gold demand surged in China as inventories at the Shanghai Gold Exchange (SGE) fell to their lowest level in a decade.
In reality, the slowdown in private-sector job growth and limited data from the U.S. government indicate weak economic activity and subdued inflation. This will continue to fuel expectations of a FED rate cut.
Next week, the market will receive several important data releases. On Monday, attention will be on the ISM Manufacturing PMI for November, followed by the ISM Services PMI on Wednesday, along with ADP private-sector employment data for October, which will be monitored more closely than usual due to the absence of NFP data. On Thursday, the U.S. will release weekly jobless claims, core PCE, and the preliminary University of Michigan Consumer Sentiment Survey for December.
📌Technically, on the H4 chart, the gold price has broken through the Downtrend line and is moving towards the next resistance zone around 4245. If it breaks this level, the gold price will approach the 4370-4380 zone. If it fails to break the 4245 barrier, the gold price will likely move sideways within the 4045-4245 range.
SELL XAUUSD PRICE 4276 - 4274⚡️
↠↠ Stop Loss 4280
BUY XAUUSD PRICE 4178 - 4180⚡️
↠↠ Stop Loss 4174

XAUUSD Sell Opportunity at ResistanceFOREXCOM:XAUUSD is now pushing into a key resistance zone, an area that has acted as a strong barrier in the past and triggered notable sell-offs. This level also aligns with a previous supply zone, where sellers once stepped in aggressively, making it a prime spot for anyone looking for potential short opportunities. With its historical importance, the way price reacts here could shape the next major move.
If bearish signals appear such as rejection wicks, bearish candlestick patterns or signs of weakening buying pressure, I expect price to drop toward the 4,230 level. However, if price breaks cleanly above this resistance, the bearish outlook may no longer hold and it can open the door for further upside momentum. This is a crucial zone where price action is likely to reveal a clearer direction.
This is just my personal view on support and resistance zones, not financial advice. Always confirm your setups and manage your risk properly.
Good luck out there!

Silver is in the Bullish directionHello Traders
In This Chart XAGUSD HOURLY Forex Forecast By FOREX PLANET
today XAGUSD analysis 👆
🟢This Chart includes_ (XAGUSD market update)
🟢What is The Next Opportunity on XAGUSD Market
🟢how to Enter to the Valid Entry With Assurance Profit
This CHART is For Trader's that Want to Improve Their Technical Analysis Skills and Their Trading By Understanding How To Analyze The Market Using Multiple Timeframes and Understanding The Bigger Picture on the Charts

XAGUSD: Bullish Wave 5 Setting a Path Toward 56.000?Hey Realistic Traders!
"Silver Riding Gold’s Momentum, New ATH in the horizon?"
Let’s dive into the technical analysis to answer the question and see what the chart is really telling us.
Technical Analysis
On the daily chart, OANDA:XAGUSD has once again rebounded around the EMA200, with repeated bounces reinforcing the strength of its broader bullish trend. During Wave 4, Silver consolidated within a falling wedge pattern, a corrective formation that typically appears as downside momentum weakens within a larger uptrend. A breakout from this pattern signals renewed bullish pressure and often marks the beginning of Wave 5 in Elliott Wave theory.
Following the breakout, price action supports the case for a developing impulsive Wave 5. The bullish Marubozu candlestick indicates stronger buying interest, while the MACD golden cross adds confirmation to the bullish bias. Together, these signals strengthen the view that momentum is shifting back in favor of the bulls.
Based on Fibonacci projections, Wave 5 may extend toward the 1.0 Fibonacci ratio, aligning with the second upside target near 56.000. Before reaching that level, price may encounter the historical resistance zone around the first target at 54.082, where a temporary pullback could occur.
This bullish wave count remains valid as long as price stays above 49.216. A move below this level would invalidate the potential formation of Wave 5 and shift the outlook back to neutral.
Support the channel by engaging with the content, using the rocket button, and sharing your opinions in the comments below.
Disclaimer: "Please note that this analysis is solely for educational purposes and should not be considered a recommendation to take a long or short position on Silver

GOLD (XAUUSD): Road to ATH
As I predicted earlier, Gold successfully bounced to 4215.
The market closed, testing a key daily resistance.
Next week, I suggest looking for its breakout to buy.
Your confirmation will be a daily candle close above 4245.
With a high probability, the market will rise to a resistance
based on a current ATH.
❤️Please, support my work with like, thank you!❤️
I am part of Trade Nation's Influencer program and receive a monthly fee for using their TradingView charts in my analysis.
