XAU/USD – Bullish Structure Intact as Price Retests Key HigherXAU/USD – Bullish Structure Intact as Price Retests Key Higher-Low Support
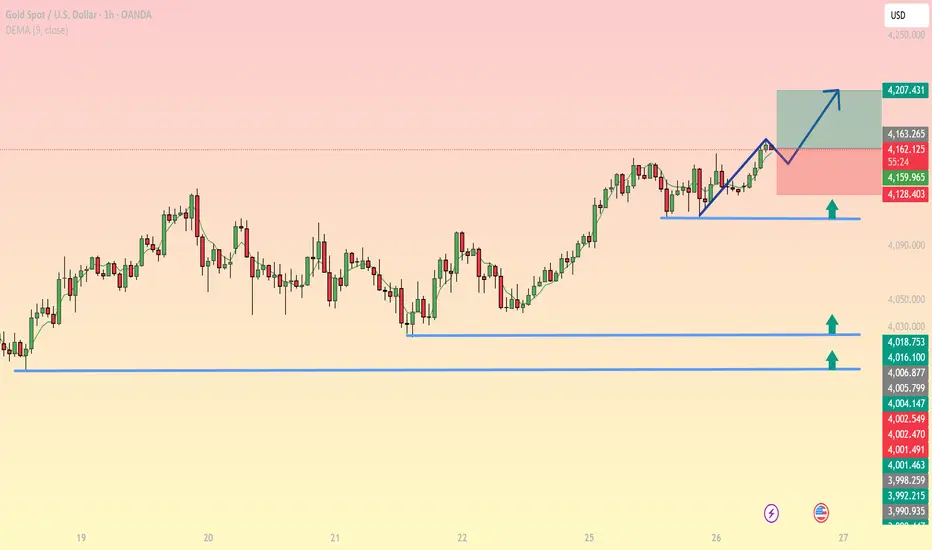
Gold continues to hold a solid bullish structure on the H1 timeframe, with price forming a clean higher low around 4128–4132 and bouncing strongly along the short-term rising trendline. The 9-EMA is pointing upward, confirming steady buying momentum.
This structure indicates that buyers are preparing for the next bullish expansion as long as price stays above the 4128–4135 support base.
Key Technical Levels
Major Support
4132 – 4128: Newly formed higher low and the strongest intraday demand zone.
4060 – 4030: Deep support, only tested if a strong correction occurs.
Major Resistance
4163 – 4167: Short-term resistance that needs to break for bullish continuation.
4207 – 4210: Fibonacci extension target and main upside objective.
Price Action & Momentum
Price consistently bounces from the 9-EMA → active buying pressure.
Rising trendline remains intact → bullish momentum sustained.
Small corrective candles near 4163 reflect weakening supply.
Bullish Trading Strategies (Primary Bias)
Scenario 1 – Buy the Retest (High-Probability Setup)
Wait for price to pull back into 4132 – 4135
Confirmation signals: pin bar, engulfing, or RSI holding above 50
Entry: 4132 – 4138
Stop Loss: below 4125
TP1: 4163
TP2: 4207
Scenario 2 – Breakout Entry
Buy after a clean H1 candle close above 4167
SL: 4148
TP: 4207
Bearish Scenario (If Market Invalidates Bullish Bias)
Only consider selling if:
Price breaks and closes below 4125 (H1 close)
Downside targets: 4080 → 4060
Market Outlook
The intraday trend remains strongly bullish, with expectations for an upside continuation toward the 4200+ zone. Watch closely how price reacts around 4163–4167 to confirm the next leg up.
Commodities
GOLD opened with a significant increaseOANDA:XAUUSD opened the morning of November 26 with a significant gain, following a volatile session yesterday when the market absorbed two conflicting signals: unexpected progress in Russia-Ukraine peace talks and growing expectations that the Federal Reserve will cut interest rates as early as December.
In the European session yesterday, spot gold fell to a daily low of $4,109.47/ounce, as news that Ukraine had “basically” agreed to a US-proposed peace plan boosted global risk appetite. Market sentiment immediately reflected capital flows out of defensive assets.
However, in the New York session, gold reversed sharply, hitting a peak of $4,159.39/ounce, recovering nearly $50 from the previous low. At the end of Tuesday’s session, gold stood at $4,130.76/ounce, down slightly by 0.1%. By this morning, November 26, the price had returned to the $4,164/ounce area, up nearly 1% on the day.
Geopolitics: Peace Signals Weaken Need for Shelter, But Not Enough to Change the Game
Kyiv has agreed in principle to Washington’s peace proposal, according to US and Ukrainian officials. Some sensitive details remain to be worked out, but many contentious points have been tweaked. The Trump administration’s original 28-point plan has been whittled down to 19, with some provisions “at least worth considering,” according to The Washington Post.
Negotiations began in Geneva on November 23, and both Bloomberg and US officials described the process as streamlined to reach a quick deal. President Trump even declared a peace deal “very close.” This news immediately sent gold prices sharply lower yesterday, demonstrating that the market remains sensitive to geopolitical developments, even when peace signals are still preliminary.
Technical analysis and suggestions OANDA:XAUUSD
Gold price maintains the main uptrend on the daily chart, trading around $4,160/oz within the medium-term ascending channel. The price is currently above the short-term MA21 (~4,056) and has bounced from the support zone around Fib 0.382 (≈3.973); RSI is recovering slightly from the neutral zone, indicating weakening selling pressure.
The 4.128 (0.236 Fib) zone is the first short-term resistance; 4.216 is the key resistance that determines the possibility of opening a new bullish cycle (extremely important). If the price holds above 3.972–4.000 and closes sustainably above 4.128, the possibility of continuing to challenge 4.216 → 4.380 increases. Conversely, a break below 3.972 will weaken the bullish structure and open the door to the 3.846 (0.5 Fib) zone or lower.
Macro backdrop: Fed easing expectations and geopolitical risks continue to be the support base; positive news on interest rate cuts will increase the probability of a breakout above the 4.216 resistance.
BUY XAUUSD PRICE 4235 - 4233⚡️
↠↠ Stop Loss 4239
→Take Profit 1 4227
↨
→Take Profit 2 4221
SELL XAUUSD PRICE 4153 - 4155⚡️
↠↠ Stop Loss 4149
→Take Profit 1 4161
↨
→Take Profit 2 4167

Gold (XAUUSD): Possible buy setup in 30m timeframeGold (XAUUSD): Possible buy setup in 30m timeframe. Pass is clear, be strict to my tp and sl, otherwise you won't get any profit.
Cheers

Gold Weakens as Sellers Regain ControlHello everyone, gold is starting to lose its upward momentum when looking at the 4H chart: the price is hovering around 4,065 USD, right after a firm rejection from the 4,090–4,100 USD region. A series of small-bodied candles with long upper wicks suggests that buyers are slowing down, while sellers are stepping back in and taking control each time price approaches the supply zone above.
Technically, the Ichimoku cloud has flattened and begun tilting downward—a familiar sign of a weak, slightly bearish sideways market. Just overhead, the 4,090–4,100 USD zone aligns with an unfilled red FVG, forming a strong resistance layer that makes it difficult for gold to break higher. On the downside, the nearest support sits at 4,040–4,030 USD, where a green FVG and an old liquidity cluster previously triggered strong reactions.
The external backdrop doesn’t support gold either: the USD is recovering well following stronger-than-expected US economic data, the 10-year Treasury yield is holding around 4.1%, and US–EU equities continue rising thanks to Big Tech. Capital is moving away from safe-haven assets, leaving gold without much momentum to rebound in the short term.
Given all these signals, I lean toward one primary scenario: gold may pull back to retest the 4,040–4,030 USD zone in the coming sessions. If that area breaks cleanly, the next target would be 4,000 USD—a high-liquidity region that has produced strong bounces in the past. On the other hand, as long as 4,090 continues to reject price, gold is likely to remain in a tight 4,050–4,090 range rather than resume an immediate uptrend.
What do you think—will 4,040 hold this time, or will gold need to revisit 4,000 before finding new buying pressure?

Gold: Buyers Regain Control and Push the Trend FurtherHello everyone, the gold market is entering a fascinating phase — where each price swing seems to tell the story of buyers gradually reclaiming control. When placing the current technical structure alongside recent updates from Kitco News, one thing becomes clear: the probability of gold continuing higher in the coming sessions is stronger than any opposing signal.
During yesterday’s US session, gold held firmly above 4,100 USD/oz — a level that isn’t easy to sustain without meaningful underlying demand. What’s even more notable is that this happened while other markets were quiet because of the holiday mood. The ability of gold to stay resilient in such a muted environment suggests that accumulation is still flowing quietly beneath the surface.
This week, the market will face a series of key US data releases: Retail Sales, PPI, preliminary GDP, Jobless Claims, and PCE . Each of these is capable of acting as a fresh catalyst for gold — especially if US economic momentum cools or inflation continues to soften. That is precisely what the bullish side is hoping for.
At the same time, a report from El País hints that China may be purchasing more gold than what is officially disclosed. If true, this represents a persistent but hard-to-track source of demand — the kind of structural flow that can support a long-term uptrend even when surface-level sentiment wavers.
Technically, gold has broken out and closed firmly above the 4,080–4,100 FVG, with the Ichimoku cloud below forming a stable layer of support. The higher-low structure remains intact, signalling not just strength but control from the buyers. As a result, any pullback into support is likely to be accumulation rather than the start of a reversal.
Putting all these elements together, I lean toward a clear scenario: gold still has room to move higher. Price may first dip back to 4,100–4,080 to retest support before aiming for 4,200 — and if momentum cooperates, an extension toward 4,250, aligning with November’s high and a major technical barrier, is on the table.
With both news and technicals aligning convincingly, the bullish case remains my preferred outlook for now. What about you — what do you see on your chart?

XAGUSD H4 | Bullish RiseMomentum: Bullish
The price has reacted off the buy entry, which is a pullback support.
Buy entry: 50.84
Pullback support
Stop loss: 49.39
Pullback support
Take profit: 54.09
SWing high resistance
145% Fibonacci extension
High Risk Investment Warning
Stratos Markets Limited (tradu.com ), Stratos Europe Ltd (tradu.com ):
CFDs are complex instruments and come with a high risk of losing money rapidly due to leverage. 70% of retail investor accounts lose money when trading CFDs with this provider. You should consider whether you understand how CFDs work and whether you can afford to take the high risk of losing your money.
Stratos Global LLC (tradu.com ): Losses can exceed deposits.
Please be advised that the information presented on TradingView is provided to Tradu (‘Company’, ‘we’) by a third-party provider (‘TFA Global Pte Ltd’). Please be reminded that you are solely responsible for the trading decisions on your account. Any information and/or content is intended entirely for research, educational and informational purposes only and does not constitute investment or consultation advice or investment strategy. The information is not tailored to the investment needs of any specific person and therefore does not involve a consideration of any of the investment objectives, financial situation or needs of any viewer that may receive it. Past performance is not a reliable indicator of future results. Actual results may differ materially from those anticipated in forward-looking or past performance statements. We assume no liability as to the accuracy or completeness of any of the information and/or content provided herein and the Company cannot be held responsible for any omission, mistake nor for any loss or damage including without limitation to any loss of profit which may arise from reliance on any information supplied by TFA Global Pte Ltd.

Will SPX Make New All Time Highs? We dive into the recent technical setup of the S&P500.
We are on the verge of triggering a new massive bullish patterns.
The backdrop of soft commodities. soft yields, softer dollar and the December 10 rate cute.
We have the tailwinds in place for higher price.
I would like to see some sideways chop to make this rally more sustainable, but bull market bounces are very fierce especially when they come from failed bearish patterns.

GOLD → Psychological level retest before growth FX:XAUUSD breaks through consolidation resistance and renews its high to 4155. As part of a minor correction, a retest of 4100 may form and a battle for key support...
The probability of a Fed rate cut in December has risen to 81%. Fed members (Williams, Waller, Daly) supported the possibility of easing this year.
Progress in negotiations between the West and Ukraine with Russia reduces demand for defensive assets.
Gold remains sensitive to inflation and retail sales data. Strong figures could adjust rate expectations and limit growth, while weak data would support the bulls.
Technically, a retest of the 4110-4100 zone is forming. If the bulls hold their ground above this level, a new trading range of 4100-4150 could form.
Resistance levels: 4155, 4211
Support levels: 4111, 4100
The importance of the 4100 zone is that it is an area of imbalance and breakeven, a consolidation boundary, as well as a psychological level. Accordingly, the reaction to this area should be aggressive. If the reaction is weak, the price may be dragged below 4100. Otherwise, I expect consolidation above 4111 and further growth to 4155 (possibly to 4200).
Best regards, R. Linda!

Crude oil off earlier lows but pressure remainsCrude oil has bounced off its earlier lows, thanks to a risk-on session in the stock markets. But oil's underlying trend remains bearish. Earlier saw Brent sliding to just below the $61 level—its lowest point this week, before stalling.
Oil’s latest decline kicked off after reports suggested that Ukraine has agreed to the outline of a potential peace deal with Russia. Now, nothing is signed yet—there’s still a lot of negotiation left - but markets reacted immediately.
So why did oil prices fall? Well partly because peace in the Ukraine-Russia conflict could mean sanctions on Russia may eventually be eased, and that could bring more Russian supply back into a global oil market that’s already pretty well-supplied. More supply equals more downward pressure on prices.
From a technical perspective, the chart of oil tells you everything you need to know. As shown by the daily chart of Brent, crude oil continues to print lower lows and lower highs, which is classic downtrend behaviour.
The key level to watch right now is $61 per barrel, a major support zone. If Brent breaks below that, then $60 is potentially the next target, followed by $58.25, which was the low back in April.
Unless something changes fundamentally, we could easily see a continuation of the current downtrend in the days and weeks ahead.
By Fawad Razaqzada, market analyst with FOREX.com

Breaking: CETY Secures $10 Mln Battery Energy Storage ProjectClean Energy Technologies, Inc. (NASDAQ; NASDAQ:CETY ) has spike 80% gearing for a move to the $30 resistant if the stock should break through the 61.8% Fib retracement level.
The RSI is at 54, giving room for massive upside as buyers step in.
In another news, Clean Energy Technologies, Inc. (Nasdaq: CETY) today announced that it has secured a $10 million Battery Energy Storage System (BESS) project in New York State. This award represents the Company’s largest storage project to date and marks the first of several similar, either front of the meter or behind the meter, BESS deployments across New York State CETY expects to finalize in the months ahead.
The New York project includes the deployment of a 5MW / 20MWh standalone energy storage system, designed to support grid reliability, peak-shaving, and market participation under New York’s Value of Distributed Energy Resources (VDER) program and ancillary grid services markets. The site has the opportunity to increase energy storage capacity to the maximum 20MW/80MWh storage permitted for such locations, subject to grid interconnection availability.
About CETY
Clean Energy Technologies, Inc. designs, produces, and markets clean energy products and integrated solutions that focuses on energy efficiency and renewable energy in the United States and internationally. It operates through four segments: Clean Energy HRS & CETY Europe, CETY Renewables Waste to Energy Solutions, Engineering and Manufacturing Business, and CETY HK. The company offers Clean Cycle generator, which captures wasted heat energy and produce electricity.

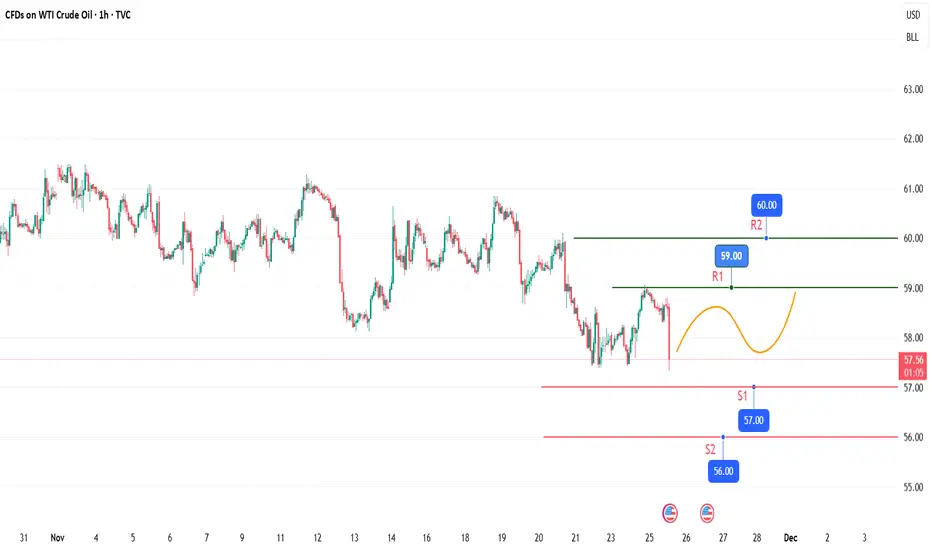
USOIL trades with a weak oscillatory biasUSOIL is exhibiting a weak oscillatory downward trend today. Despite a slight rebound yesterday, affected by bearish news and technical pressure, the intraday upside momentum remains insufficient, with bearish momentum gradually emerging. Overall, it shows a sluggish pattern of a quick pullback after the rebound.
For the upside, focus on the short-term resistance zone of $59.5 - $60.5 per barrel, among which $59.5 per barrel can be regarded as a key watershed. On the downside, closely monitor the support range of $57.0 - $57.5 per barrel. If this zone is effectively broken down, the price may further decline to around $56 per barrel.
Sell 59 - 59.7
SL 60.1
TP 57.5 - 57 - 56.5

Gold Setup: Breakout Levels MarkedGold is moving inside 4H symmetrical triangle and waiting for a proper breakout. Price is holding above the 4080-4120 and also above the rising trendline so the structure is still slightly bullish. If gold breaks above the upper trendline 4185 it can quickly move toward 4280 and then 4460. But if it breaks below the rising trendline 4060 and the support zone gold can fall toward 4000, 3900 and more to 3800.
Buy Setup
Buy Zone: 4080-4120 only if price shows support or a bounce
Breakout Buy: 4185 Above the upper black trendline
Targets: TP1 4280, TP2 4460, TP3 4555
Note
Please risk management in trading is a Key so use your money accordingly. If you like the idea then please like and boost. Thank you and Good Luck!

Gold Breakout and Potential RetraceHey Traders, in today's trading session we are monitoring XAUUSD for a buying opportunity around 4,080 zone, Gold was trading in a downtrend and successfully managed to break it out. Currently is in a correction phase in which it is approaching the retrace area at 4,080 support and resistance area.
Trade safe, Joe.

XAU/USD: Bullish Push to 4158?As the previous analysis worked exactly as predicted, FX:XAUUSD is eyeing a bullish push on the 1-hour chart , with price rebounding from a key support zone near cumulative sell liquidation, converging with a potential entry area that could ignite upside momentum if buyers defend against short-term dips. This setup suggests a reversal opportunity amid recent consolidation, targeting higher levels with strong risk-reward.
Entry between 4020-4032 for a long position🎯. Targets at 4158 (main). Set a stop loss at 3990 to limit exposure📊, yielding a risk-reward ratio of approximately 1:3 . Monitor for confirmation via a bullish candle close above entry with rising volume, leveraging gold's safe-haven appeal.🌟
Fundamentally , gold is attempting to stabilize above $4,000 after a sharp pullback, with early signs of a short-term rebound as markets digest fading Fed rate cut hopes and await key US data. Forecasts indicate an average of $3,675/oz by Q4 2025, but recent surges to $4,239 highlight volatility driven by ETF flows and central bank policies. 💡
📝 Trade Setup
🎯 Entry Zone (Long): 4020 – 4032
🎯 Target (TP1): 4158
❌ Stop Loss: 3990
⚖️ Risk-to-Reward: Approximately 1:3, offering a solid reward structure with defined downside.
What's your outlook on this setup? Drop your thoughts below! 👇

Gold analysisGold TVC:GOLD primary trend is still bullish despite the current reaction (-6%), with price at 4.144 $/Oz. Since the beginning of November Gold seem to be building a wedge around the 4.050 support area, while the volatility is lowering and momentum is neutral.
For the next few days we expect gold price to continue narrowing inside the 4.275 (resistance) - 4.050 (support) channel, remaining on the bull side for the long run.
If gold were to drop blow 4.050 then the next support area would be at 3.750 .

USOIL : LIVE TRADEHello friends
Given the bearish structure we had, the price has now been supported by buyers at the specified support several times and we can expect this support to continue.
Observe risk and capital management and avoid emotional and irrational behavior.
*Trade safely with us*

Gold H1 – Pre-NFP Liquidity Hunt as US–China Tone Warms🟡 XAUUSD – Intraday Smart Money Plan | by Ryan_TitanTrader (25/11)
📈 Market Context
Gold is approaching a key premium zone while markets react to fresh geopolitical headlines. Earlier today, Donald Trump confirmed he had a “very good call” with President Xi of China, highlighting strong bilateral relations and continued cooperation.
This matters for gold because:
• Warmer US–China relations often reduce geopolitical risk premiums, pressuring gold.
• The timing is critical: markets are entering NFP week, a period where institutions frequently engineer liquidity grabs.
• Traders may see a USD-supportive environment ahead of NFP, especially if risk sentiment stabilizes.
In short, gold is sitting in a zone where liquidity sweeps are highly probable before a larger move develops.
🔎 Technical Analysis (1H – SMC Structure)
• Market Structure
Price is climbing toward a major liquidity cluster around 4170–4172, aligning with previous equal highs and an unmitigated supply block.
Below, the FVG demand zone at 4102–4100 serves as today’s discount reaction zone.
• Premium Sell Zone (1H Supply)
4170 – 4172
• Buy-side liquidity sits above prior highs
• Clear premium zone relative to current swing structure
• Likely target for engineered sweep ahead of NFP volatility
• Discount Buy Zone (1H Demand)
4102 – 4100
• FVG imbalance + BOS origin
• Confluence with discount retracement levels
• Strong RR for bullish reaction after sell-side sweep
• Liquidity Map
• Buy-side: 4172 → 4180
• Sell-side: 4100 → 4092
Expect the classic SMC sequence:
Sweep → CHoCH → Displacement → Retest → Expansion.
🔴 Sell Setup – Premium Reaction
Entry: 4170 – 4172
Stop-Loss: 4180
Take-Profit:
→ 4138 (imbalance fill)
→ 4115 (mid-range liquidity)
→ 4102–4100 (discount zone retest)
📌 Must wait for liquidity sweep + bearish CHoCH on M5–M15.
🟢 Buy Setup – Discount Reaction
Entry: 4102 – 4100
Stop-Loss: 4092
Take-Profit:
→ 4135 (intraday reaction)
→ 4160 (premium edge)
→ 4170 (buy-side liquidity sweep)
📌 Valid only after sell-side liquidity is taken.
⚠️ Risk Management Notes
• Expect extra volatility as markets price in US–China optimism ahead of NFP.
• Liquidity traps are common during Asian/London sessions—wait for confirmation.
• Avoid taking positions inside the chop zone 4125–4150 without structure shifts.
• Treat both scenarios as liquidity plays, not trend continuation trades.
📝 Summary
Gold is approaching a major liquidity pocket as geopolitical sentiment improves following Trump’s positive call with President Xi.
With NFP approaching, institutions are likely to sweep liquidity above 4170 or below 4100 before establishing direction.
Key Levels Today
🔴 Sell Zone: 4170–4172
🟢 Buy Zone: 4102–4100
Prepare for the typical pre-NFP pattern:
Accumulation → Sweep → Displacement → Retest → Target.
📍 Follow @Ryan_TitanTrader for daily Smart Money updates.

Pre Open heads up on Gold. And overall draw. Bullish it isCOMEX:GC1!
Looking for higher prices on Gold. It should deliver towards the buyside and successive highs from here on. Need a CISD on the 4H timeframe

Gold 30-Min — Volume Sell Reversal Triggered⚡Base : Hanzo Trading Alpha Algorithm
The algorithm calculates volatility displacement vs liquidity recovery, identifying where probability meets imbalance.
It trades only where precision, volume, and manipulation intersect —only logic.
✈️ Technical Reasons
/ Direction — SHORT / Reversal 4134 Area
☄️Bearish rejection confirmed through sharp candle body.
☄️Lower-high forming beneath resistance supply region.
☄️Volume decreasing confirms exhaustion in price rally.
☄️Sellers regained imbalance with heavy top rejection.
☄️Algorithm detects fading demand and shift to control.
⚙️ Hanzo Alpha Trading Protocol
The Alpha Candle defines the day’s real control zone — the first battle of momentum.
From this origin, the Volume Window reveals where the next precision strike begins.
⚙️ Hanzo Volume Window / Map
Window tracked from 10:30 — mapping true market behavior.
POC alignment exposes institutional bias and breakout potential zones.
⚙️ Hanzo Delta Window / Pulse
Delta window monitors real buying vs. selling power behind each move.
Tracks volume aggression to expose who controls the candle — buyers or sellers.
When Delta aligns with Volume Map, momentum becomes undeniable.

Pre open Heads Up. Index NSYECME_MINI:NQ1!
Looking for bearish prices on the Index triads for this NYO while the overall thought process is bullish on the HTF

Gold (XAUUSD): Possible buy setupGold (XAUUSD): Possible buy setup. Here again, with another buy setup. Path is clear.
Cheers

Gold Momentum ShiftYesterday's gold momentum shifting towards downside. I'm bullish ahead of US open.
