XAU/USD Intraday Plan | Gold Under Pressure, 4,078 Remains KeyGold delivered choppy price action yesterday due to the news releases, with buyers failing to break above the 4078 resistance. The metal has now slipped lower and is currently testing the upper boundary of the Support Zone.
With price still holding below both the MA50 and MA200, the sellers maintain the short-term advantage, as these moving averages continue to act as dynamic resistance.
For buyers to step back in, we need to see a clean recovery above 4053 and then a confirmed break of the key 4078 level for buyers to attempt a move toward 4115.
If selling pressure remains, a full test of the Support Zone (4027-3996) is likely. A break below this area could trigger a deeper correction into the HTF Support Zone (3968-3921).
📌 Key levels to watch:
Resistance:
4053
4078
4115
Support:
4027
3996
3968
3921
🔎Fundamental focus:
A batch of U.S. data — including Flash PMI and Consumer Sentiment revisions — could bring volatility after yesterday’s choppy moves.
We also have political headlines and Fed speakers throughout the day, which may add intraday swings as markets react to fresh news.
Commodities

USOIL H4 | Bearish Drop OffMomentum: Bearish
The price is currently moving along a descending trendline and remains below the Ichimoku Cloud, indicating continued downside pressure.
Sell entry: 60.35
Pullback resitance
Stop loss: 61.42
Pullback resistance
Take profit: 58.21
High Risk Investment Warning
Stratos Markets Limited (tradu.com ), Stratos Europe Ltd (tradu.com ):
CFDs are complex instruments and come with a high risk of losing money rapidly due to leverage. 70% of retail investor accounts lose money when trading CFDs with this provider. You should consider whether you understand how CFDs work and whether you can afford to take the high risk of losing your money.
Stratos Global LLC (tradu.com ): Losses can exceed deposits.
Please be advised that the information presented on TradingView is provided to Tradu (‘Company’, ‘we’) by a third-party provider (‘TFA Global Pte Ltd’). Please be reminded that you are solely responsible for the trading decisions on your account. Any information and/or content is intended entirely for research, educational and informational purposes only and does not constitute investment or consultation advice or investment strategy. The information is not tailored to the investment needs of any specific person and therefore does not involve a consideration of any of the investment objectives, financial situation or needs of any viewer that may receive it. Past performance is not a reliable indicator of future results. Actual results may differ materially from those anticipated in forward-looking or past performance statements. We assume no liability as to the accuracy or completeness of any of the information and/or content provided herein and the Company cannot be held responsible for any omission, mistake nor for any loss or damage including without limitation to any loss of profit which may arise from reliance on any information supplied by TFA Global Pte Ltd.

XAGUSD H4 | Falling Towards 61.8% Fibonacci SupportMomentum: Bullish
Price action is currently retracing toward the buy entry level, which aligns with the 61.8% Fibonacci retracement, an area that often acts as a strong reaction zone.
Buy Entry: 48.75
Strong overlap support
61.8% Fibonacci retracement confluence
Stop Loss: 47.50
Pullback support
78.6% Fibonacci retracement
Take Profit: 51.00
Pullback resistance
High Risk Investment Warning
Stratos Markets Limited (tradu.com ), Stratos Europe Ltd (tradu.com ):
CFDs are complex instruments and come with a high risk of losing money rapidly due to leverage. 70% of retail investor accounts lose money when trading CFDs with this provider. You should consider whether you understand how CFDs work and whether you can afford to take the high risk of losing your money.
Stratos Global LLC (tradu.com ): Losses can exceed deposits.
Please be advised that the information presented on TradingView is provided to Tradu (‘Company’, ‘we’) by a third-party provider (‘TFA Global Pte Ltd’). Please be reminded that you are solely responsible for the trading decisions on your account. Any information and/or content is intended entirely for research, educational and informational purposes only and does not constitute investment or consultation advice or investment strategy. The information is not tailored to the investment needs of any specific person and therefore does not involve a consideration of any of the investment objectives, financial situation or needs of any viewer that may receive it. Past performance is not a reliable indicator of future results. Actual results may differ materially from those anticipated in forward-looking or past performance statements. We assume no liability as to the accuracy or completeness of any of the information and/or content provided herein and the Company cannot be held responsible for any omission, mistake nor for any loss or damage including without limitation to any loss of profit which may arise from reliance on any information supplied by TFA Global Pte Ltd.

SILVER H4 | Bearish Reversal Off 61.8% Fibonacci ResistanceMomentum: Bearish
The price has rejected the sell-entry level, which aligns with the 61.8% Fibonacci retracement, reinforcing the bearish bias.
Sell Entry: 52.170
Pullback resistance
61.8% Fibonacci retracement
Stop Loss: 54.04
Swing-high resistance
Take Profit: 49.47
Strong overlap support
High Risk Investment Warning
Stratos Markets Limited (tradu.com ), Stratos Europe Ltd (tradu.com ):
CFDs are complex instruments and come with a high risk of losing money rapidly due to leverage. 70% of retail investor accounts lose money when trading CFDs with this provider. You should consider whether you understand how CFDs work and whether you can afford to take the high risk of losing your money.
Stratos Global LLC (tradu.com ): Losses can exceed deposits.
Please be advised that the information presented on TradingView is provided to Tradu (‘Company’, ‘we’) by a third-party provider (‘TFA Global Pte Ltd’). Please be reminded that you are solely responsible for the trading decisions on your account. Any information and/or content is intended entirely for research, educational and informational purposes only and does not constitute investment or consultation advice or investment strategy. The information is not tailored to the investment needs of any specific person and therefore does not involve a consideration of any of the investment objectives, financial situation or needs of any viewer that may receive it. Past performance is not a reliable indicator of future results. Actual results may differ materially from those anticipated in forward-looking or past performance statements. We assume no liability as to the accuracy or completeness of any of the information and/or content provided herein and the Company cannot be held responsible for any omission, mistake nor for any loss or damage including without limitation to any loss of profit which may arise from reliance on any information supplied by TFA Global Pte Ltd.

Gold Weakening Inside Triangle – Bears Eye $3,950 SupportGold is currently consolidating inside a symmetrical triangle formation between 3972 support and 4025 resistance showing reduced volatility and awaiting breakout confirmation. The structure suggests indecision but with a slight bearish bias due to repeated lower highs.
Sell Zone: 3995-4020 (near upper triangle resistance and 0.382-0.5 fib region)
Stop Loss: Above 4046
TP1: 3950 TP2: 3915 TP 3: 3885
⚠️ Current bias: Neutral to bearish unless gold breaks and holds above 4025-4046 zone. Weak low near 3886 may attract liquidity if bearish pressure continues.
Note
Please risk management in trading is a Key so use your money accordingly. If you like the idea then please like and boost. Thank you and Good Luck!

Gold Under Pressure: Key Resistance Holds, More Downside LikelyGold is moving inside a descending channel showing clear bearish pressure. Price is struggling to hold above 4050-70 and repeated rejections from the upper trendline confirm sellers are still in control. A clean break below 4025 can open the way toward the deeper liquidity zones around 4010 and 3975. As long as price stays below the falling trendline the bias remains bearish and any small pullback toward 4075-90 will likely act as a selling opportunity. Only a strong breakout above 4100-20 would shift momentum back to buyers.
✅ Bias: Sell below 4060-85 resistance
Sell Zone : 4075–4090
Stop Loss : Above 4120
Take Profit : 4025 - 4010 - 3975
Note
Please risk management in trading is a Key so use your money accordingly. If you like the idea then please like and boost. Thank you and Good Luck!

Gold Price AnalysisGold maintained a wide range of fluctuations, with bulls and bears locked in a tug-of-war. The daily chart closed with a doji, with the price hovering around the middle Bollinger Band. The RSI indicator is close to the midline, and the 10-day and 7-day moving averages are converging. The Bollinger Bands on the 4-hour and hourly charts are gradually narrowing. Friday's intraday movement is expected to remain within a wide range, continuing to observe the price action within the 4040-4110 range. The trading strategy remains to sell high and low, focusing on short-term trading.
On the 1-hour chart, gold continues its weak and volatile movement. After last night's data release, it attempted to rise but ultimately failed to break through the 4110 level, encountering resistance and falling back. The short-term trend remains weak, with resistance still present above 4110. Intraday, any rebound encountering resistance at 4110 should be used as an opportunity to sell on rallies.
Key Levels:
First Support: 4062, Second Support: 4040, Third Support: 4016
First Resistance: 4100, Second Resistance: 4118, Third Resistance: 4141
Gold Intraday Trading Strategy:
BUY: 4040-4045, SL: 4030, TP: 4060-4070;
SELL: 4105-4110, SL: 4120, TP: 4090-4080;
More Analysis →

GOLD Will Go Lower From Resistance! Sell!
Please, check our technical outlook for GOLD.
Time Frame: 1h
Current Trend: Bearish
Sentiment: Overbought (based on 7-period RSI)
Forecast: Bearish
The market is trading around a solid horizontal structure 4,030.36.
The above observations make me that the market will inevitably achieve 4,000.32 level.
P.S
The term oversold refers to a condition where an asset has traded lower in price and has the potential for a price bounce.
Overbought refers to market scenarios where the instrument is traded considerably higher than its fair value. Overvaluation is caused by market sentiments when there is positive news.
Like and subscribe and comment my ideas if you enjoy them!

Gold at Make-or-Break Level – High-Probability Short Setup LoadiGold is still trading inside a corrective structure after forming a clear lower low and then consolidating. Price has tapped the mid range zone and is now reacting from a short term supply area. As long as gold stays below 4130–4145 the bearish structure remains intact and the downside continuation toward 4025 → 4000 → 3950 remains the primary expectation. A short setup becomes active once price gives rejection or a small BOS from the current supply zone. The trade becomes invalid if gold breaks and closes above 4150 which would shift structure and open the way for a deeper pullback toward 4175–4200.
Sell Zone : 4130 - 4145
Invalidation : Break & close above 4150
Targets: 4075 → 4025 → 4000 → 3950
Note
Please risk management in trading is a Key so use your money accordingly. If you like the idea then please like and boost. Thank you and Good Luck!

GOLD → Waiting for NFP... High importance level!FX:XAUUSD is stagnating ahead of the news. The market is in a phase of uncertainty, with long shadows and short candlestick bodies. The key factor will be the US employment data for September.
We have not seen unemployment data for more than seven weeks, which makes this data highly significant. Complete uncertainty. Significant deviations from forecasts could significantly change expectations for Fed rates. The probability of a Fed rate cut in December fell to 33% after the publication of the minutes, in which the regulator expressed concerns about inflation.
The market expects 50K jobs to be created in September, compared to 22K in August.
The unemployment rate is forecast at 4.3%, with wage growth at 3.7% year-on-year.
The further dynamics of gold depend on the NFP data. Weaker indicators may reinforce expectations of Fed policy easing and support price growth, while strong data will put pressure on the metal
Resistance levels: 4082 - 4111
Support levels: 4040, 4006
In the current circumstances, having only one scenario means narrowing your view of the situation as much as possible. The market can be aggressive on news. Weak data could lock the price within the current range (trading between graces). However, a breakout of resistance at 4082 - 4111 and a close above this level could trigger growth. Otherwise, a breakdown and consolidation below 4040 could break the current bullish trend and trigger a sell-off to 3930 (especially against the backdrop of the Fed's weak but hawkish stance).
Best regards, R. Linda!

CRUDE OIL (WTI): Bullish Move After Trap
There is a high chance that Crude Oil will pull back
from the underlined daily key level.
I see a confirmed bear trap followed by a bullish imbalance
candle on an hourly.
I expect a rise at least to 58.51 level.
❤️Please, support my work with like, thank you!❤️
I am part of Trade Nation's Influencer program and receive a monthly fee for using their TradingView charts in my analysis.

MARKET REMAINS RANGE-BOUND; WHAT ARE THE OPPORTUNITIES TODAY?1. Market Context
Gold continued to trade in a cautious manner yesterday as the market digested the hawkish FOMC minutes.
Despite safe-haven buying at the lower levels, the upper resistance zones remained firm, keeping the price within a well-defined range.
Buying interest remains strong around 4010–4000.
Sellers are consistently defending the 4130–4133 resistance region.
The 4080–4085 area acts as a key equilibrium zone — holding leads to sideways movement, while a breakout may trigger a directional move.
With no major data releases scheduled, gold is expected to continue its range-bound behaviour throughout the session.
2. BUY Zones
🎯 Primary BUY Levels:
4010
3998
🎯 Extended BUY Range:
4010 – 4015
4035 – 4040
→ These support regions have held firmly in recent sessions and are suitable for intraday pullback entries.
3. SELL Zones
🔥 Primary SELL Levels:
4130 – 4133
🔥 Extended SELL Range:
4148 – 4150
→ These areas align with strong overhead resistance and have shown reliable reaction points.
4. Key Level to Monitor (Trend Trigger)
📌 4080 – 4085 (Fibo 0.5 – 0.618)
A decisive break above 4085 may shift intraday sentiment towards bullishness → BUY setups become favourable.
If 4085 holds, the market is likely to sustain its range-bound movement → continue BUY at support and SELL at resistance.
5. Suggested Trading Approach
Trading style: SL 10 points – TP 10 points
Prefer BUY near strong support; SELL only at established resistance
Avoid entering trades in the mid-range (high noise, low conviction)
Execute trades only when the price tests pre-defined zones
If 4085 breaks with momentum → switch to a trend-following approach
⭐ Quick Summary
BUY: 3998 / 4010 / 4010–4015 / 4035–4040
SELL: 4130–4133 / 4148–4150
Key Zone: 4085 — breakthrough → BUY bias
Setup: SL 10 points – TP 10 points

Stop!Loss|Market View: USDJPY🙌 Stop!Loss team welcomes you❗️
In this post, we're going to talk about the near-term outlook for the USDJPY currency pair☝️
Potential trade setup:
🔔Entry level: 157.430
💰TP: 158.787
⛔️SL: 156.758
"Market View" - a brief analysis of trading instruments, covering the most important aspects of the FOREX market.
👇 In the comments 👇 you can type the trading instrument you'd like to analyze, and we'll talk about it in our next posts.
💬 Description: Despite significant strengthening against the yen and an open gap, the USDJPY currency pair maintains short-term buying priority towards the 159 level. The most reliable entry point is considered a false breakout of the lower boundary of the current accumulation near resistance at 157.730. However, a potential buy entry above the lower boundary of the accumulation can be considered if the price moves sharply higher.
Thanks for your support 🚀
Profits for all ✅

Stop!Loss|Market View: BITCOIN🙌 Stop!Loss team welcomes you❗️
In this post, we're going to talk about the near-term outlook for the BITCOIN ☝️
Potential trade setup:
🔔Entry level: 89416.67
💰TP: 80581.26
⛔️SL: 93834.38
"Market View" - a brief analysis of trading instruments, covering the most important aspects of the FOREX market.
👇 In the comments 👇 you can type the trading instrument you'd like to analyze, and we'll talk about it in our next posts.
💬 Description: Short- and medium-term prospects for the coin remain in favor of the seller, but no significant long-term risks for Bitcoin are currently visible. The 50,000-70,000 range could potentially be considered for investing in Bitcoin. Today, a potential short-term sell is being considered near the 88,000 level, where there is a limit seller accumulation (CME futures). The 78,000-80,000 area is being looked for as a target.
Thanks for your support 🚀
Profits for all ✅

I will be going long on gold after the market opens.Are youreadyGold prices remained relatively stable this week, offering traders some room for maneuver. This week, after reaching a high of 4132, gold prices fluctuated between 4000 and 4110, showing greater stability compared to the previous volatile market. This provided favorable conditions for implementing trading strategies, and several short-selling operations during this period also achieved the expected results.
From a weekly chart perspective, the chart shows a doji pattern, indicating that the forces of bulls and bears are relatively balanced in the short term, lacking a clear one-sided trend, suggesting that investors are generally cautious. Historical data shows that Fridays are often prone to price fluctuations, so it is necessary to remain vigilant about risk management. Looking at the hourly chart, prices have entered a key support/resistance zone, currently trading near the Bollinger Band's middle line. If it can effectively hold this position, it is expected to retest the resistance levels of $4090 and $4100. In terms of trading strategy, it is recommended to place long orders in batches within the 4050 to 4070 range after the market opens, and closely monitor market dynamics. If there are any further changes, we will promptly notify you of any adjustments to the plan.
The above are my personal thoughts! If they are helpful to you or you agree with my ideas, please like and follow to support me! All strategies have a limited lifespan, so while referring to them, you should also closely monitor market changes. I will also respond flexibly according to actual market fluctuations, and I will announce the specifics in the channel!

XAUUSD–FRIDAY BEFORE PMI: MAINTAINING HEAD AND SHOULDERS PATTERN💛 XAUUSD – FRIDAY BEFORE PMI: MAINTAINING HEAD AND SHOULDERS PATTERN, WAITING TO BREAK RANGE 4132–3998 🎯
🌤 1. Overview
Hello everyone, it's Lana here again 💬
Today is the last Friday of the week, the market is waiting for PMI and preparing to enter a phase with a lot of important data in December.
Meanwhile, BTC has been rising faster than XAU in recent weeks, indicating that speculative money is leaning towards crypto, while gold is temporarily moving sideways accumulating.
The US Department of Labor will release the November employment report on December 16, which is 6 days after the December Fed meeting. In other words, the Fed is in a "blackout" state regarding labor data for nearly another month – this forces the market to price in advance, making gold's volatility range wide but lacking a clear trend.
💹 2. Technical Analysis – Range & Head and Shoulders Pattern
On the H3/H4 frame, gold is fluctuating within the large range of 4132 – 3998.
The price wave is gradually narrowing towards the end of the triangle, represented by:
Lower highs,
Higher lows,
→ When one of the two boundaries is broken, a new trend is likely to explode in the direction of the breakout.
The inverse Head – Shoulders – Head pattern has not been broken:
Left shoulder – Head – Right shoulder are all above the rising trendline.
For the final wave of the pattern to follow the rhythm, the price needs to confirm surpassing 4109:
When closing a candle above 4109, the short-term uptrend is confirmed,
At that point, gold can aim for higher liquidity areas such as 4132 → 4145 → 4200.
Conversely, if gold breaks 3998, this will be both:
breaking the range bottom,
and negating the Head and Shoulders pattern,
→ opening the possibility of a deeper decline to the 3960–3920 area.
🎯 3. Reference Trading Scenarios
💖 BUY Scenario – following the pattern & range bottom support
1️⃣ Buy at support 3998–4000
Entry: 3998–4000
SL: below 3990 (depending on risk management)
TP: 4025 → 4040 → 4078
2️⃣ Buy when confirmed above 4109
Condition: Price closes a candle above 4109, confirming the Head and Shoulders pattern is maintained.
Entry: around 4100–4105
SL: 4090
TP: 4132 → 4145 → 4200
💢 SELL Scenario – trading the upper boundary of the range
Sell: 4130–4132
SL: 4138
TP: 4110 → 4095 → 4070 → 4045
Selling should only be considered as scalping against resistance within the range, not the main trend if the Head and Shoulders pattern is still valid.
⚠️ 4. Notes & Risk Management
Range 4132–3998 is still controlling the market:
Above 4109 → prioritize Buy according to the short-term uptrend.
Below 3998 → consider shifting bias to Sell following the breakout.
PMI, Fed expectations, and upcoming employment data may trigger unexpected volatility, therefore:
🌷Gold is at the intersection of technical patterns and macro stories 💛
Be patient and wait for reactions at 3998 and 4109, as these are the two key points that determine whether we enter a new upward wave or a deeper decline.
💛 Like – 💬 Comment – 🔔 Follow LanaM2 to follow gold with me every day ✨

Gold Slides Sharply as Markets React to Fed Signals and AI RallyHello everyone, looking at XAU/USD on the 4H timeframe today, I can clearly feel that gold has just gone through a very “textbook” correction after major news. From the 4,130 USD peak, price dropped quickly to 4,079 USD, losing more than 50 USD in a single session. At the moment, gold is trading around 4,090 USD, sitting below the Ichimoku cloud and having just filled part of the FVG around 4,100 — showing that sellers are still in control.
Technically, gold failed to break through the 4,130–4,150 USD resistance cluster. Last night’s sharp drop broke below the short-term support at 4,100, triggering a wave of profit-taking from earlier long positions. Now, the area at 4,070–4,050 USD is the nearest support and the level gold must defend to avoid a deeper decline towards 4,020–4,000 USD. Conversely, to return to an upward move, gold needs to reclaim 4,110 decisively — otherwise any rebound will likely be temporary.
Fundamentally, the market was moved just as much by news as by technicals. The FOMC minutes showed the Fed is still divided: one side worried about weakening labour data, the other insisting inflation hasn’t behaved consistently. This dampened expectations for an early rate cut, strengthening the USD, pushing DXY above 104 — and immediately weighing on gold. At the same time, Nvidia’s blowout earnings sent US equities sharply higher as money rotated into AI stocks, reducing gold’s appeal during a “risk-on” wave.
In this context, I see this as a healthy correction within a broader uptrend — not a reversal. Based on the way price is reacting, gold will likely retest 4,070–4,050 USD before attempting a rebound. If buyers return at that zone, price may recover toward 4,110–4,130 USD, especially if the USD pauses. If 4,050 breaks, gold may drop deeper to 4,020–4,000 USD to attract liquidity.

The Gold Bullish Setup You Can't Afford to Miss!OANDA:XAUUSD The price is currently showing clear signs that it’s approaching a significant support zone, an area where the market has previously reacted positively. This zone is also near the psychological threshold of $4,000, a level that generally attracts considerable attention in the market.
The momentum from this zone suggests that buyers could step in and push the price higher. A positive confirmation, such as a strong rejection pattern, a bullish engulfing candle, or a long lower shadow, would increase the likelihood of a rebound from this level. If my prediction is
correct and buyers regain control, the price could reach $4,070.
However, a break below this support level would invalidate the bullish outlook and could lead to a deeper price decline.
This is not financial advice!

GOLD FREE SIGNAL|LONG|
✅GOLD respected the local demand after sweeping sell-side liquidity, showing bullish displacement. With short-term order flow shifting upward, price may aim for the buy-side liquidity resting at the higher supply zone.
—————————
Entry:4,071$
Stop Loss: 4,030$
Take Profit: 4,135$
Time Frame: 2H
—————————
LONG🚀
✅Like and subscribe to never miss a new idea!✅

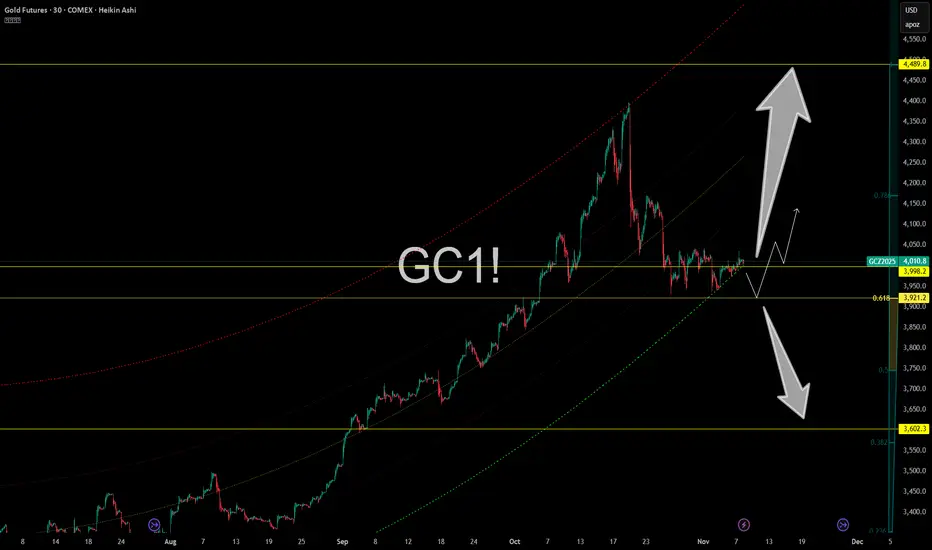
Gold Futures – Compression Before Explosion?Gold (GC1!) is coiling tightly just above the $3,998 level, teasing a big move as it hugs the 0.618 fib zone at $3,921. It’s the definition of compression — and when gold coils like this, something always gives.
📍 Key levels on the radar:
$3,998 – Current pressure zone
$3,921 – Fib support + breakout base
$3,602 – Worst-case flush if demand fails
$4,489 – Fibonacci extension target if this rips
We’ve got an ascending pitchfork, clean market structure, and a massive range breakout setup. These kinds of patterns don’t sit idle for long.
Gold remains a beast in uncertain macro conditions — don’t underestimate what happens when fear, rates, and inflation mix.
Trading Wisdom 📜
The bigger the coil, the nastier the move. Don’t focus on direction — focus on readiness. Gold pays those who stay patient and deadly.
Disclaimer: What you read here is not financial advice — it’s high-level market philosophy from the FXPROFESSOR himself. Risk is real, and your capital is your responsibility. Learn, adapt, evolve.
One Love,
The FXPROFESSOR 💙
GOLD Local Long! Buy!
Hello,Traders!
GOLD bounced from the horizontal demand after sweeping sell-side liquidity. Bullish displacement confirms a shift in order flow, suggesting price may continue toward the buy-side liquidity resting at the marked target level.Time Frame 5H.
Sell!
Comment and subscribe to help us grow!
Check out other forecasts below too!
Disclosure: I am part of Trade Nation's Influencer program and receive a monthly fee for using their TradingView charts in my analysis.

GOLD 4H CHART ROUTE MAP UPDATE & TRADING PLAN FOR THE WEEKHey Everyone,
Please see our updated 4h chart levels and targets for the coming week.
We are seeing price play between two weighted levels with a gap above at 4124 and a gap below at 4042. We will need to see ema5 cross and lock on either weighted level to determine the next range.
We will see levels tested side by side until one of the weighted levels break and lock to confirm direction for the next range.
We will keep the above in mind when taking buys from dips. Our updated levels and weighted levels will allow us to track the movement down and then catch bounces up.
We will continue to buy dips using our support levels taking 20 to 40 pips. As stated before each of our level structures give 20 to 40 pip bounces, which is enough for a nice entry and exit. If you back test the levels we shared every week for the past 24 months, you can see how effectively they were used to trade with or against short/mid term swings and trends.
The swing range give bigger bounces then our weighted levels that's the difference between weighted levels and swing ranges.
BULLISH TARGET
4124
EMA5 CROSS AND LOCK ABOVE 4124 WILL OPEN THE FOLLOWING BULLISH TARGETS
4212
EMA5 CROSS AND LOCK ABOVE 4212 WILL OPEN THE FOLLOWING BULLISH TARGET
4328
EMA5 CROSS AND LOCK ABOVE 4328 WILL OPEN THE FOLLOWING BULLISH TARGET
4422
EMA5 CROSS AND LOCK ABOVE 4422 WILL OPEN THE FOLLOWING BULLISH TARGET
4422
EMA5 CROSS AND LOCK ABOVE 4422 WILL OPEN THE FOLLOWING BULLISH TARGET
4494
BEARISH TARGETS
4042
EMA5 CROSS AND LOCK BELOW 4042WILL OPEN THE FOLLOWING BEARISH TARGET
3964
EMA5 CROSS AND LOCK BELOW 3964 WILL OPEN THE FOLLOWING BEARISH TARGET
3873
EMA5 CROSS AND LOCK BELOW 3873 WILL OPEN THE SWING RANGE
3767
3646
As always, we will keep you all updated with regular updates throughout the week and how we manage the active ideas and setups. Thank you all for your likes, comments and follows, we really appreciate it!
Mr Gold
GoldViewFX

Gold (XAUUSD): Possible buy setupGold (XAUUSD): Possible buy setup. I am seeing a nice possible setup for gold. Wait for a break and retest.
Cheers
