Stop!Loss|Market View: EURUSD🙌 Stop!Loss team welcomes you❗️
In this post, we're going to talk about the near-term outlook for the EURUSD currency pair☝️
Potential trade setup:
🔔Entry level: 1.15351
💰TP: 1.14184
⛔️SL: 1.15903
"Market View" - a brief analysis of trading instruments, covering the most important aspects of the FOREX market.
👇 In the comments 👇 you can type the trading instrument you'd like to analyze, and we'll talk about it in our next posts.
💬 Description: The main scenario for selling via a breakout of the 1.15500 - 1.16000 support area remains. The USD is gaining momentum and is likely to continue strengthening in the medium term. Against this backdrop, a shorter-term sell-off is being looked for. The lows from early this week serving as a potential sell entry point. Downside targets are considered as low as 1.14000.
Thanks for your support 🚀
Profits for all ✅
Commodities

GOLD MARKET ANALYSIS AND COMMENTARY - [Nov 17 - Nov 21]Last week, OANDA:XAUUSD prices rose from $3,999/oz to $4,245/oz, but then fell sharply to $4,032/oz and closed the week at $4,084/oz.
The reason gold prices rose sharply last week after news of the US government reopening was because White House press secretary Karoline Leavitt said the Bureau of Labor Statistics (BLS) may never release October employment and inflation data because the federal government was shut down during this period, not doing statistical work. These comments put the USD under selling pressure, pushing gold prices above $4,200/oz.
However, hawkish comments from Fed officials later pushed gold prices down sharply to $4,032/oz. Specifically, St. Louis Fed Governor Alberto Musalem said that the labor market is expected to remain at near full employment and the Fed needs to be cautious in operating monetary policy at this time. Meanwhile, Minneapolis Fed Governor Neel Kashkari emphasized that inflation is still too high, meaning the Fed should pause interest rate cuts.
The sharp decline in market expectations of a Fed rate cut in December may continue to have a negative impact on gold prices in the short term. However, gold prices will hardly fall sharply as macro risks and geopolitical conflicts persist and central banks’ demand for gold continues to increase.
📌According to technical analysis, the support level for gold prices next week is at 3,930 USD/oz. If it holds above this level, gold prices will continue to hover around 4,000 USD/oz in the short term. However, if gold prices fall below this level next week, they may fall to the 3,800 USD/oz area.
SELL XAUUSD PRICE 4176 - 4174⚡️
↠↠ Stop Loss 4180
BUY XAUUSD PRICE 3949 - 3951⚡️
↠↠ Stop Loss 3945

GOLD H1 – Will Retail Sales Trigger Gold’s Next Big Move?🟡 XAUUSD – Intraday Smart Money Plan | by Ryan_TitanTrader (17/11)
📈 Market Context
Gold is trading inside a corrective phase as markets anticipate today’s U.S. Retail Sales data and several Fed speeches — both crucial for assessing whether inflation momentum is slowing or rebounding.
• Weak retail numbers may hint at cooling consumer strength, supporting safe-haven bids in gold.
• Strong data could revive USD demand, prompting sell-side setups from premium zones.
Institutional flows show engineered pushes into inefficiency before a directional leg unfolds.
🔎 Technical Analysis (1H / SMC Structure)
• Structure: Gold is forming a short-term accumulation at the discount range after consecutive bearish candles and a deep liquidity sweep below 4030.
• FVG Sell Zone: 4140–4138 aligns with an unmitigated FVG + internal liquidity — ideal for sell-side reactions.
• Discount Zone: 4008–4010 is the last clean demand zone + sweep area, matching the chart’s projected bullish inducement.
• Liquidity:
→ Buy-side liquidity rests above 4140.
→ Sell-side liquidity remains exposed near 4000–3995.
🔴 Sell Setup (Premium Reaction Zone)
• Entry: 4,140 – 4,138
• Stop-Loss: 4,150
• Take-Profit Targets:
→ 4,095 (intra-day imbalance fill)
→ 4,060 (previous BOS block)
→ 4,010 (discount accumulation area)
📌 Trade only after a liquidity sweep into FVG + bearish BOS on M5–M15.
🟢 Buy Setup (Discount Reaction Zone)
• Entry: 4,010 – 4,008
• Stop-Loss: 4,000
• Take-Profit Targets:
→ 4,060 (short-term structure high)
→ 4,095 (mid-range inefficiency)
→ 4,138 (final premium reaction zone)
📌 Valid if price sweeps 4008 and shows bullish BOS + displacement.
⚠️ Risk Management Notes
• Expect volatility during the U.S. Retail Sales release.
• Avoid chasing price inside the 4060–4100 chop region.
• Lock profits at each liquidity level and trail stops.
• Keep total risk under 1–2% per setup.
📝 Summary
Gold remains in a engineered pullback phase with clear liquidity pockets at both extremes.
• Sell Zone: 4140–4138 (FVG / premium reaction zone)
• Buy Zone: 4008–4010 (discount accumulation zone)
A clean manipulation–reaction–continuation pattern is likely before the next intraday move.
📍 Follow @Ryan_TitanTrader for more Smart Money updates ⚡
Check out my TradingView profile for special gifts 🎁

GOLD DAILY TRADING 11/17: BUY TODAY🦁 THE GOLDEN ARENA – NOV 17, 2025
“Rebound or Trap? Let the Orderflow Decide.”
A visually striking TradingView plan – part narrative, part tactical map. This is not just a bias, it’s a battlefield strategy.
🧭 MARKET CONTEXT SNAPSHOT
Price currently consolidating around 4076 – 4084, after clean breaks of structure (BOS) and a deep retracement.
Significant supply zones confirmed at 4157 – 4180, where POC clusters, FVG imbalances, and volume absorptions align.
Orderflow on M5–M30 shows fading buy pressure and aggressive sells into lower highs.
🎯 CORE STRATEGIES FOR TODAY
🔺 Scenario 1: Breakout Trap SELL (High Conviction)
Target Zone 4178 – 4180 (Main Supply)
Stop Loss (SL) 4185
Take Profit 1 (TP1) 4155 (Low volume node)
Take Profit 2 (TP2) 4100 (Local support)
Take Profit 3 (TP3) 4040 (Structural SSL level)
🔍 Why this setup?
Clear liquidity pool above 4178 being targeted.
Volume tapering off into the move → classic reversal signal.
Footprint shows absorption candles at key supply.
🪙 Scenario 2: FVG Scalping SELL (Secondary)
Entry Zone 4157 – 4158
SL 4163
TP 4100 – 4105
✅ Perfect for short-term scalpers looking to ride the intraday rejection from the imbalance zone.
🟢 Bullish Reversal INVALIDATION (Failsafe Plan)
Trigger Break and hold above 4185
Entry Breakout Buy above 4190
SL 4175
TP 4220
Only flip bullish if aggressive buyers step in + strong delta + profile breakout.
🧱 KEY PRICE ZONES TO MONITOR
Level Description
4185 Stopline – invalidates Sell
4178 – 4180 Main SELL Zone (POC + FVG)
4157 – 4158 Minor FVG Scalping Area
4100 Micro support + Bull trap
4040 SSL – liquidity target
📊 VOLUME & ORDERFLOW INSIGHT
M5–M30 Footprints:
Massive seller imbalances from 4175+
Footprint at 4084 shows buyer exhaustion
Volume Profile:
High-volume node at 4178 acting as strong resistance
Low-volume gap below 4155 → fast price travel zone
Delta:
Negative delta buildup confirming sell bias
💡 EXECUTION CHECKLIST
✅ Wait for entry trigger at marked zones – don’t pre-empt.
🚫 Avoid FOMO buy into supply unless 4185 is cleanly broken.
🔔 Set alerts at 4157 and 4180 for rejection signs.
🧠 TRADING MANTRA OF THE DAY
"The chart speaks in structure,
The volume whispers the truth,
But the orderflow shouts the conviction."
📌 Bias: SELL on retracements toward supply → hold for 4100–4040
📌 Watchlist: Footprint aggression, absorption blocks, spoof traps

Looking for the Sweep leading into a bigger Play! Price bled lower through the entire Asian session after yesterday’s late breakdown, continuing the move away from the prior value area. We’re now trading inside a cluster of intraday inefficiencies with clean liquidity sitting below at 4013 and the psychological 4000 level.
My focus going into London and NY is patience.
Asia’s slow descent is typically a continuation phase, not the actual entry. I want to see:
A sweep of 4013 or 4000
A clear displacement reaction
A retrace back into a fresh M5–M15 FVG
Then structure confirming continuation or reversal
Until that happens, this remains a bearish environment with untested Weekly imbalance still below. If buyers don’t defend 4013 with force, the algo will likely reach for the 4000 liquidity pocket next.
Staying reactive, not predictive.
London will reveal whether this breakdown continues or sets the trap for a reversal.

GOLD Bearish Pennant! Sell!
Hello,Traders!
GOLD bearish pennant has already broken down, confirming displacement and shifting orderflow bearish. Price is now likely to target the next liquidity pocket below. Time Frame 5H.
Sell!
Comment and subscribe to help us grow!
Check out other forecasts below too!
Disclosure: I am part of Trade Nation's Influencer program and receive a monthly fee for using their TradingView charts in my analysis.

Fear & Greed Index — Rebuilt as a Macro Oscillator for CryptoThe Fear & Greed Index is everywhere — a popular way to gauge market sentiment.
But it's usually just a mix of volatility, momentum, and social buzz...
📉 Not exactly macro.
This script is a technical reinterpretation of the Fear & Greed concept — but grounded in real, measurable economic behavior .
🧠 The Core Idea
This indicator is powered by the Copper/Gold ratio , a time-tested signal used by economists and institutional traders to track macroeconomic cycles:
- 🟢 When Copper outperforms → the economy is likely expanding → risk-on → Greed
- 🔴 When Gold outperforms → the economy may be contracting → risk-off → Fear
Copper represents industrial growth , while Gold signals defensive capital flows .
We track this ratio over time using a Z-Score oscillator to identify when sentiment is statistically stretched in either direction — highlighting moments of macro-level greed or fear.
📊 Why It Matters for Crypto
Crypto doesn’t live in a vacuum.
It's highly sensitive to the broader risk environment.
This oscillator gives you a macro lens to help:
- Anticipate bullish or bearish shifts in crypto markets
- Avoid common emotional traps at sentiment extremes
- Build entries or exits around macro confluence zones
It doesn’t tell you when to buy or sell — it tells you when the market context is shifting .
🔧 How to Use It
- Watch for the Z-Score entering > +2 (Greed) or < -2 (Fear)
- Use it to confirm broader risk-on/off behavior
- Combine with BTC or ETH price for potential lead/lag relationships
- Customize the tickers to test other macro pairs (e.g. SPX/VIX, BTC/DXY)
📈 Built with Pine Script v6
🔍 Default Tickers: CAPITALCOM:COPPER vs TVC:GOLD
📦 Fully customizable inputs, clean visual design, alert-ready
💡 Use this to trade with context — not emotion.
If you found this useful, give it a like and drop your feedback or improvements below 👇

Gold Near Channel Support – Bulls Preparing for Another Leg Up?Gold ( OANDA:XAUUSD ) is approaching the Support zone($4,193 – $4,137) and the lower line of the ascending channel .
In terms of Elliott Wave theory , it looks like Gold is completing the main wave 4 .
I expect Gold increase from the Support zone($4,193 – $4,137) to Potential Reversal Zone(PRZ) and Resistance zone($4,316 – $4,270) .
First Target: $4,253
Second Target: $4,297
Stop Loss(SL): $4,133
Please respect each other's ideas and express them politely if you agree or disagree.
Gold Analyze (XAUUSD), 1-hour time frame.
Be sure to follow the updated ideas.
Do not forget to put a Stop loss for your positions (For every position you want to open).
Please follow your strategy; this is just my idea, and I will gladly see your ideas in this post.
Please do not forget the ✅ ' like ' ✅ button 🙏😊 & Share it with your friends; thanks, and Trade safe.

Gold 30-Min — Volume Sell Reversal Triggered⚡Base : Hanzo Trading Alpha Algorithm
The algorithm calculates volatility displacement vs liquidity recovery, identifying where probability meets imbalance.
It trades only where precision, volume, and manipulation intersect —only logic.
✈️ Technical Reasons
/ Direction — SHORT / Reversal 4090 Area
☄️Bearish rejection confirmed through sharp candle body.
☄️Lower-high forming beneath resistance supply region.
☄️Volume decreasing confirms exhaustion in price rally.
☄️Sellers regained imbalance with heavy top rejection.
☄️Algorithm detects fading demand and shift to control.
⚙️ Hanzo Alpha Trading Protocol
The Alpha Candle defines the day’s real control zone — the first battle of momentum.
From this origin, the Volume Window reveals where the next precision strike begins.
⚙️ Hanzo Volume Window / Map
Window tracked from 10:30 — mapping true market behavior.
POC alignment exposes institutional bias and breakout potential zones.
⚙️ Hanzo Delta Window / Pulse
Delta window monitors real buying vs. selling power behind each move.
Tracks volume aggression to expose who controls the candle — buyers or sellers.
When Delta aligns with Volume Map, momentum becomes undeniable.

GOLD BEARISH BREAKOUT|SHORT|
✅ XAUUSD broke cleanly below the 4H supply after taking buy-side liquidity. With displacement confirming bearish order flow, price is expected to target the sell-side liquidity pool near the marked zone. Time Frame 4H.
LONG🚀
✅Like and subscribe to never miss a new idea!✅

GOLD → Consolidation while awaiting the driverFX:XAUUSD is consolidating after a sharp decline. Bulls are consolidating above 4050. Important US data is ahead, including the employment report (NFP) on Thursday.
Decrease in bets on Fed easing: The probability of a cut in December has fallen to 46% (from 67% a week ago) after cautious statements by Fed officials. However, we have not yet seen inflation and employment data, so the situation may change... The September NFP report will be released on Thursday after a 43-day hiatus.
The market is waiting for clarity from the US data. Weak indicators (NFP, inflation) could bring back interest in gold, while strong data would strengthen the dollar and reinforce the correction.
Gold is in the $4030–4100 range. A break above $4100 will require weak US data or unexpectedly dovish rhetoric from the Fed. The $4030–4045 level is key support.
Resistance levels: 4097, 4110
Support levels: 4071, 4046, 4032
I think the market may remain in the current range while awaiting economic data or other drivers. A correction to support may form from resistance. It is important to monitor the levels from below; if the bulls keep the price above support during the correction, gold will be able to strengthen...
Best regards, R. Linda!

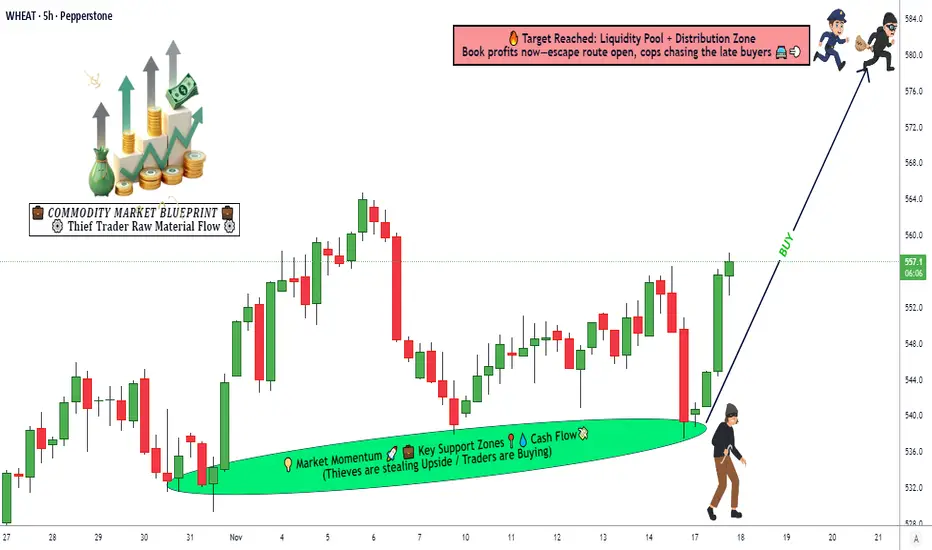
Wheat CFD Upside Setup: Tracking Momentum Toward 580📈 WHEAT COMMODITY CFD – Swing Trade Opportunity (Bullish Outlook)
🔹 Market Bias: Bullish
Wheat is showing supportive strength on higher-timeframe structure, with momentum building for the next upside leg.
🔹 Entry Zone
You may take any suitable price level entry based on your strategy, risk model, and timing confirmation.
🛡️ Risk Management (Stop Loss)
Thief SL: 540.0
Dear Ladies & Gentlemen (Thief OG’s), this is only a reference level.
Adjust your stop loss according to your personal strategy, volatility tolerance, and risk exposure.
Note: I am not recommending you use only my SL. Your money, your rules, your risk.
🎯 Profit Booking (Target)
Police barricade zone is acting as a strong resistance area with signs of overbought pressure + trap behaviour, so take profits wisely.
Our Target: 580.0
Note: I am not recommending you use only my TP. Book profits at levels that match your trading plan and risk appetite.
🔍 Correlated Markets to Watch ($ Pairs)
1️⃣ CORN CFD ( CAPITALCOM:CORN )
Often moves in tandem with Wheat due to agricultural sector correlation.
Rising Corn prices can support bullish sentiment in Wheat.
2️⃣ SOYBEAN CFD ( CAPITALCOM:SOYBEAN )
Part of the same global grain complex.
Strength in Soy can indicate broad demand for agricultural commodities.
3️⃣ US DOLLAR INDEX ( TVC:DXY )
Wheat is priced in USD.
When the dollar weakens, Wheat often gains due to cheaper pricing for global buyers.
4️⃣ CRUDE OIL CFD ( NSE:OIL )
Higher oil prices increase transportation & production costs for grains.
This can push Wheat prices upward over time.
5️⃣ NATURAL GAS CFD ( PEPPERSTONE:NATGAS )
Influences fertilizer costs globally.
Rising NatGas often tightens supply, supporting Wheat prices.
📌 Key Technical Factors Supporting Bullish Bias
Price maintaining above short-term support zone
Higher lows forming on swing structure
Buyers stepping in repeatedly at discount levels
Strong resistance at 580 acting as the next liquidity target
XAUUSD Far from signaling a BUY yet.Gold (XAUUSD) has been trading within a +1 year Channel Up and has found itself on a correction (Bearish Leg) since it's All Time High (ATH), which was a Higher High for the pattern, 1 month ago.
Despite this -11% Bearish Leg so far, it hasn't even broken yet below its 1D MA50 (blue trend-line), which is something it has done on both previous Bearish Legs. As you can see those have been fairly similar to the current one (-10.92% and -9.32% respectively). All started after roughly +40% Bullish Legs led to those.
Notice also that both Bullish Legs had to test the 1D MA100 (green trend-line) before the started. At the same time the 1W RSI hit its Buy Zone.
As a result, Gold hasn't waved a buy signal yet.
---
** Please LIKE 👍, FOLLOW ✅, SHARE 🙌 and COMMENT ✍ if you enjoy this idea! Also share your ideas and charts in the comments section below! This is best way to keep it relevant, support us, keep the content here free and allow the idea to reach as many people as possible. **
---
💸💸💸💸💸💸
👇 👇 👇 👇 👇 👇


XAUUSD: Market Analysis and Strategy for November 17thGold Technical Analysis:
Daily Resistance: 4250, Support: 4000
4-Hour Resistance: 4145, Support: 4030
1-Hour Resistance: 4110, Support: 4050
The technical picture is largely in line with recent analysis expectations. The weekly chart shows a pullback after a rally, making short-term bullishness somewhat difficult. The daily candlestick pattern's "rounded bottom" support remains intact, and the Bollinger Bands are narrowing. Historically, the risk of a further decline after a technical correction remains relatively high. Those who have been following my recent articles know the important level of 4030. Investors need to be cautious around 4030; a break below this level could lead to a short-term move towards 3930. If the price rebounds and recovers 4130/4160 in the short term, a bullish outlook is warranted, with the 4220/4250 area as a potential resistance level.
Based on the 1-hour chart, gold is currently in a short-term tug-of-war between bulls and bears, with overall market sentiment remaining weak. Watch for support momentum from the MACD/KDJ indicators.
NY Market Trading Strategy:
BUY: 4050 near
BUY: 4040 near
SELL: 4106~4110
More Analysis →

Institutional Order Flow MCl1!Institutional order flow on MCL1! is showing a draw on liquidity with relative equal lows near 55 - 55.5 pricing.
Dropping down to the lower time frame the swing structure holds true and is pointing at lower prices in the near future.
We're looking for entries on the lower time frame and following the fractal trend within the Daily.
Waiting for confirmations, it looks like today will be a bearish day with the nearest target of 59.31
As always, wait for a confirmation entry, and hold small running positions for if we get deeper profits.

Silver psychological 5000 support levelThe Silver remains in a bullish trend, with recent price action showing signs of a corrective pullback within the broader uptrend.
Support Zone: 5000 – a key level from previous consolidation. Price is currently testing or approaching this level.
A bullish rebound from 5000 would confirm ongoing upside momentum, with potential targets at:
5215 – initial resistance
5325 – psychological and structural level
5390 – extended resistance on the longer-term chart
Bearish Scenario:
A confirmed break and daily close below 5000 would weaken the bullish outlook and suggest deeper downside risk toward:
4940 – minor support
4856 – stronger support and potential demand zone
Outlook:
Bullish bias remains intact while silver holds above 5000. A sustained break below this level could shift momentum to the downside in the short term.
This communication is for informational purposes only and should not be viewed as any form of recommendation as to a particular course of action or as investment advice. It is not intended as an offer or solicitation for the purchase or sale of any financial instrument or as an official confirmation of any transaction. Opinions, estimates and assumptions expressed herein are made as of the date of this communication and are subject to change without notice. This communication has been prepared based upon information, including market prices, data and other information, believed to be reliable; however, Trade Nation does not warrant its completeness or accuracy. All market prices and market data contained in or attached to this communication are indicative and subject to change without notice.

Gold support at 4033Key Support and Resistance Levels
Resistance Level 1: 4147
Resistance Level 2: 4207
Resistance Level 3: 4243
Support Level 1: 4033
Support Level 2: 4009
Support Level 3: 3985
This communication is for informational purposes only and should not be viewed as any form of recommendation as to a particular course of action or as investment advice. It is not intended as an offer or solicitation for the purchase or sale of any financial instrument or as an official confirmation of any transaction. Opinions, estimates and assumptions expressed herein are made as of the date of this communication and are subject to change without notice. This communication has been prepared based upon information, including market prices, data and other information, believed to be reliable; however, Trade Nation does not warrant its completeness or accuracy. All market prices and market data contained in or attached to this communication are indicative and subject to change without notice.

XAU/USD | Gold Holding Strong – More Upside If Support Holds!By analyzing the #Gold chart on the 4H timeframe, we can see that after a pullback, the price climbed again to $4112 before making a small correction. It’s now trading around $4078.
If gold can hold above $4048, we can expect another move to the upside.
The next potential targets are $4106, $4112, $4133, and $4159.
Please support me with your likes and comments to motivate me to share more analysis with you and share your opinion about the possible trend of this chart with me !
Best Regards , Arman Shaban

Double Top on the Weekly Silver ChartSilver ( AMEX:SLV ) has had a great run this year, however after a volatile week we've now printed a double top on the weekly chart. Is that the end of this great bull run? It would not surprise me to see some profit taking as we head towards the end of year. Perhaps a drift lower rathe rather than a collapse?

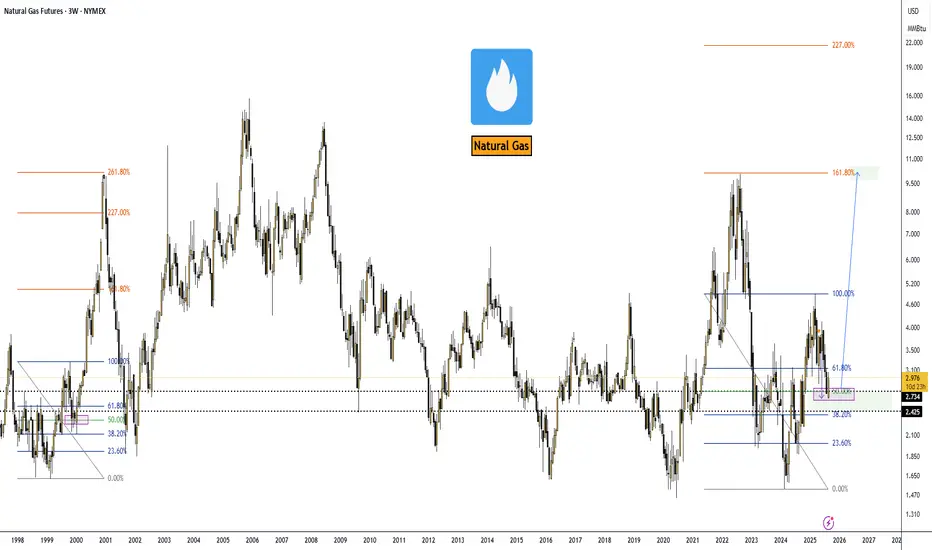
Natural Gas Market Outlook — September 01, 2025.VANTAGE:NG #NaturalGas #NatGas (NYMEX:NG1!) 🔵 Natural Gas Market Outlook — September 01, 2025.
Alright, here’s the skinny on NatGas. Back on April 28, 2025, I was calling for a dip into the $2.74 zone—and guess what? We tagged it right on schedule.
Now the game flips: I’m hunting long entries with the first serious target sitting at $10.00.
Could we overshoot? Absolutely. If momentum really gets cooking, the Fibo 227% extension lines up at roughly $21.00. But let’s not get greedy yet—$10 stays the main milestone for the next big leg.
Macro Drivers
➖ Exports: LNG shipments are the elephant in the room. Europe’s still thirsty, Asia’s paying up, and U.S. cargos are cashing in.
➖ Production: Flat. Shale guys aren’t rushing to flood the market unless we break above $3.20+.
➖ Geopolitics: Russia’s LNG rerouting and Middle East jitters keep a bid under global gas.
➖ Utilities & Consumers: Domestic demand is softer thanks to renewables transitions, but that’s a sideshow compared to export flows.
Big Picture
EIA pegs Henry Hub at $3.60 in 2025 and $4.30 in 2026, but frankly, that’s conservative. With demand from data centers, electrification, and global LNG growth, upside is more likely than not.
Trade View
➡️ I’m treating $2.74 as the cycle low. Any dips near that level look like golden tickets for long positioning into 2026. First pit stop: $10.00. If bulls get rowdy, keep an eye on $21.00 as the stretch target.
➡️ Bottom line: NatGas just gave us the reset we were waiting for. From here, risk/reward favors the long side. Strap in—it’s gonna be a volatile ride, but that’s where the money gets made.
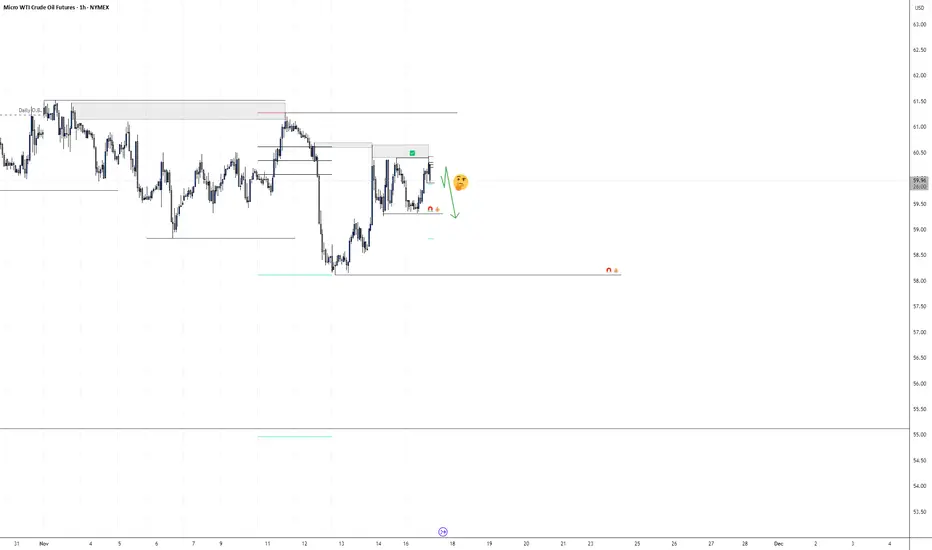
BULLISH SCENARIO - USOILHello traders,
USOIL is currently moving inside a descending channel.
A bullish breakout is in focus:
If the price breaks the channel resistance and confirms the close above,
a strong upward movement is expected 🚀
🎯 TARGET: 65.150
