GOLD $GC Levels and Patterns AnalysisTraders and Investors,
Gold (XAUUSD) has been consolidating mostly but still has been giving a lot of great short term and swing trade opportunities.
I have updated the important levels and zones which can act as support and resistance. They should guide us a bit for the best possible trade opportunities.
There as possible W pattern forming. It has not formed or completed yet. It must first break the trend line and confirm the break. BTW, that trend line can also give us a good opportunities around it. Next, the price has to break the mid point of potential W pattern. Once it has done that, it can complete the W pattern.
Trade what you see, wait for the confirmations and manage the risk as always.
Follow for more. Please support this analysis by liking, commenting, and sharing with friends, colleagues, traders, and trading communities. Thanks👍🙂
Commodities

Gold. Can we run from bull trap? 20/Nov/25Xauusd probably having pullback toward 4185 +/- before a "big surprise " for bull...

Bullish bounce off?Gold (XAU/USD) has bounced off the pivot which aligns nicely with the 61.8% Fibonacci retracement and could potentially rise to the 1st resistance.
Pivot: 4,043.08
1st Support: 3,973.06
1st Resistance: 4,149.32
Disclaimer:
The opinions given above constitute general market commentary and do not constitute the opinion or advice of IC Markets or any form of personal or investment advice.
Any opinions, news, research, analyses, prices, other information, or links to third-party sites contained on this website are provided on an "as-is" basis, are intended to be informative only, and are not advice, a recommendation, research, a record of our trading prices, an offer of, or solicitation for, a transaction in any financial instrument and thus should not be treated as such. The information provided does not involve any specific investment objectives, financial situation, or needs of any specific person who may receive it. Please be aware that past performance is not a reliable indicator of future performance and/or results. Past performance or forward-looking scenarios based upon the reasonable beliefs of the third-party provider are not a guarantee of future performance. Actual results may differ materially from those anticipated in forward-looking or past performance statements. IC Markets makes no representation or warranty and assumes no liability as to the accuracy or completeness of the information provided, nor any loss arising from any investment based on a recommendation, forecast, or any information supplied by any third party.

GBPCHF outcome.GBPCHF making higher highs and higher lows consistently. Now in the consolidation zone. Let's see if it will continue to climb going into London session.

GOLD LOSES MOMENTUM AFTER FOMC – BUY OR SELL OPPORTUNITY TODAY?1. Market Context
Yesterday, the market showed a clear risk-averse sentiment, leading safe-haven flows into gold. This pushed the price back up to retest the 4130–4133 resistance zone — an area where gold has repeatedly failed to break through.
During the US session, the FOMC minutes were released with a notably hawkish tone:
The Fed is not ready to cut interest rates yet.
They want more data before the December meeting.
Some members even want to maintain a tighter stance.
This message weakened gold’s bullish momentum, causing the price to correct down from the highs.
2. BUY Zones for the Day
🎯 Ideal BUY (highest priority):
4010
3998
🎯 Extended BUY:
4010 – 4015
4035 – 4040
→ These are solid support areas, suitable for traders looking to catch intraday rebounds.
3. SELL Zones
🔥 Strong SELL (major resistance):
4130 – 4133
🔥 Extended SELL:
4148 – 4150
→ Both zones align with multi-tested resistance levels that have shown strong reactions.
4. Special Zone to Watch – Trend Decision Point
📌 4080 – 4085 (Fibo 0.5 – 0.618)
If price breaks above 4085 clearly, gold may shift to an intraday bullish trend → prioritize breakout BUY, avoid SELL setups.
If 4085 holds, the market remains in range → continue BUY at support & SELL at resistance.
5. Suggested Trading Strategy
Style: SL 10 points – TP 10 points
Priority: BUY at clear support and SELL at strong resistance
Avoid trading in the mid-range (high noise, easy to get stopped out).
Enter positions only when price touches key zones — avoid chasing moves.

GOLD FALTERS POST-FOMC – BUY OR SELL NOW?1. Market Context
Yesterday, the market had a risk-averse sentiment, so safe-haven flows poured into gold, pushing the price to test the resistance area of 4130–4133 – where gold had previously failed multiple times.
During the US session, the FOMC minutes were released with a rather "hawkish" tone:
The Fed is not yet ready to cut interest rates.
Wants to see more data before December.
Some members even want to maintain a tighter stance.
This news weakened gold's upward momentum, and the price adjusted down from the peak.
2. BUY Zones for the Day
🎯 Ideal BUY (highest priority):
4010
3998
🎯 Extended BUY:
4010 – 4015
4035 – 4040
→ These are reliable support zones, suitable for a trading style that catches the rebound.
3. SELL Zones
🔥 Strong SELL (hard resistance):
4130 – 4133
🔥 Extended SELL:
4148 – 4150
→ Both zones coincide with resistance that has reacted well multiple times before.
4. Special Zone to Watch – TREND DECISION
📌 4080 – 4085 (Fibo 0.5 – 0.618)
If the price clearly breaks 4085, gold may change trend for the day → prioritize BUY on breakout, limit SELL.
If 4085 holds, the market remains sideways within the range and continues the strategy of BUY support – SELL resistance.
5. Suggested Trading Strategy
Style: SL 10 points – TP 10 points
Priority: BUY at clear support – SELL at strong resistance
Avoid trading in the middle zone (noise – easy to hit SL).
Place orders only when the price hits the zone – don't fomo in between.

Silver holds steady amid soft labor data and a hawkish Fed
Silver prices are holding steady as markets weigh soft labor data against a hawkish Fed.
ADP reported that private-sector employment fell by an average of 2.5k jobs per week over the four weeks to Nov 1. Moreover, Cleveland Fed data also showed 39k workers received layoff notices in Oct, close to a 40k level that exceeded only during the global financial crisis and the pandemic.
Meanwhile, the Oct FOMC minutes were hawkish, with several participants indicating that an additional 0.25% cut would not be appropriate and stressing a risk-balanced approach to future policy decisions.
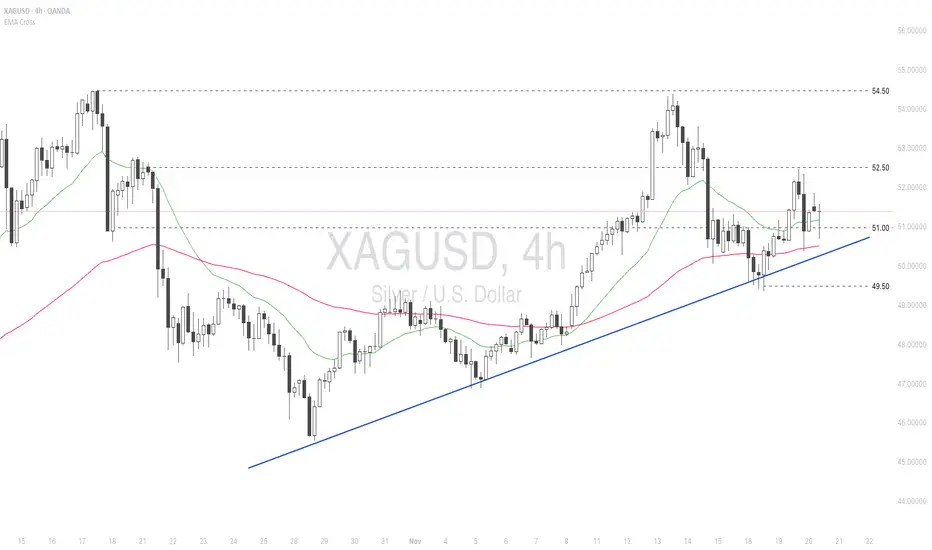
XAGUSD remains range-bound between 51.00-52.50, awaiting additional price triggers for a clear breakout.
If XAGUSD closes above 51.00, the price may retest the next resistance at 52.50.
Conversely, if XAGUSD breaks below EMA21 and 51.00, the price could retreat toward the subsequent support at 49.50.
Gold Surges as Investors Rotate Back to Safe HavensHello everyone, observing XAU/USD on the 1H chart today is genuinely impressive: from the 4,000 USD/oz low last night, gold has shot straight up to 4,074 USD/oz, gaining 74 USD within just a few hours. This is the kind of recovery that signals buyers never disappeared — they were simply waiting for the right moment to strike.
On the chart, the 4,000 USD/oz zone once again proved its role as a “steel defensive line,” where demand stepped in decisively, perfectly aligning with the green FVG that previously triggered a strong bullish leg. From that area, price climbed back into the Ichimoku cloud and is now approaching the 4,075–4,085 USD/oz resistance band. This will be the gateway for the next move: if gold breaks through, the market may push directly toward 4,100–4,120 USD/oz, and even as high as 4,150 USD/oz if momentum expands. Otherwise, rejection here could send price back to 4,040–4,030 USD/oz for a breather before continuing higher. The market tone right now is classic: accumulate – break – retest, with both sides fighting over narrow zones.
Importantly, today’s strong rebound isn’t purely technical. Safe-haven flows are returning as global equities drop sharply and US macro data — particularly labour indicators — show emerging weakness. Investors are pulling away from risk assets, especially overheated tech stocks inflated by the AI wave, and rotating back into gold — the traditional shelter whenever uncertainty grows. At the same time, expectations for a possible December rate cut remain alive, causing USD strength to stall and giving additional room for gold to recover. On top of that, Bloomberg and Goldman Sachs confirmed China bought another 15 tonnes of gold in September, reinforcing the idea that major players are still accumulating — and they usually move earlier than the crowd.
Based on the current signals, I believe this rebound still has room to extend. Gold may continue toward 4,075–4,085 USD/oz to fill the remaining FVG, and if that zone breaks with firm buying interest, the 4,100–4,120 USD/oz target is completely achievable today. A mild correction may still occur if profit-taking kicks in, pulling price back toward 4,040–4,030 USD/oz to build fresh equilibrium before resuming upward. Overall, gold feels like a drawn bow at the moment — ready for a further thrust if risk-off momentum persists.
This is a phase where gold truly returns to its core identity: a refuge when confidence fades. With capital rotating back into safe assets, a dovish signal from the Fed next month could turn this rebound into something much bigger heading into December. What about you — which scenario do you lean toward for gold today?

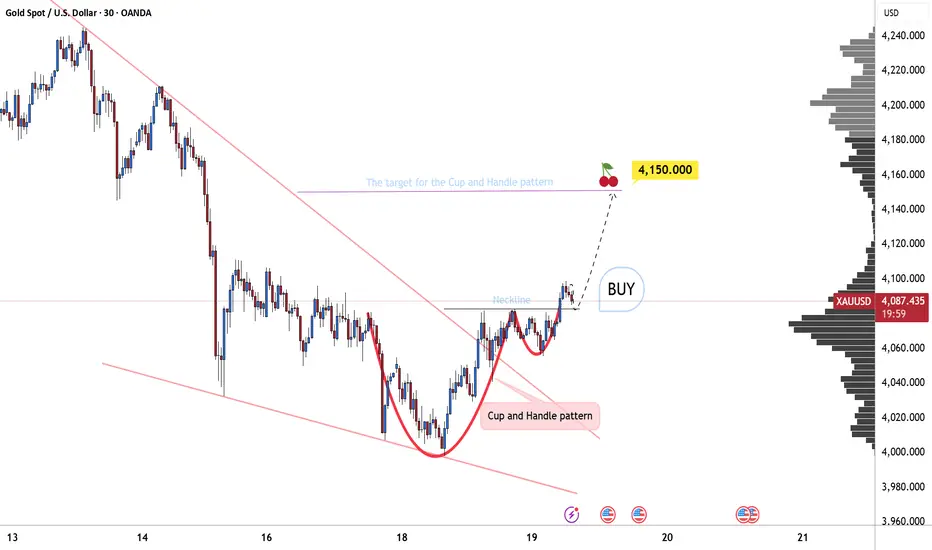
Cup and Handle: Bullish Outlook for GoldOANDA:XAUUSD is clearly forming a Cup and Handle pattern. The price previously dropped to the 4000 zone, then rebounded to 4080, completing the cup structure.
Afterward, the market is experiencing a slight pullback, forming a tight and well-controlled handle.
Finally, the price breaks through the neckline with strong momentum, and my next target is around 4150 , measured based on the height of the cup.
This is a classic bullish pattern, and market expectations are gradually being reinforced.
COPPER / GOLD & ISM PMI = Critical For AltseasonBeen seeing a lot of commentary on COPPER / GOLD.
This is a strong indication of industrial growth in the economy, as the demand for copper rises with build-outs.
The ISM PMI has a very strong correlation with C/G, also showing strength in the economy, as consumers buy more which gives businesses the ability to expand operations.
In a nutshell, these charts portray “Retail” ie “Main Street”.
There’s a very real possibility that we do not get our typical Alt Season at all this cycle if C/G & ISM PMI do not have a violent move up in the next few months. (more on this later)
The last time we saw such a divergence between these two was in January 2016 where it took C/G ~230 days to turn-up.
This would put Alt-Season Q4 ’26 - Q1 ’27, which makes sense theoretically based on Trump’s suspected stimulus plans which would come right before mid-terms.
This would give us our typical year-long bear market which has snuck up on us all because we lacked the retail euphoria phase due to very weak retail participation.
HOPIUM:
In 2016 When the ISM climbed above 50, COPPER soon found a bottom and Alts ripped.
Notice the bullish divergence on the RSI during that time, same as we are seeing now.
It looking like C/G may have found a bottom on this multi-decade parallel channel.
*Our livelihood depends on the ISM showing immense strength in the coming months so that C/G can follow.

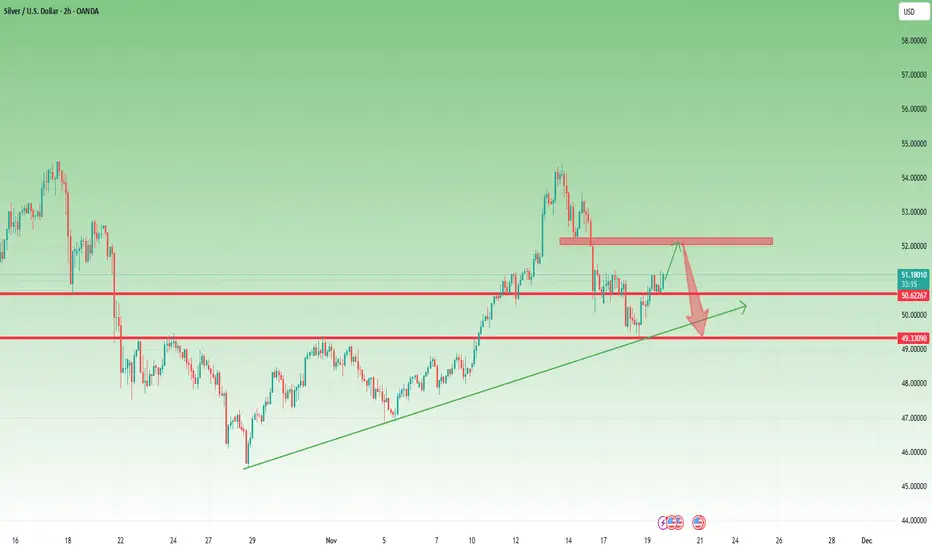
XAGUSD - Trading IdeaXAGUSD - Trading Idea
Title:
XAGUSD: Rejection from 52.34 level, decline expected to demand zone
Description:
Current Situation:
Silver price has met resistance at the 52.34 level, where a high volume zone is located. Limit players have stopped the upward movement at this key level.
Primary Scenario:
A decline toward the lower high volume zone is expected, where demand may form for entry into long positions. This area presents interest for seeking buying opportunities.
Alternative Scenario:
If the price reverses from current levels and breaks through the 52.34 resistance, the primary bearish scenario will be invalidated. In this case, a reassessment of the trading strategy will be required.
Trading Plan:
Resistance: 52.34 (high volume zone)
Target zone for buys: lower high volume area (marked on chart)
Invalidation: breakout and consolidation above 52.34
Position Management:
If the scenario plays out, partial profit-taking is planned at the 52.34 level. A small portion of the position will be held for potential movement higher with a trailing stop.
Risk Management:
It is recommended to wait for price reaction in the target zone before entering a position. Place stop-loss below the demand zone accounting for the instrument's volatility.

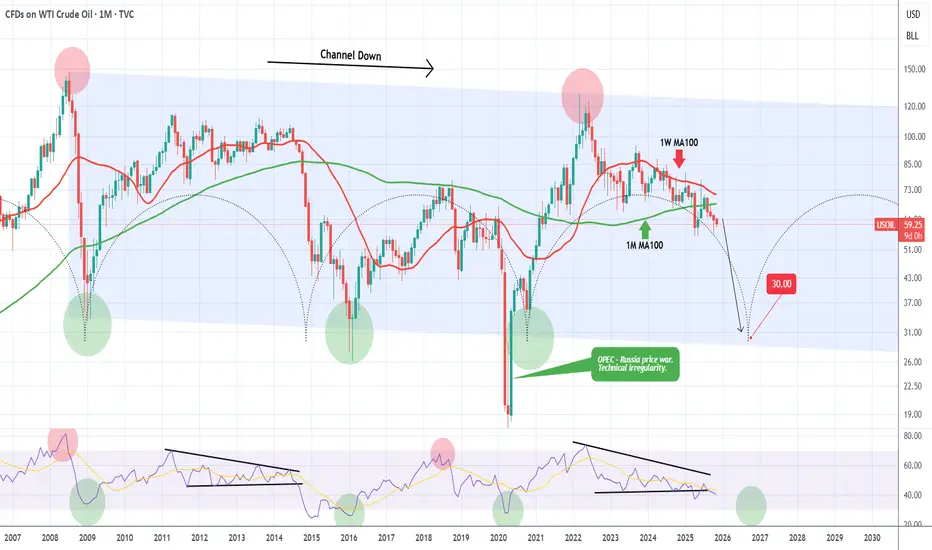
WTI OIL Is it possible to crash at $30.00?WTI Oil (USOIL) has been declining for 3 straight months (current red 1M candle is the 4th one) since the June 2025 rejection on the 1W MA100 (red trend-line). That has been the last rejection of a series of Lower Highs rejections on the 1W MA100 in the past 2 years.
On the much longer-term scale, this is the aftermath of the March 2022 market Top, made as a direct result of the Ukraine - Russia war. On a 17-year horizon, that was the 2nd Lower High of the multi-year Channel Down that WTI has been trading in since the July 2008 Top of the Housing Crisis.
As you can see, there is a high degree of symmetry on this pattern with Lower Lows in particular (market bottoms) getting formed around every 5-6 years. The use of the Time Cycles can fairly accurately project this. The next one is estimated to be towards the end of 2026, which matches perfectly the projected Bear Cycle bottom on the stock markets.
Based on this model, we may very well see WTI drop to as low as $30.00. A fairly solid bottom buy indicator would be when (if) the 1M RSI breaks below its 30.00 (oversold) barrier.
---
** Please LIKE 👍, FOLLOW ✅, SHARE 🙌 and COMMENT ✍ if you enjoy this idea! Also share your ideas and charts in the comments section below! This is best way to keep it relevant, support us, keep the content here free and allow the idea to reach as many people as possible. **
---
💸💸💸💸💸💸
👇 👇 👇 👇 👇 👇
Natural Gas Attempts to Return to the Year’s Highest LevelsSince October 17, natural gas has maintained a steady bullish bias, posting an appreciation of nearly 43%, which has fueled sustained buying pressure on prices. This upward movement has been supported by increasing inventory levels in countries such as China, Japan, and South Korea, which have ramped up purchases ahead of the winter season and diversified suppliers amid potential sanctions involving Russia. If this pace of consistent buying continues in the coming weeks, the current bullish pressure could become even more significant in natural gas price movements over the next few sessions.
Strong Uptrend
In recent weeks, buying momentum has remained persistent, with the average upward impulses in natural gas prices forming a solid uptrend, bringing the market closer to the yearly highs near $4.9. So far, the short-term pullbacks have not been strong enough to break this aggressive bullish trendline. As long as there is no consistent selling pressure, the current uptrend is likely to remain dominant in the short term.
RSI
The RSI line remains above the 50 level, indicating that buying momentum continues to drive price movements. However, the indicator is now approaching the 70 level, suggesting a potential overbought signal. This may imply that, given the speed of the recent rally, the market could experience short-term pullbacks as this imbalance in buying pressure persists.
TRIX
Overall, the TRIX indicator remains above the neutral level, showing a consistent upward slope. This confirms that the long-term trend remains bullish, suggesting that buying pressure may continue to dominate natural gas price action in the coming sessions.
Key Levels to Watch:
$4.80 – Resistance: Represents the recent high zone. A breakout above this level could trigger a more aggressive uptrend in the following sessions.
$4.46 – Intermediate Support: Marks the most recent retracement area, which could serve as a temporary barrier against short-term downward corrections.
$3.84 – Key Support: This is the most relevant retracement level of recent weeks. If prices drop to this zone, it could signal an emerging bearish bias, putting the current bullish trendlines at risk.
Written by Julian Pineda, CFA, CMT – Market Analyst

Gold 30-Min — Volume Buy Reversal Triggered⚡Base : Hanzo Trading Alpha Algorithm
The algorithm calculates volatility displacement vs liquidity recovery, identifying where probability meets imbalance.
It trades only where precision, volume, and manipulation intersect —only logic.
✈️ Technical Reasons
/ Direction — LONG / Reversal 4068 Area
☄️Bullish momentum confirmed through strong candle body.
☄️Structure shifted with higher-low near key demand base.
☄️Volume expanding confirms order-flow alignment upward.
☄️Buyers reclaimed imbalance with sustained clean break.
☄️Algorithm detects rising momentum under low liquidity.
⚙️ Hanzo Alpha Trading Protocol
The Alpha Candle defines the day’s real control zone — the first battle of momentum.
From this origin, the Volume Window reveals where the next precision strike begins.
⚙️ Hanzo Volume Window / Map
Window tracked from 10:30 — mapping true market behavior.
POC alignment exposes institutional bias and breakout potential zones.
⚙️ Hanzo Delta Window / Pulse
Delta window monitors real buying vs. selling power behind each move.
Tracks volume aggression to expose who controls the candle — buyers or sellers.
When Delta aligns with Volume Map, momentum becomes undeniable.

GOLD 1H CHART ROUTE MAP UPDATE & TRADING PLAN FOR THE WEEKHey Everyone,
Please see our updated 1h chart levels and targets for the coming week.
We are seeing price play between two weighted levels with a gap above at 4114 and a gap below at 4057. We will need to see ema5 cross and lock on either weighted level to determine the next range.
We will see levels tested side by side until one of the weighted levels break and lock to confirm direction for the next range.
We will keep the above in mind when taking buys from dips. Our updated levels and weighted levels will allow us to track the movement down and then catch bounces up.
We will continue to buy dips using our support levels taking 20 to 40 pips. As stated before each of our level structures give 20 to 40 pip bounces, which is enough for a nice entry and exit. If you back test the levels we shared every week for the past 24 months, you can see how effectively they were used to trade with or against short/mid term swings and trends.
The swing range give bigger bounces then our weighted levels that's the difference between weighted levels and swing ranges.
BULLISH TARGET
4114
EMA5 CROSS AND LOCK ABOVE 4114 WILL OPEN THE FOLLOWING BULLISH TARGETS
4175
EMA5 CROSS AND LOCK ABOVE 4175 WILL OPEN THE FOLLOWING BULLISH TARGET
4232
EMA5 CROSS AND LOCK ABOVE 4232 WILL OPEN THE FOLLOWING BULLISH TARGET
4289
EMA5 CROSS AND LOCK ABOVE 4289 WILL OPEN THE FOLLOWING BULLISH TARGET
4361
BEARISH TARGETS
4057
EMA5 CROSS AND LOCK BELOW 4057 WILL OPEN THE FOLLOWING BEARISH TARGET
4006
EMA5 CROSS AND LOCK BELOW 4006 WILL OPEN THE FOLLOWING BEARISH TARGET
3965
EMA5 CROSS AND LOCK BELOW 3965 WILL OPEN THE SWING RANGE
3923
3861
As always, we will keep you all updated with regular updates throughout the week and how we manage the active ideas and setups. Thank you all for your likes, comments and follows, we really appreciate it!
Mr Gold
GoldViewFX

Silver is close to it's next decisionIn the short-term, Silver is still digesting the next decision.
On the shorter term charts, a couple of H&S patterns have emerged. There is a chance of slight weakness for the remainder of 2025, but I'm not convinced until it falls below $46.
Right now $49 is still solid support.. so it could trend sideways before resuming it's bull run.
The thick yellow line around $39 below is a monthly/weekly gap from Sept... just something to keep an eye on until this enters all-time high territory. If this trends below $45, then the double top measured move could play out down to the gap area.

Gold NY Session Strategy 11/19: Will up to 4162 Gold Daily Plan – SMC Outlook (Nov 20)
Framework: CHoCH – BOS – FVG – POI – Premium/Discount Model
1. Market Context
Gold continues to recover after the sharp drop earlier this week. Price is now approaching the Premium zone of the current bullish swing and tapping into H1 supply. The market shows:
Buyers still in short-term control
Momentum weakening as price reaches resistance
A corrective pullback into Discount is likely before any further expansion
2. Structural Overview (SMC Logic)
🔻 Overall Market Structure
A key BOS formed around 4090–4100 → confirms short-term bullish structure
Follow-up CHoCH signals continuation of the intraday uptrend
Price is moving toward the upper FVG + Supply Zone (4160–4162)
🔸 Orderflow Notes
Strong reaction at the 4140 area → clear presence of passive Sell Limit absorption
Demand POI at 4091–4089 held exceptionally well → main bullish mitigation zone
3. Trading Zones (POI)
✅ BUY Zone (Discount Area)
4091 – 4089
Demand + previous CHoCH + fib 1.272 confluence
Ideal low-risk long setup within Discount
Suggested SL: 4087
BUY Scenario:
Price retraces to POI → shows bullish reaction → long toward Premium.
❗️ SELL Zones (Premium Area)
Aggressive Sell Zone:
4143 – 4145
SL: 4147
Optimal Sell Zone:
4160 – 4162
Major supply + imbalance + fib 2.618 extension
Highest probability for reversal
SL: 4165
4. Trade Scenarios
📌 Primary Scenario (High Probability)
Price retraces into 4091–4089 Demand
Look for CHoCH/BOS confirmation on lower timeframe
Enter BUY → target 4143 → 4160
→ Classic SMC model: Buy from Discount → Sell from Premium.
📌 Alternative Scenario
If price rallies straight into 4143–4162 without retracement:
ONLY enter SELL when a clear bearish CHoCH or strong rejection forms
Target: 4100 → 4090
5. Intraday Bias
→ Bullish in Discount zones – Bearish in Premium zones.
Trade based on orderflow → Do not chase price in the middle range.
6. Summary
BUY: 4091–4089 (SL 4087) → TP: 4140 – 4160
SELL:
• 4143–4145 (SL 4147)
• 4160–4162 (SL 4165)
Wait for confirmation at each POI; avoid mid-range entries.

GOLD The Target Is UP! BUY!
My dear friends,
My technical analysis for GOLD is below:
The market is trading on 4038.3 pivot level.
Bias - Bullish
Technical Indicators: Both Super Trend & Pivot HL indicate a highly probable Bullish continuation.
Target - 4059.3
Recommended Stop Loss - 4026.8
About Used Indicators:
A pivot point is a technical analysis indicator, or calculations, used to determine the overall trend of the market over different time frames.
Disclosure: I am part of Trade Nation's Influencer program and receive a monthly fee for using their TradingView charts in my analysis.
———————————
WISH YOU ALL LUCK

New Leg Up Possible, Yet I Expect Another Decline Toward 491. What Happened Since Yesterday
In yesterday’s analysis, I highlighted the possibility of a rebound from the confluence support and mentioned that Silver could rise toward the 50.50 resistance.
Not only did Silver reach that target — it broke above it, and the price is now trading above 51.00.
The bullish momentum was stronger than expected, confirming buyers stepped in aggressively from support.
2. Current Market Context
With price holding above 51, the short-term chart structure is slightly bullish, and a new leg up is possible in the immediate term.
However, despite this strength, I believe the overall correction is not yet complete. Silver has a habit of producing sharp counter-trend moves before continuing the broader direction.
3. Technical Outlook
Key levels to monitor:
Resistance:
- 52.00 – major short-term barrier; ideal area to search for shorts
- 50.50 – intraday resistance turned support
Support / Downside target:
- 49.00 – the next major support and my preferred downside target
Until Silver breaks and holds above 52, upside continuation remains limited in my view.
4. Trading Plan
My plan is straightforward:
If price reaches the 52 zone, I will look for short entries.
Downside target is 49.
I will reassess the bias only if Silver starts to stabilize well above 52, which would shift the structure back to bullish.
5. Conclusion
Silver exceeded expectations on the rebound, but the larger corrective structure appears intact.
Short-term upside is possible, yet I still expect another leg down, with 49 as the main target.
GOLD: Long Trade with Entry/SL/TP
GOLD
- Classic bullish setup
- Our team expects bullish continuation
SUGGESTED TRADE:
Swing Trade
Long GOLD
Entry Point - 4089.3
Stop Loss - 4079.3
Take Profit - 4109.5
Our Risk - 1%
Start protection of your profits from lower levels
Disclosure: I am part of Trade Nation's Influencer program and receive a monthly fee for using their TradingView charts in my analysis.
❤️ Please, support our work with like & comment! ❤️

SILVER (XAGUSD): Bullish Continuation After Pullback
There is a high chance that Silver will go up from the underlined support.
A bullish breakout if a neckline of an inverted head & shoulders pattern
provides a strong confirmation.
Expect a rise to 53.2 level.
❤️Please, support my work with like, thank you!❤️
I am part of Trade Nation's Influencer program and receive a monthly fee for using their TradingView charts in my analysis.

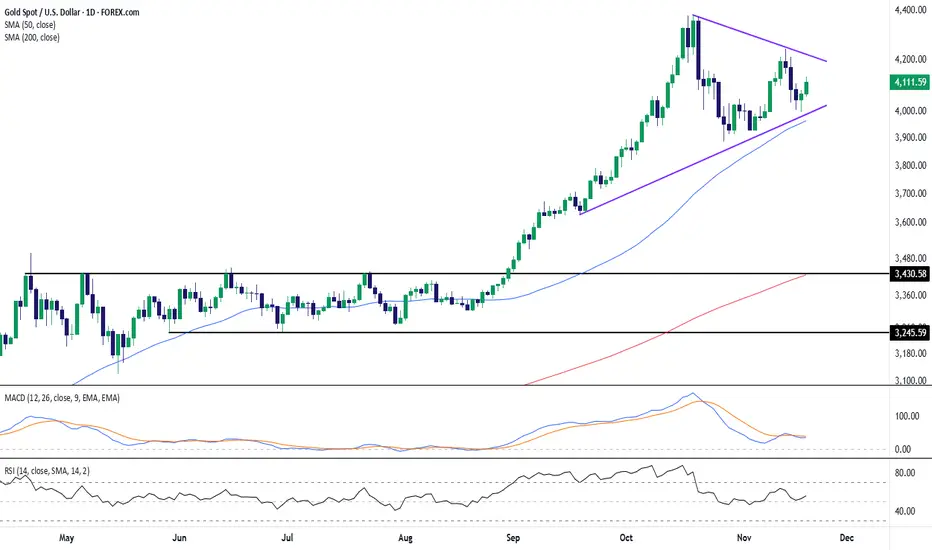
Gold Consolidates Within Symmetrical Triangle as Bulls Defend 4KGold (XAU/USD) continues to trade within a well-defined consolidation pattern following its strong rally earlier in the quarter. The metal is currently forming a symmetrical triangle, bounded by rising support near 4,000 and descending resistance around 4,250. This setup reflects a period of equilibrium between buyers and sellers as momentum stabilizes after recent highs.
The 50-day simple moving average (SMA) near 3,965 remains an important dynamic support, while the 200-day SMA far below at 3,427 indicates the broader uptrend remains intact. Price recently rebounded from the triangle’s lower boundary and the 50-day SMA, suggesting that short-term buyers are still active within the structure.
Momentum readings are neutral to mildly constructive. The MACD lines are flattening after a bearish crossover, signaling reduced downside momentum, while the RSI hovers near 56, consistent with balanced but improving sentiment.
As long as gold remains above the 4,000 region, focus stays on a potential breakout from this converging pattern — with direction likely dictated by whether bulls can overcome the upper trendline resistance or if sellers regain control near that zone.
-MW
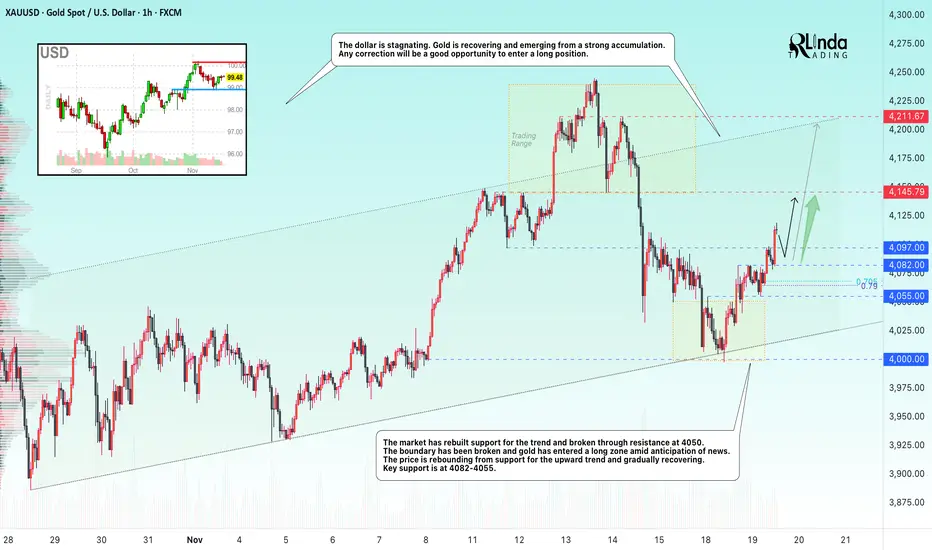
GOLD → Market support, exit from consolidationFX:XAUUSD is feeling market support ahead of the news. The price is rebounding from trend support, breaking through strong resistance and enjoying high interest from bulls...
The rise in demand for defensive assets is driven by concerns about the overvaluation of technology stocks and weak US labor market data. The number of applications for unemployment benefits rose significantly in October. Private employers cut jobs for four weeks. The Fed minutes may show disagreement over the regulator's future policy, and the probability of a rate cut in December is estimated at 50/50. The market's attention is focused on September NFP data (forecast: +50K).
Gold is awaiting signals from the Fed and employment data. The Fed's cautious stance and weak NFP data could support further price growth.
Resistance levels: 4145 - 4211
Support levels: 4097, 4082, 4055
Gold is entering a long zone. Any correction could be a good opportunity to enter the market. Pay attention to key support levels for trend trading...
Best regards, R. Linda!