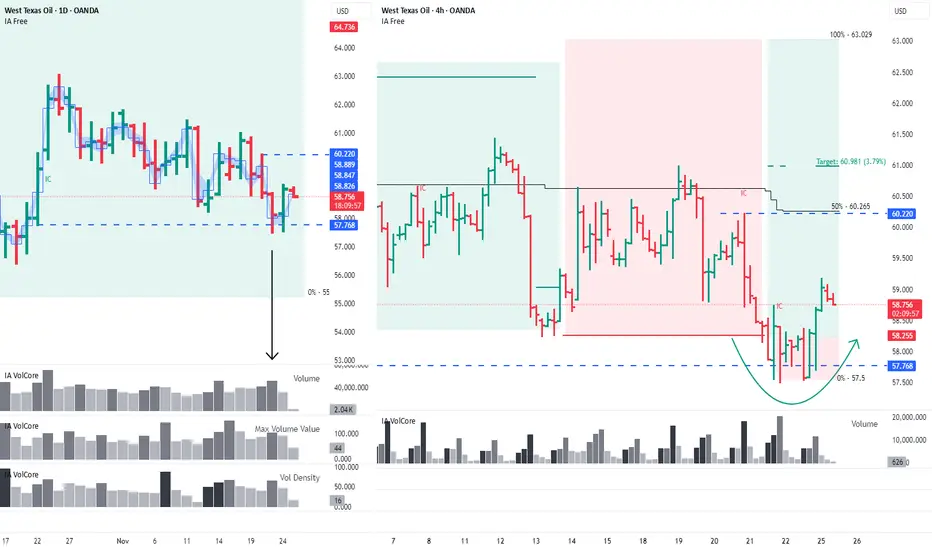
WTI: Buyers Return After a False BreakoutOn the daily timeframe, buyers absorbed the sellers, and a false-breakout pattern has formed on the 4H chart. The nearest targets are 60.22 and 60.981.
This analysis is based on the Initiative Analysis (IA) method.
Hello, traders and investors!
Oil is showing early signs of recovery. On the daily timeframe, the key level is 57.768 — the base of a buyer candle with increased volume during the last upward impulse. A high-volume seller candle interacted with this level, and yesterday’s daily buyer candle absorbed the seller, indicating strengthening buyer initiative. It’s also worth noting that in both candles, the key volume was accumulated at the bottom.
The blue band on the chart represents the minimal price range of the candle where 50% of the volume was accumulated.
The blue line marks the price level with the maximum accumulated volume.
On the 4-hour timeframe, the price is in a sideways range. A false-breakout pattern has just formed at the lower boundary of this range. The nearest target is 60.22, which aligns with the 50% level of the trading range — an important point to monitor. The next target is 60.981.
Wishing you profitable trades!
Commodities
XAU/USD – Price Reaches Key Supply ZoneXAU/USD – Price Reaches Key Supply Zone, Bearish Reaction Expected
Gold on the H1 timeframe has completed a full A–B–C corrective structure, pushing price back into a major supply zone where sellers previously dominated. As price taps this zone again, the candlestick behavior shows hesitation and shrinking momentum — a classic signal of weakening buying pressure before a potential reversal.
This setup aligns with a typical rising correction into supply, often followed by a downside leg if sellers regain control.
Key Technical Zones
Supply (Strong Resistance)
4145 – 4170
The zone where price rejected sharply in the past, now being retested. Market structure suggests sellers may step in again.
First Support
4085 – 4095
A short-term liquidity pocket. A break below this area increases bearish confirmation.
Major Support
4015 – 4030
The deeper target if bearish momentum expands.
Trend Outlook
Price has reached a critical exhaustion point at the top of the pattern.
Rising wedge-like momentum combined with previous sell-offs at the same zone increases bearish probability.
If the rejection holds, gold may start a short-term downtrend targeting lower liquidity zones.
Trade Strategy (Sell Bias)
1. Short Position (Primary Plan)
Entry Zone: 4140 – 4155
Stop Loss: Above 4172
TP1: 4090
TP2: 4035
TP3: 4015 (extended target)
2. Alternative Breakout Plan
If price breaks and holds above 4172 on H1:
Invalidate bearish bias
Wait for new structure before considering longs
Market Notes
Current price action shows exhaustion wicks and compression into resistance.
Ideal confirmation is an H1 bearish engulfing or structure break below 4125–4130.
Avoid FOMO entries midway; only trade at zones where risk is controlled.
If you find this analysis useful, save it and follow for more high-quality setups updated daily.

Gold Pauses as Sellers Signal a Potential Downward Move AheadHello everyone,
Gold has just gone through a rather “heavy” session after being strongly rejected at the 4,090–4,100 USD area — a region where sellers seem ready to step in the moment price attempts to move higher. At the moment, gold has pulled back to around 4,065 USD, and the repeated appearance of small-bodied candles with long upper wicks looks like a reminder that the market is becoming tired after the previous bullish move.
External conditions are adding more pressure as well: the USD has strengthened sharply following US economic data that beat expectations, the 10-year Treasury yield remains above 4%, and equity markets continue to rally thanks to Big Tech. With capital flowing out of safe-haven assets, gold simply lacks the “immediate reason” to bounce strongly right now.
With everything that’s unfolding, I’m leaning towards a clear scenario: gold is likely to slide down toward the 4,040–4,030 USD zone to test liquidity. If this area fails to hold, a drop toward 4,000 USD becomes a very real possibility — and that’s where the market may decide whether buyers still have enough strength to return.
What about you — do you think gold can defend 4,040 and rebound, or will it need to fall all the way to 4,000 before any recovery can happen?

XAUUSD Wait for the pull back for the next long entry Gold surged to the nearest resistance, XAUUSD Wait for the pull back for the next long entry

Latest Gold Update Today!Hey traders,
As we kick off this new week, XAUUSD is holding steady, hovering around the 4,050-dollar level with barely any noticeable volatility.
This calm price action comes as the market keeps a close eye on what the Federal Reserve plans to do next. More and more participants are expecting the Fed to shift toward a more dovish stance and potentially move closer to a rate cut by the end of the year. With bond yields slipping, the dollar gradually losing strength, and safe-haven demand picking back up, gold is getting a solid foundation for a possible short-term push higher.
From a technical standpoint, XAUUSD is tightening inside a triangle pattern — a classic setup that usually signals accumulation before a stronger impulsive move. If price manages to break above the upper boundary, the next target could stretch toward the 4,500-dollar region, supported by the strength of the previous bullish leg.
From my perspective, market sentiment is slowly leaning toward the buyers, especially if upcoming U.S. data continues to ease pressure on gold.
What about you? How do you see things playing out? Are you expecting more upside, or do you think a correction is coming?
Wishing you a smooth, confident, and profitable trading week ahead.

XAUUSD: Running flat, bias is bearish.
Wave count targets 3890.64 and 3745.24, invalidation at 4134.32. Structure is unresolved risk entries are possible, but confirmation still needed. If invalidation occurs, support may develop near 0.618(4154.04) and 0.764(4188.76) Fibonacci retracement.
Count valid below 4134.32
Bearish bias
Monitoring fib pivots for alternate scenario

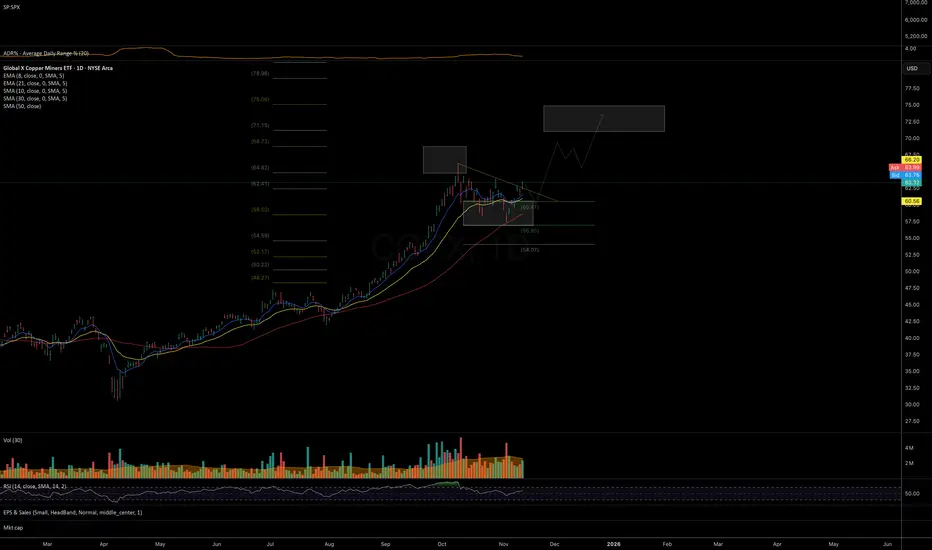
COPX: watching for upside momentum to continue Price is reacting constructively from the ideal mid-term support area established at the November bottom.
The trend structure suggests potential for at least one more leg to the upside into the 71–75 resistance zone, as long as the November lows continue to hold.
Chart:
We all want COFFEE to be cheaper, but uptrend might hold on! Although most CFD-traders might don't care - COFFEE is an interesting commodity right now, especially with current trends with nervous stock markets/indices.
In general:
- Coffee prices correlate with DXY and stock indices/VIX. Especially when stock markets go down
- Coffee is in higher demand as it is used as hedge against falling stock prices
- Coffee is in a long-term bull-market
If correlations align, especially if stock markets decrease more, there is more upside potential for the Coffee price.
CRITICAL WATCHING POINTS
Correlations for taking a LONG on COFFEE:
DXY (Dollar Index):
- Above 100.50 = BEARISH for coffee
- Below 99.70 = BULLISH for coffee
SPX/Stock Indices:
- Rally (VIX < 18) = BEARISH for coffee
- Weaken (VIX > 23) = BULLISH for coffee
BCOM:
- Break below 107 = BEARISH for commodities/coffee
- Break above 108.50 = BULLISH for commodities/coffee
Coffee Major Support Zone:
Hold above 355 = bull market intact
Break below 350 = could be a major problem (or we finally get cheaper coffee in the supermarket?!)

GOLD CORRECTION AHEAD|SHORT|
✅XAUUSD is reacting inside the supply level after sweeping buy-side liquidity, hinting at distribution. A corrective move toward the downside imbalance is likely as algos target lower liquidity. Time Frame 3H.
SHORT🔥
✅Like and subscribe to never miss a new idea!✅

XAUUSD Daily – Five-Wave Impulse Toward 4,530On the XAUUSD daily chart I’m tracking a potential five-wave advance within the existing uptrend.
Wave (1)** marks the initial impulsive leg higher from trendline support
Wave (2)** is the corrective pullback that holds above the origin of wave (1) and respects the rising trendline
Wave (3)** extends beyond the wave
(1) high, confirming continuation of the bullish structure and establishing a new swing high.
* Price is now correcting as **wave (4)** back into the area of:
* the rising trendline drawn from prior lows, and
* the former consolidation / breakout zone around the previous highs.
While price holds above the wave (4) low and the trendline, I’m anticipating a continuation leg to the upside as **wave (5)**.
The projected wave (5) objective is around 4,527, where I have a confluence of measured extension and overhead resistance.
A decisive daily close below the wave (4) low and trendline support would invalidate this wave count and delay the bullish scenario.

How to choose a direction at the end of a triangular formation#XAUUSD TVC:GOLD OANDA:XAUUSD
Although gold is still in a volatile market in the short term, its current trend has entered the end of a converging triangle pattern, and the market is getting closer to choosing a direction.
The market has recently been driven primarily by news, and the current geopolitical tensions, coupled with the stalled Russia-Ukraine peace talks, may trigger a new wave of risk aversion. Therefore, during the European session, we can consider going long on gold when it retraces to the 4040-4030 range.

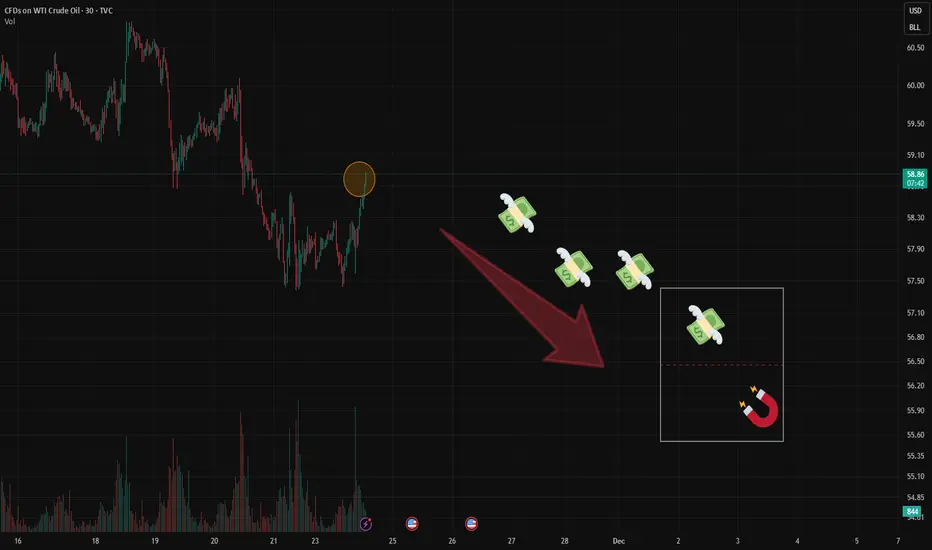
Oil Upd:Price at Resistance–But the Real Story Is in OptionFlowRight now, price has reached the upper boundary of the 1σ Expected Range (ER).
A pause or rejection here is possible.
But that’s not the main story.
Bears are getting active in the options market.
First sign: A significant Put Condor has appeared — large enough to stand out.
Target range: $55–$57
Timeframe: 20 days to expiry
📌 For those still learning:
A Condor profits most when price stays within a tight range at expiry.
Second wave of bearish positioning:
Additional players are placing Put Spreads targeting $54–$55, but with a much shorter horizon — 5–7 days.
This shows a layered approach:
Short and mid- term pressure expected
🧠 Bottom Line:
I’m not jumping into shorts right now — and I wouldn’t advise it blindly.
But given this growing bearish sentiment, it’s smart to start looking for short setups
Sentiment is building.
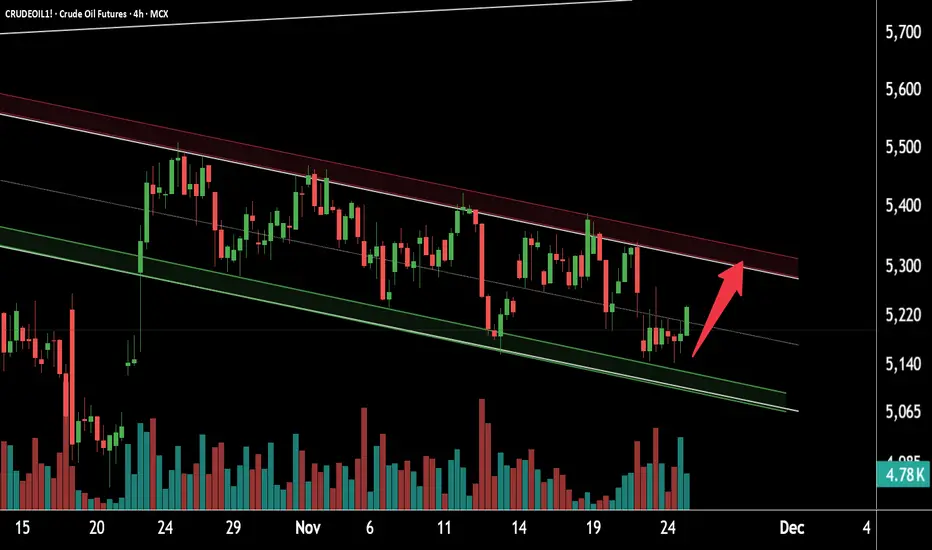
Crude Oil Showing Strong Upside SetupThis is the 4-hour timeframe support zone of Crude Oil.
The price is moving within a falling channel and is currently trading near the support zone at 5050–5100.
Crude Oil is respecting this support and has started taking a reversal.
If the momentum continues, the bullish move may extend towards the resistance zone at 5350–5400.
Thank you.
XAU/USD) Bullish trend analysis Read The captionSMC Trading point update
Technical analysis of breakdown of your analysis idea based on the chart you provided (XAUUSD – 4H):
---
Chart Overview
Symbol: Gold Spot (XAUUSD)
Timeframe: 4H
Indicators used: EMA 50 (blue), EMA 200 (black)
Current price: ~4095.58
Key support zone: 4060 – 4075 region
Target: 4125 – 4130
---
Idea Explanation
1. Market Structure
Price has recently broken upward strongly from the EMA50 zone.
Expectation: A retracement back into the Demand Zone (blue region).
Fibonacci levels shown: 0.5 / 0.618 / 0.705 / 0.786
Expected retracement point appears around 4070–4065.
2. Trade Plan
Bullish Scenario
Wait for price to retrace into the Demand Zone
Look for confirmations (rejection candle, BOS, liquidity sweep)
Enter long position between 4075 – 4065
SL likely beneath 4050–4045
TP area 4125 – 4130
3. Liquidity Concept
Chart shows a liquidity grab (sweep) below previous lows inside the demand zone
After sweep → expectation of impulsive move upward
---
Target & Risk Management
Entry Stop Loss Take Profit R:R
4075–4065 4045 4125–4130 approx 1:3 – 1:4
---
Summary
Bias: Bullish continuation
Strategy: Retracement to demand + Fibonacci confluence + EMA support
Target aligned with next significant high & liquidity area
Mr SMC Trading point
---
My Personal Insight
This setup is clean and valid. The key will be waiting for price to confirm rejection in the zone. If news volatility pushes price deeper, 4060–4050 is strong institutional level.
---
please support boost 🚀 this analysis

GOLD 4H CHART ROUTE MAP UPDATE & TRADING PLAN FOR THE WEEKHey Everyone,
Please see our updated 4h chart levels and targets for the coming week.
We are seeing price play between two weighted levels with a gap above at 4124 and a gap below at 4042. We will need to see ema5 cross and lock on either weighted level to determine the next range.
We will see levels tested side by side until one of the weighted levels break and lock to confirm direction for the next range.
We will keep the above in mind when taking buys from dips. Our updated levels and weighted levels will allow us to track the movement down and then catch bounces up.
We will continue to buy dips using our support levels taking 20 to 40 pips. As stated before each of our level structures give 20 to 40 pip bounces, which is enough for a nice entry and exit. If you back test the levels we shared every week for the past 24 months, you can see how effectively they were used to trade with or against short/mid term swings and trends.
The swing range give bigger bounces then our weighted levels that's the difference between weighted levels and swing ranges.
BULLISH TARGET
4124
EMA5 CROSS AND LOCK ABOVE 4124 WILL OPEN THE FOLLOWING BULLISH TARGETS
4212
EMA5 CROSS AND LOCK ABOVE 4212 WILL OPEN THE FOLLOWING BULLISH TARGET
4328
EMA5 CROSS AND LOCK ABOVE 4328 WILL OPEN THE FOLLOWING BULLISH TARGET
4422
EMA5 CROSS AND LOCK ABOVE 4422 WILL OPEN THE FOLLOWING BULLISH TARGET
4494
BEARISH TARGETS
4042
EMA5 CROSS AND LOCK BELOW 4042WILL OPEN THE FOLLOWING BEARISH TARGET
3964
EMA5 CROSS AND LOCK BELOW 3964 WILL OPEN THE FOLLOWING BEARISH TARGET
3873
EMA5 CROSS AND LOCK BELOW 3873 WILL OPEN THE SWING RANGE
3767
3646
As always, we will keep you all updated with regular updates throughout the week and how we manage the active ideas and setups. Thank you all for your likes, comments and follows, we really appreciate it!
Mr Gold
GoldViewFX

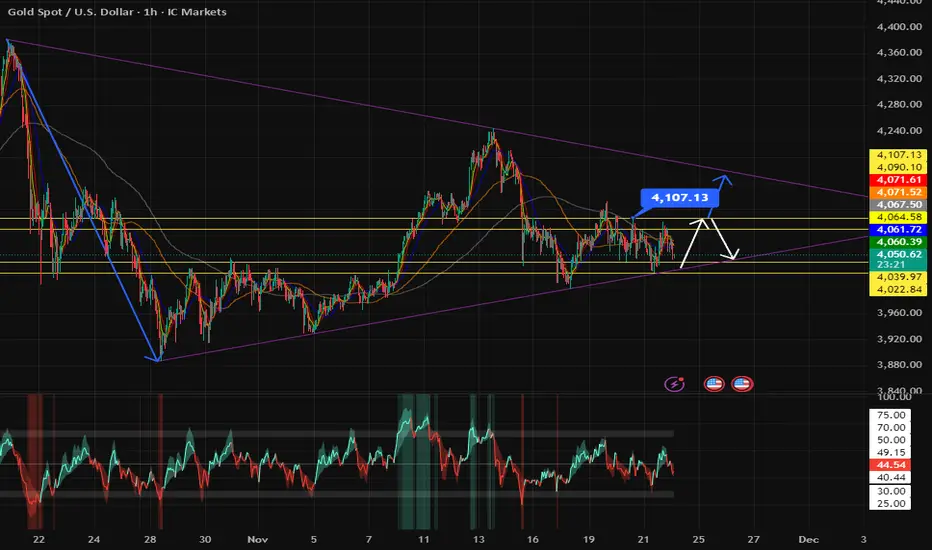
XAUUSD starting a new short-term Bullish LegGold (XAUUSD) is testing today once more its 4H MA50 (blue trend-line). Having held the Higher Lows trend-line two times already since the November 13 pull-back, a second break above the 4H MA50 can technically confirm a quick test of the Lower Highs trend-line of the Triangle. As a result, our short-term Target is 4180 (also just below the 0.618 Fibonacci retracement level).
A closing above the Lower Highs trend-line, potentially means the emergence of a Channel Up (blue), in which case we will re-buy the first 4H pull-back and have a final Target at 4275 (the 0.786 Fib). Long-term we believe Gold is going to have a bearish 2026.
---
** Please LIKE 👍, FOLLOW ✅, SHARE 🙌 and COMMENT ✍ if you enjoy this idea! Also share your ideas and charts in the comments section below! This is best way to keep it relevant, support us, keep the content here free and allow the idea to reach as many people as possible. **
---
💸💸💸💸💸💸
👇 👇 👇 👇 👇 👇

GOLD Bullish Bias! Buy!
Hello,Traders!
GOLD has already rebounded from the rising trendline after clearing internal liquidity, showing renewed bullish order-flow. Expect continuation toward the horizontal buy-side liquidity above.Time Frame 5H.
Sell!
Comment and subscribe to help us grow!
Check out other forecasts below too!
Disclosure: I am part of Trade Nation's Influencer program and receive a monthly fee for using their TradingView charts in my analysis.

XAUUSD: Market Analysis and Strategy for November 24thGold Technical Analysis:
Daily Resistance: 4145, Support: 4000
4-Hour Resistance: 4110, Support: 4022
1-Hour Resistance: 4085, Support: 4040
The weekly chart closed with a doji, putting pressure on short-term bullish sentiment. The consecutive doji closes on the daily chart suggest a slowdown in the short-term upward trend and exacerbate the expectation of consolidation. The upper Bollinger Band resistance continues to move downwards, and the price will need to focus on the 4040 level (the middle Bollinger Band) during the day. The next key level is 4000; a break below this level would warrant a short-term sell-off. If the price can recover above 4085 in the short term, a continued bullish trend is possible, with the 4140/4150 area as another resistance level to watch. Long-term holders can still look for buying opportunities around 3930/3920;
Looking at the 1-hour chart, gold rebounded after a decline in the European session, with the Bollinger Bands narrowing. The focus in the US session will be on the continuation of this rebound, with resistance levels around 4078 and 4092. The short-term range to watch is 4040-4100;
Trading Strategy:
BUY: 4040near
SELL: 4078~4085
More Analysis →

THE KOG REPORTTHE KOG REPORT:
In last week’s KOG Report we gave the potential path as well as the red box defence to look for any reaction in price. We managed to support the lower red box defence giving us a nice long to start the week then resulting in the higher defence holding and giving us an extremely decent short. It was only during the later part of the week we faced some choppy and whipsawing ranging which we decided wasn’t worth committing too much into, so we returned to scalping the red boxes only for the remainder of the week.
A decent week in Camelot, not only on Gold but the numerous other pairs we trade and analyse.
So, what can we expect in the week ahead?
It’s likely to be another week of choppy price action and potential for a range to develop even smaller than we’ve seen in previous sessions. We have the key level of support below again at 4040 while resistance above sits at key level of 4104. Economic news on Tuesday should bring volume and we would expect one of these levels to break open and the range to have accumulated enough to then move us into a clear direction.
We have added the red box defence up and down, ideally wanting a test of that low, so price going up on the open could represent opportunities to attempt the short unless defence is breached. Otherwise, we’ll look to take this into that 4000-3980 levels before we look for any RIPs.
RED BOXES:
Break below 4060 for 4055, 4050, 4041, 4033 and 4010 in extension of the move
Break above 4081 for 4095, 4103, 4120 and 4130 in extension of the move
Please do support us by hitting the like button, leaving a comment, and giving us a follow. We’ve been doing this for a long time now providing traders with in-depth free analysis on Gold, so your likes and comments are very much appreciated.
As always, trade safe.
KOG

How to trade in a range-bound market?Gold remains in a wide-range trading pattern, with the daily chart closing with another doji candlestick. This pattern suggests continued range-bound trading. Today's strategy is to buy low and sell high, as there is still room and demand for further declines. The key resistance level to watch today is around $4098; sell on rallies near this level.
Gold maintains its wide-range trading structure. The daily/weekly charts show a tug-of-war between bulls and bears, with moving averages converging and the price hovering around the middle Bollinger Band. Gold will soon face a directional decision. From a technical perspective, after rebounding to the $4110 high and encountering resistance, gold has fallen again in a stepped pattern, and this area remains a significant resistance zone.
Key Levels:
First Support: 4040, Second Support: 4023, Third Support: 4004
First Resistance: 4090, Second Resistance: 4108, Third Resistance: 4130
Gold Intraday Trading Strategy:
BUY: 4026-4031, SL: 4010, TP: 4050-4060;
SELL: 4095-4100, SL: 4115, TP: 4080-4070;
More Analysis →
XAUUSD – Reading the Market’s Secret Intentions🌐 MARKET CONTEXT
Gold begins the new week with compressed volatility yet maintains a bearish overall structure on H1. Price continues forming Lower Highs → Lower Lows, suggesting Smart Money is still distributing at premium zones while accumulating at deep discount pools.
Current Market Drivers
USD strength remains stable → keeping gold under pressure
Market awaits midweek USD data → early sessions may be liquidity-driven
Institutional flows show no strong bullish commitment yet
Bias for the day:
🔻 Bearish until price reclaims key premium zones with a valid CHoCH.
🔺 BUY setups valid only at deep discount liquidity pools (3996, 4030).
📉 TECHNICAL ANALYSIS (Liquidity + SMC Structure)
Market Structure
H1 Trend: Bearish
Key premium zone above: 4146–4148
Mid-range equilibrium: 4060–4080
Discount demand clusters: 4030 & 3994
Liquidity Observation
Buy-Side Liquidity (BSL):
Above 4146
Above 4071 liquidity wick
Sell-Side Liquidity (SSL):
Below 4030
Below 3994 (major liquidity pocket)
Imbalances / FVG
Strong bearish FVG at 4146–4148
Minor imbalance at 4068–4071
Clear discount imbalance at 4032–4030
Deep liquidity vacuum near 3996–3994
🔑 KEY PRICE ZONES (Clear, Compelling Explanations)
1️⃣ 4148–4146 → Premium Liquidity Trap – Main SELL Zone
This zone contains:
Unmitigated H1 Supply Zone
Heavy BSL resting above recent swing highs
Major bearish FVG fill
➡️ A classic liquidity-engineered premium trap where Smart Money sweeps breakout buyers before reversing aggressively.
2️⃣ 4068–4071 → Mid-Range Liquidity Sweep – SCALP SELL Zone
Features:
Clusters of intraday stops from earlier longs
A small FVG acting as inducement
Positioned near equilibrium → perfect for fakeouts
➡️ Expect quick wicks and sharp rejections, ideal for short, high-precision scalps.
3️⃣ 4032–4030 → Discount Reaction – SCALP BUY Zone
This area offers:
Clean SSL located just beneath
Micro Demand Zone
A common reversal point during bearish cycles
➡️ Excellent for fast BUY scalps with tight risk, especially during London manipulation.
4️⃣ 3996–3994 → Deep Discount Reversal – GOLD BUY Zone
A high-value accumulation zone:
Contains significant higher-timeframe SSL
Aligns with deep-discount structure
Frequently used by Smart Money to reload long positions
➡️ If price taps this zone, a strong bullish rebound is very likely.
⚙️ TRADE SETUPS (High Precision Entries)
✔️ SELL GOLD – Main Premium Short
Entry: 4148–4146
Stoploss: 4154
TP1: 4120
TP2: 4080
TP3: 4030
Logic: BSL sweep → FVG mitigation → bearish displacement.
✔️ SELL SCALP – Mid-Range Sweep
Entry: 4068–4071
Stoploss: 4077
TP1: 4050
TP2: 4038
Logic: Engineered liquidity → immediate rejection expected.
✔️ BUY SCALP – Discount Liquidity Reaction
Entry: 4032–4030
Stoploss: 4024
TP1: 4045
TP2: 4068
Logic: SSL sweep → CHoCH likelihood → intraday rebound.
✔️ BUY GOLD – Deep Discount Long
Entry: 3996–3994
Stoploss: 3988
TP1: 4020
TP2: 4060
TP3: 4140
Logic: Strong institutional accumulation zone → potential formation of H1 higher low.
🧠 SESSION NOTES
Avoid trading mid-range to reduce chop exposure.
Best moves form after liquidity sweeps in London or during NY displacement.
Confirm entries with M5/M15 CHoCH + displacement.
Never buy inside premium zones; never sell inside deep discount zones.
🏁 CONCLUSION
Gold maintains a bearish structure, favoring SELL setups at premium liquidity traps 4146–4148 and 4068–4071.
BUY setups remain valid only at strong discount zones 4030 and 3994, where liquidity supports a clean bullish reaction.
Let liquidity form the trap. Then strike with precision.

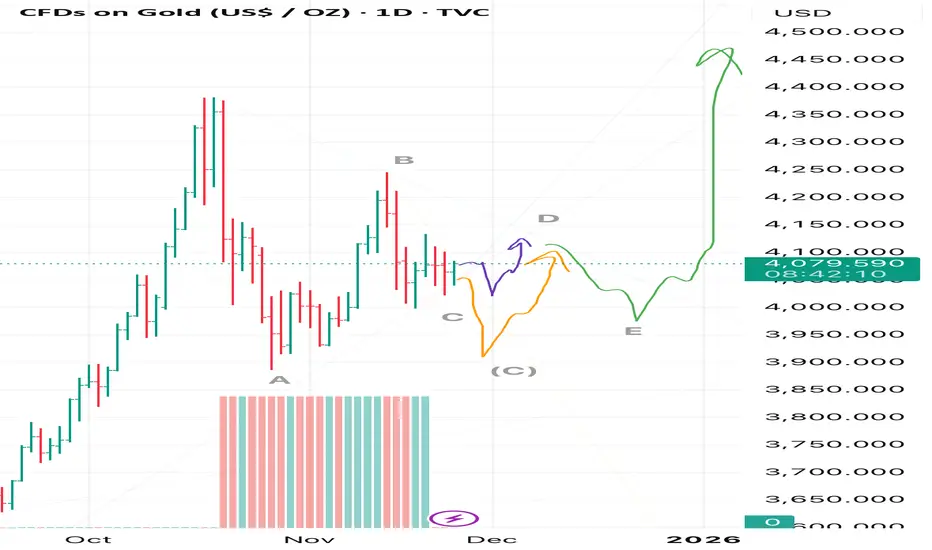
Gold — ABCDE Triangle Formation With Bullish Breakout AheadIn my view, gold is forming a corrective ABCDE triangle with an expected breakout to the upside🚀
At the moment, wave C is either still developing or it is almost completed, and wave D may soon begin. I marked these two scenarios with orange🟠and purple🟣 arrows respectively.
However, I also do not rule out the possibility that this structure may turn out to be a flat ABC correction rather than a triangle, as I currently expect.
In that case, price should first move according to the orange scenario.
After the correction completes, I expect price to follow the green path, taking gold above its recent all-time high🌱
And between us — I personally expect gold to eventually reach above 8000 😱
But for now, let’s patiently wait for this current structure to finish forming.
💬Share your thoughts in the comments:
Do you think wave C is already complete, or will gold dip lower according to the orange path?
I’m curious to hear your view.
GOLD: Rate-Cut Odds Hit 74% — Breakout Coming?FX:XAUUSD bounced from the 4043 support zone, maintaining moderate volatility as markets await a packed week of U.S. economic data alongside rising geopolitical uncertainty. Traders remain focused on the 4030–4113 trading range.
The probability of a December Fed rate cut has increased to 74% following comments from New York Fed President John Williams.
On the geopolitical front, any signal of de-escalation in the Russia–Ukraine conflict may trigger corrective pressure on the metal.
Key Events to Watch This Week
~ U.S. PPI & Retail Sales
~ Q3 GDP & Core PCE Index
~ Existing & New Home Sales
Gold remains highly sensitive to Fed communication and geopolitical developments.
Stronger U.S. data could reduce easing expectations, while rising rate-cut odds continue to limit the downside.
A decisive breakout is likely after inflation and GDP figures.
Technical Outlook
Gold maintains bearish momentum while trading below 4087, targeting 4059, and then 4043.
However, price may retest the resistance zone at 4099–4113 before resuming a bearish move.
A 15-minute close above 4087 will support a push toward 4099 → 4113.
Key Levels
Pivot Line: 4087
Support: 4059 · 4043 · 4030
Resistance: 4099 · 4113 · 4133
