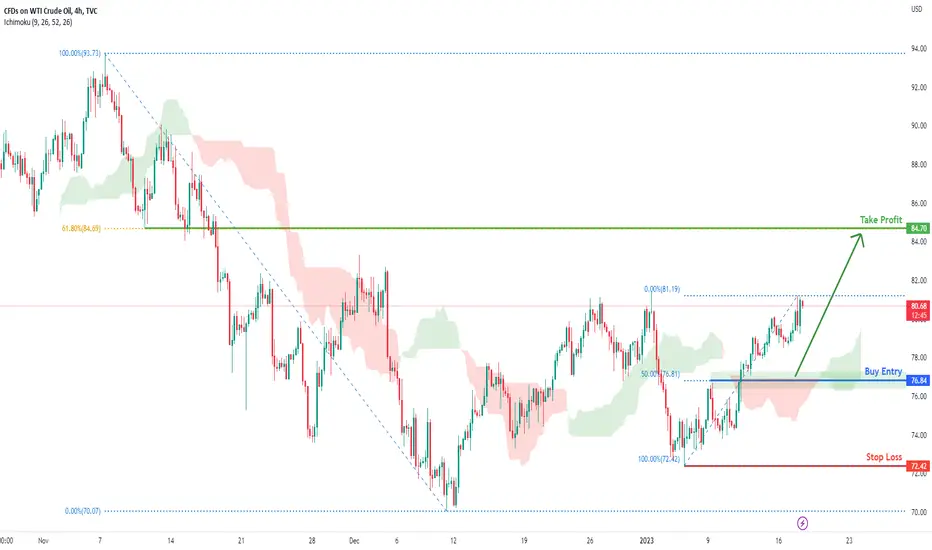
USOIL Potential for Bullish Continuation| 19th January 2023Looking at the H4 chart, my overall bias for USOIL is bullish due to the current price being above the Ichimoku cloud , indicating a bullish market.
Looking for a retracement pullback buy entry at 76.84, where the 50% Fibonacci line is. Stop loss will be at 72.42, where the recent swing low is. Take profit will be at 84.70, where the 61.8% Fibonacci line is.
Any opinions, news, research, analyses, prices, other information, or links to third-party sites contained on this website are provided on an "as-is" basis, as general market commentary, and do not constitute investment advice. The market commentary has not been prepared in accordance with legal requirements designed to promote the independence of investment research, and it is therefore not subject to any prohibition on dealing ahead of dissemination. Although this commentary is not produced by an independent source, FXCM takes all sufficient steps to eliminate or prevent any conflicts of interest arising out of the production and dissemination of this communication. The employees of FXCM commit to acting in the clients' best interests and represent their views without misleading, deceiving, or otherwise impairing the clients' ability to make informed investment decisions. For more information about the FXCM's internal organizational and administrative arrangements for the prevention of conflicts, please refer to the Firms' Managing Conflicts Policy. Please ensure that you read and understand our Full Disclaimer and Liability provision concerning the foregoing Information, which can be accessed on the website.
Commodity

Correlation – Crude Oil & CPIStudies indicated Crude Oil is the best indicator to track the current inflation.
It is also a leading indicator to inflation numbers? If that is true, we will have to track the crude oil prices very closely.
Content:
i. The most inline commodity with CPI
ii. Can the Crude Oil track CPI?
iii. Direction of Crude Oil
Crude Oil Futures
Minimum fluctuation
0.01 = $10
0.10 = $100
1.00 = $1,000
10.00 = $10,000
Disclaimer:
• What presented here is not a recommendation, please consult your licensed broker.
• Our mission is to create lateral thinking skills for every investor and trader, knowing when to take a calculated risk with market uncertainty and a bolder risk when opportunity arises.
CME Real-time Market Data help identify trading set-ups in real-time and express my market views. If you have futures in your trading portfolio, you can check out on CME Group data plans available that suit your trading needs www.tradingview.com

USOIL Potential for Bullish Continuation| 18th January 2023Looking at the H4 chart, my overall bias for USOIL is bullish due to the current price being above the Ichimoku cloud , indicating a bullish market. Looking for a retracement pullback buy entry at 76.84, where the 50% Fibonacci line is. Stop loss will be at 72.42, where the recent swing low is. Take profit will be at 84.70, where the 61.8% Fibonacci line is.
Any opinions, news, research, analyses, prices, other information, or links to third-party sites contained on this website are provided on an "as-is" basis, as general market commentary, and do not constitute investment advice. The market commentary has not been prepared in accordance with legal requirements designed to promote the independence of investment research, and it is therefore not subject to any prohibition on dealing ahead of dissemination. Although this commentary is not produced by an independent source, FXCM takes all sufficient steps to eliminate or prevent any conflicts of interest arising out of the production and dissemination of this communication. The employees of FXCM commit to acting in the clients' best interests and represent their views without misleading, deceiving, or otherwise impairing the clients' ability to make informed investment decisions. For more information about the FXCM's internal organizational and administrative arrangements for the prevention of conflicts, please refer to the Firms' Managing Conflicts Policy. Please ensure that you read and understand our Full Disclaimer and Liability provision concerning the foregoing Information, which can be accessed on the website.
USOIL Potential for Bullish Continuation Looking at the H4 chart, my overall bias for USOIL is bullish due to the current price being above the Ichimoku cloud, indicating a bullish market. Looking for a buy entry at 77.90, where the 23.6% Fibonacci line is. Stop loss will be at 72.42, where the recent swing low is. Take profit will be at 84.70, where the 61.8% Fibonacci line is.
Please be advised that the information presented on TradingView is provided to Vantage (‘Vantage Global Limited’, ‘we’) by a third-party provider (‘Everest Fortune Group’). Please be reminded that you are solely responsible for the trading decisions on your account. There is a very high degree of risk involved in trading. Any information and/or content is intended entirely for research, educational and informational purposes only and does not constitute investment or consultation advice or investment strategy. The information is not tailored to the investment needs of any specific person and therefore does not involve a consideration of any of the investment objectives, financial situation or needs of any viewer that may receive it. Kindly also note that past performance is not a reliable indicator of future results. Actual results may differ materially from those anticipated in forward-looking or past performance statements. We assume no liability as to the accuracy or completeness of any of the information and/or content provided herein and the Company cannot be held responsible for any omission, mistake nor for any loss or damage including without limitation to any loss of profit which may arise from reliance on any information supplied by Everest Fortune Group.

USOIL Potential for Bullish Continuation| 17th January 2023Looking at the H4 chart, my overall bias for USOIL is bullish due to the current price being above the Ichimoku cloud, indicating a bullish market. Looking for a retracement pullback buy entry at 77.90, where the 38.2% Fibonacci line is. Stop loss will be at 72.42, where the recent swing low is. Take profit will be at 84.70, where the 61.8% Fibonacci line is.
Any opinions, news, research, analyses, prices, other information, or links to third-party sites contained on this website are provided on an "as-is" basis, as general market commentary, and do not constitute investment advice. The market commentary has not been prepared in accordance with legal requirements designed to promote the independence of investment research, and it is therefore not subject to any prohibition on dealing ahead of dissemination. Although this commentary is not produced by an independent source, FXCM takes all sufficient steps to eliminate or prevent any conflicts of interest arising out of the production and dissemination of this communication. The employees of FXCM commit to acting in the clients' best interests and represent their views without misleading, deceiving, or otherwise impairing the clients' ability to make informed investment decisions. For more information about the FXCM's internal organizational and administrative arrangements for the prevention of conflicts, please refer to the Firms' Managing Conflicts Policy. Please ensure that you read and understand our Full Disclaimer and Liability provision concerning the foregoing Information, which can be accessed on the website.

Playing Commodities Super-Cycle with GSG /2:1 Reward/Risk rationGSG is a nice way to play Commodities Super-Cycle in a diversified style.
at current level the risk to reward is about 1/2, which makes it attractive long position.

Soybeans Channeling Higher Towards 1800The main view of this trade idea is on the Daily Chart.
The commodity Soybeans appears to have found some support around the 1350 price level. The commodity is in a trend channel higher and once that trend channel holds, could rally towards 1800 over the next couple of months. This view will be negated if Soybeans fall below 1420.
Technical Indicators
The technical indicators are aligned to this view. Soybean’s Supertrend has been in a buy mode since the end of October 2022. The commodity has been above its respective Moving Average, the 50-Day MA, since November 1st, 2022. The Awesome Oscillator is above 0 and green while the RSI is above 50 and increasing.
The intra-day trend following indicators of the Soybeans also display uptrends in the 15-Min, 2-Hour and 4-Hour time frames. Short to medium term support is seen around the 1425.
Recommendation
The recommendation will be to go long at market, with a stop loss at 1420 and a target of 1800. This produces a risk/reward ratio of 2.45.
Disclaimer
The views expressed are mine and do not represent the views of my employers and business partners. Persons acting on these recommendations are doing so at their own risk. These recommendations are not a solicitation to buy or to sell but are for purely discussion purposes.
At the time of writing, I have exposure to Soybean futures.

SILVER - Still Bearish? 🥈Hello TradingView Family / Fellow Traders. This is Richard, as known as theSignalyst.
SILVER has been overall bearish trading inside the red falling broadening wedge, and it is currently retesting the upper red trendline.
Moreover, the zone 25-26 is a strong resistance zone .
📌So the highlighted purple circle is a strong area to look for sell setups as it is the intersection of the blue resistance zone and upper red trendline. (acting as non-horizontal resistance)
📕As per my trading style:
As SILVER is around the purple circle zone, I will be looking for bearish reversal setups (like a double top pattern, trendline break , and so on...)
“Although gold and silver are not by nature money, money is by nature gold and silver.” – Karl Marx
Always follow your trading plan regarding entry, risk management, and trade management.
Good luck!
🗒All Strategies Are Good; If Managed Properly!
~Rich

SB1! Potential For Bearish ContinuationLooking at the H4 chart, my overall bias for SB1! is bearish due to the current price being below the Ichimoku cloud, indicating a bearish market. Looking for a sell entry at 20.10, where the 50% Fibonacci line is. Stop loss will be at 20.49, slightly above where the 61.8% Fibonacci line and minor high is. Take profit will be at 18.94, where the 50% Fibonacci line is.
Please be advised that the information presented on TradingView is provided to Vantage (‘Vantage Global Limited’, ‘we’) by a third-party provider (‘Everest Fortune Group’). Please be reminded that you are solely responsible for the trading decisions on your account. There is a very high degree of risk involved in trading. Any information and/or content is intended entirely for research, educational and informational purposes only and does not constitute investment or consultation advice or investment strategy. The information is not tailored to the investment needs of any specific person and therefore does not involve a consideration of any of the investment objectives, financial situation or needs of any viewer that may receive it. Kindly also note that past performance is not a reliable indicator of future results. Actual results may differ materially from those anticipated in forward-looking or past performance statements. We assume no liability as to the accuracy or completeness of any of the information and/or content provided herein and the Company cannot be held responsible for any omission, mistake nor for any loss or damage including without limitation to any loss of profit which may arise from reliance on any information supplied by Everest Fortune Group.

Copper (HG) Rallies in Nesting Impulse According to Elliott WaveCopper (HG) rally from 9.28.2022 low is unfolding as a nesting impulse Elliott Wave structure. A nest is a series of 1-2-((i))-((ii)) which is an extended version of an impulsive structure. Up from 9.28.2022 low, wave 1 ended at 3.96 and wave 2 pullback ended at 3.5410. Wave 3 is currently in progress with internal subdivision as another impulse in lesser degree. Up from wave 2, wave ((i)) ended at 3.929. The 1-hour chart below shows pullback in wave ((ii)) ended at 3.708. The metal has extended higher again in wave ((iii)).
Up from wave ((ii)), wave i ended at 3.865, and pullback in wave ii ended at 3.7985. The metal extends higher again in wave iii towards 3.988, pullback in wave iv ended at 3.932, and final leg wave v ended at 4.044 which completed wave (i). Pullback in wave (ii) then ended at 3.987. The metal extends higher again in wave (iii) towards 4.186 and pullback in wave (iv) ended at 4.129. Expect wave (v) higher to complete soon with a few more high and that should complete wave ((iii)) in higher degree. Afterwards, the metal should pullback in wave ((iv)) to correct cycle from 1.4.2023 low before it resumes higher. Near term, as far as pivot at 3.708 low stays intact, expect pullback to find support in 3, 7, or 11 swing for further upside.

The Truth About Gold (And How To Profit From It)Even if you never bought an ounce of the shiny yellow rock, Gold can gives us valuable information over time. The fact that gold was literally money for much of the worlds history and that banks still hold should tell you it still matters.
Lets discuss gold concepts and make sure we stay aware of how gold has behaved in the past. hope you enjoy the video!

ZR1! Potential for Bullish RiseLooking at the H4 chart, my overall bias for ZR1! is bullish due to the current price crossing above the Ichimoku cloud, indicating a bullish market. Price is also along a bullish trend line. Looking for a buy entry at 18.050, where the 61.8% Fibonacci line and recent high is to ride the bullish momentum. Stop loss will be at 17.600, slightly below where the 50% Fibonacci line is. Take profit will be at 18.530, where the previous swing high is.
Please be advised that the information presented on TradingView is provided to Vantage (‘Vantage Global Limited’, ‘we’) by a third-party provider (‘Everest Fortune Group’). Please be reminded that you are solely responsible for the trading decisions on your account. There is a very high degree of risk involved in trading. Any information and/or content is intended entirely for research, educational and informational purposes only and does not constitute investment or consultation advice or investment strategy. The information is not tailored to the investment needs of any specific person and therefore does not involve a consideration of any of the investment objectives, financial situation or needs of any viewer that may receive it. Kindly also note that past performance is not a reliable indicator of future results. Actual results may differ materially from those anticipated in forward-looking or past performance statements. We assume no liability as to the accuracy or completeness of any of the information and/or content provided herein and the Company cannot be held responsible for any omission, mistake nor for any loss or damage including without limitation to any loss of profit which may arise from reliance on any information supplied by Everest Fortune Group.

CT1! Potential For Bearish DropLooking at the H4 chart, my overall bias for CT1! is bearish due to the current price being below the Ichimoku cloud, indicating a bearish market. Looking for a sell entry at 84.58, where the 23.6% Fibonacci line is. Stop loss will be at 87.97, where the 78.6% Fibonacci line is. Take profit will be at 79.78, where the 50% Fibonacci line and liquidity hotspots are.
Please be advised that the information presented on TradingView is provided to Vantage (‘Vantage Global Limited’, ‘we’) by a third-party provider (‘Everest Fortune Group’). Please be reminded that you are solely responsible for the trading decisions on your account. There is a very high degree of risk involved in trading. Any information and/or content is intended entirely for research, educational and informational purposes only and does not constitute investment or consultation advice or investment strategy. The information is not tailored to the investment needs of any specific person and therefore does not involve a consideration of any of the investment objectives, financial situation or needs of any viewer that may receive it. Kindly also note that past performance is not a reliable indicator of future results. Actual results may differ materially from those anticipated in forward-looking or past performance statements. We assume no liability as to the accuracy or completeness of any of the information and/or content provided herein and the Company cannot be held responsible for any omission, mistake nor for any loss or damage including without limitation to any loss of profit which may arise from reliance on any information supplied by Everest Fortune Group.

XAUUSD - Detailed Video Top-Down Analysis!Hello TradingView Family / Fellow Traders. This is Richard, as known as theSignalyst.
Here is a detailed update top-down analysis for XAUUSD.
Which scenario do you think is more likely to happen? and Why?
Always follow your trading plan regarding entry, risk management, and trade management.
Good Luck!.
All Strategies Are Good; If Managed Properly!
~Rich

USOIL SELL call: take profit 70-68-62USOIL - Swing signal: sell 74-75, sl 78, Tp 70-68
Technical analysis is based on Fibo + SnR + Price action

Silver on SHARK Silver has shark on daily timefram with perfect BC resiprocal. lets wait for swap and retest for final target.


GOLD - Around Strong Resistance! 🥇Hello TradingView Family / Fellow Traders. This is Richard, as known as theSignalyst.
GOLD is overall bullish trading inside the rising red channel, however, it is currently retesting the upper red trendline.
Moreover, the zone 1870 - 1900 is a strong resistance zone .
So the highlighted purple circle is a strong area to look for sell setups as it is the intersection of the blue resistance zone and upper red trendline. (acting as non-horizontal resistance)
As per my trading style:
As GOLD is around the upper purple circle zone, I will be looking for bearish reversal setups (like a double top pattern, trendline break , and so on...)
Always follow your trading plan regarding entry, risk management, and trade management.
Good luck!
All Strategies Are Good; If Managed Properly!
~Rich

Naturalgas on reversalNaturalgas on reversal due to cypher completion and also as per RTM a very good level to long now.

Uranium no war no pump | Dump is comingUranium world dont have war for now. so downtime for that commodity.

XAUUSD Outlook 4th Jan 2023A common question I receive while coaching retail traders: "Why did gold move up, while dxy was going up" or "why didn't gold drop, when dxy rose"
While Gold and the DXY have an inverse relationship, remember that it isn't perfectly inverse. This means that it gold does not have to drop immediately as the dxy rises. There could be a delay reaction, due to the trend or other fundamental factors.
Today, Gold climbed strongly from the 1823 price level to touch the 1850 price level twice before trading lower again.
With the price action showing a rejection of the move higher, look for a deeper correction on Gold (especially if the DXY continues to strengthen), with the next lower key support levels at 1820 and 1800

XAUUSD 1:13 RR Swing Trade capturedHello Everyone. Lamda team recently captured a beautiful high probability swing trade after tapping on the extreme order block. As soon as the price mitigated it, we switched to M5 for CHoCH based entry. Please pay careful attentions to the markups on the chart.
Happy trading
Team Lamda

XAUUSD - Video Top-Down Analysis!Hello TradingView Family / Fellow Traders. This is Richard, as known as theSignalyst.
Here is a detailed update top-down analysis for XAUUSD .
Which scenario do you think is more likely to happen? and Why?
Always follow your trading plan regarding entry, risk management, and trade management.
Good Luck!.
All Strategies Are Good; If Managed Properly!
~Rich
