BTC 15m Update — post-breakdown bouncePrice is reacting off the 5m Bull FVG 88.4–88.6k after the breakdown below 89,945.
This bounce is mitigation until we reclaim structure.
Key levels on my chart: 90,319 / 89,945 / 89,450 / 89,279.
⸻
Scenario ladder (with SL/TP)
A) Bull reclaim 89,279 (first breakdown-fail signal)
Trigger: 15m close > 89,279 + next 15m holds > 89,279
Entry: hold-close or first retest from above
SL: below the reclaim swing low (or conservative: below 88,600 FVG top)
TPs: 89,450 → 89,600 → 89,945 → 90,319
⸻
B) Bull reclaim 89,450 (stronger shift)
Trigger: 15m close > 89,450 + hold
Entry: retest of 89,450 from above (best)
SL: below 89,279 (or conservative: below 88,600)
TPs: 89,945 → 90,319 (stretch: higher 1h FVG zone if you track it)
⸻
C) Bear retest-fail at 89,279 (sell the bounce)
Trigger: price tags 89,279, then 15m closes back < 89,279 (rejection)
Entry: rejection close / next pullback
SL: above rejection high (or structural: above 89,450)
TPs: 88,600 / 88,400 / 88,000 (lower DBR)
⸻
D) Bear continuation (FVG fails)
Trigger: 15m close < 88,400 + continued acceptance below
Entry: retest of 88,400–88,600 from below (best)
SL: above 88,600
TPs: 88,000 / 87,600
⸻
Rule
No mid-box guessing: I act on close + hold, not wicks.
Reclaim 89,279 / 89,450 = bounce may evolve into reversal.
Fail there = continuation.
Continuation

$YM Long the pullback.In the Dow today, we're coming off yestserday's fresh breakout to the upside, which makes us bullish for today.
We're simply waiting for a pullback on the 30 minute chart. We want a touch of the Weekly VWAP +1 standard deviation. Stop loss just above Weekly-VWAP.
Manage your risk and wait for the real pullback! Happy trading.

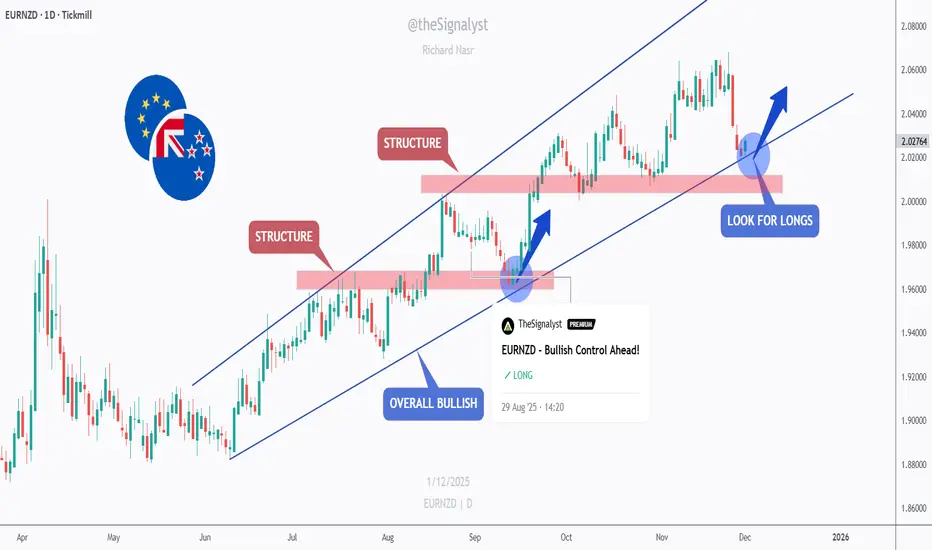
EURNZD - Bulls Eyeing the Structure Zone... Again!📈EURNZD remains overall bullish, moving cleanly inside its rising channel. Each dip toward the lower bound has acted as a strong continuation zone, with buyers consistently stepping in to drive the next upward wave.
🏹As price approaches the lower trendline and the red structure zone, we will be looking for trend-following longs. This area has served as a key support multiple times, making it a high-probability level for the bulls to re-enter the market.
⚔️As long as EURNZD holds above this structure, the bullish trend remains intact and a new push toward higher highs becomes the most likely scenario. Only a confirmed break below the structure would weaken the bullish outlook.
Now we wait for the reaction at structure… will the bulls defend it once again? 🤔
⚠️ Disclaimer: This is not financial advice. Always do your own research and manage risk properly.
📚 Stick to your trading plan regarding entries, risk, and management.
Good luck! 🍀
All Strategies Are Good; If Managed Properly!
~Richard Nasr
Downfall of DXY?!? Bears Flag The Possibility!Here on TVC:DXY we can see that last week it ended in a Bearish Breakout of an Ascending Channel, the perfect Bear Flag scenario!
Now price closed the week on the ascent possibly being the Retest of the Breakout.
If the Channel holds price on a successful retest, TVC:DXY will drop!
Fundamentally, USD has impactful news all week this week. Even so, with limited data from back logged events not available until after next FOMC Meeting, this means the Federal Reserve will continue to make decisions in "the dark" and with a high probability of a Rate Cut coming in December!
If the Bear Flag is successful in being a continuation pattern set-up, we could see price drop down to the prior Low of November under 99!

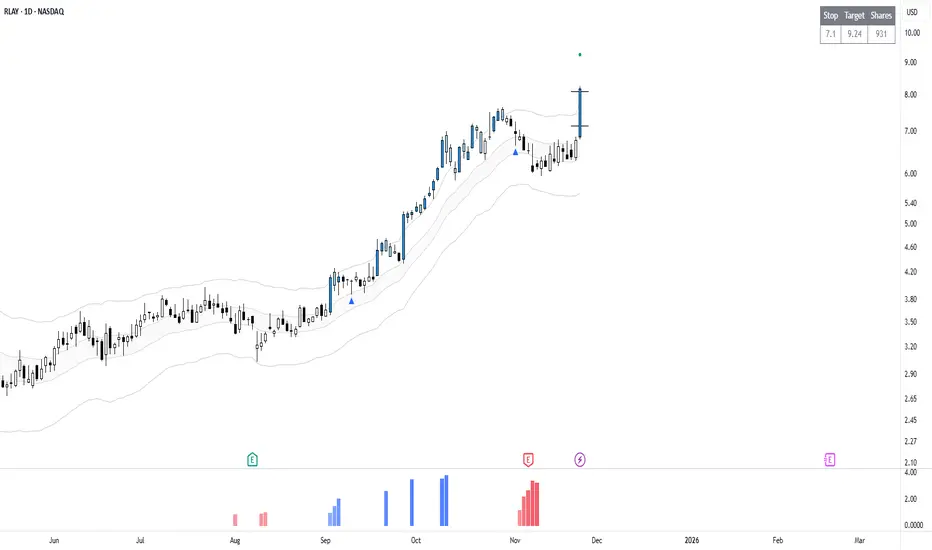
RLAY Trade ReviewThis approach is based on pullbacks. A pullback is a short-term counter-move in response to a strong impulse move. It is a controlled reversion towards the mean, which offers a structured approach to enter in case of momentum resumption. There is no precise execution point, rather approximation and patience.
A weekend watchlist is created using objective criteria and discretion. Alerts are placed and monitored during the week, with entries taken either on a valid pullback condition or in response to indication of continuation.
Watchlist: IMTX, NEE, FDMT, FE, EVRG, RLAY.
FE has been active since November 17 and has bracket orders. No interference.
RLAY Trade
Entry: 7.14
Stop: 2.25 ATR
Target: 1R
Risk: 1% of Account
The target was reached within the same session. Closed at 8.09 for a full 1R result.
If you want more trade reviews, weekend watchlists, or how to build a simple process, comment and let me know.
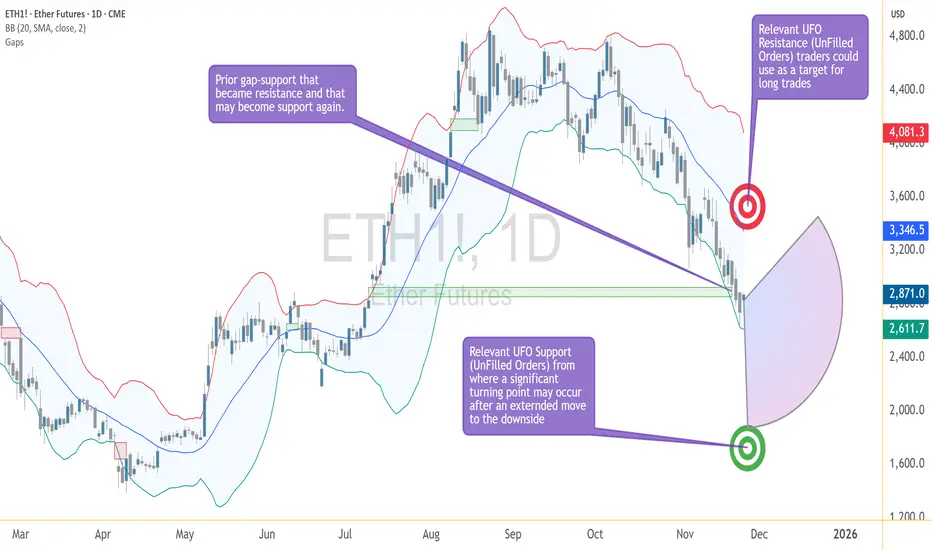
Crypto Walking the Edge: Will the Band Snap or Stretch Lower?Ether Futures (ETH) continue to tell a story of controlled pressure — one that traders have seen before across many markets, but rarely with this level of composure. The selling has been persistent, yet measured, and despite the depth of the decline, Ether has remained remarkably disciplined within its volatility structure. In short, price is walking the lower Bollinger Band — and doing it with intent.
The Market’s Controlled Descent
When an asset walks the lower Bollinger Band, it signals a market under steady directional momentum. The band represents volatility boundaries built around a moving average; hugging its lower edge reflects consistent downside force without capitulation. In Ether’s case, the message is clear — bears are in charge, but not panicking.
This pattern of orderly decline can be deceptive. It often convinces traders that “it can’t go lower” simply because volatility seems contained. Yet, in technical behavior, containment isn’t comfort — it’s momentum management. Until the market detaches from the band and closes above the midline, downside potential remains valid.
The Downside Magnet — UFO Support at 1883.0
Beneath the current price structure lies a level of particular interest: 1883.0. This is not just another number on the chart; it marks a UFO (UnFilled Orders) zone — an area where unexecuted buy orders from prior trading sessions may still be sitting.
Such levels often act as demand magnets. Price gravitates toward them as liquidity seeks to rebalance. If ETH continues its gradual descent, 1883.0 could act as a “final test” of demand strength. Traders currently short may view this area as a logical place to take profits or reduce exposure, while contrarian participants might monitor it for early signs of stabilization.
Walking the Edge — Bollinger Band Dynamics
The Bollinger Band is more than a volatility envelope; it’s a behavioral tool. Price hugging the lower band isn’t a reversal signal on its own. It shows persistent imbalance — sellers are comfortable pressing until they meet true counterflow demand.
The key observation isn’t where Ether trades, but how it interacts with the band:
If the band widens while Ether stays glued to its edge, volatility expansion favors continuation.
If the band narrows and Ether starts oscillating away from it, compression signals the potential for reversal.
At present, Ether remains on the outer lane — still walking the edge, with no confirmed volatility squeeze yet in play.
The Reversal Trigger — The Gap Between 2853.5–2769.0
Ether’s chart carries memory — and that memory is marked by the closure of a previously open gap between 2853.5 and 2769.0. Gaps represent unbalanced zones where the market skipped transactions, often leaving behind psychological resistance.
As long as ETH remains below 2769.0, bearish pressure dominates. A decisive close through the 2853.5 boundary would, however, suggest sellers have lost control. That event could flip the zone from resistance to support — the technical definition of a reversal confirmation.
Until that happens, Ether continues to operate in a bearish environment within its Bollinger framework, respecting lower boundaries and testing demand without capitulation.
The Upside Magnet — UFO Resistance at 3376.5
If the market does achieve a confirmed reversal through the gap zone, the next structural target stands near 3376.5. This region contains a UFO resistance cluster, where unfilled sell orders may wait to re-engage.
This becomes the “upside magnet” in the event of a bullish shift. Not as a forecast, but as a conditional marker — if price proves it can break through 2853.5, the 3376.5 zone becomes the next logical test for momentum sustainability.
Case Study: Risk Structure and Trade Framing
The beauty of futures markets lies in flexibility. Traders can define clear structural zones, build conditional scenarios, and design reward-to-risk ratios before any entry occurs. Ether’s chart currently offers two educational case studies:
Scenario 1 — Continuation Setup
If ETH continues trading below 2769.0, the bearish structure remains intact. Traders could study how price behaves as it approaches 1883.0 to understand profit-taking dynamics or potential trend exhaustion.
Scenario 2 — Reversal Setup
If ETH breaks and closes above 2853.5, the tone changes. It implies the market has absorbed overhead supply, opening the path toward 3376.5. In this case, risk would typically be defined below the reclaimed gap zone, maintaining a controlled risk ratio.
Whichever scenario unfolds, the discipline lies not in prediction but in preparation — in defining “if this, then that” logic.
Contract Specifications
To understand how traders express these views, it helps to revisit how Ether Futures work on CME.
Ether Futures (ETH)
Contract size: 50 Ether with a minimum tick: 0.25 per Ether = $25 per contract
Trading hours: Nearly 24 hours a day, Sunday to Friday, on CME Globex
Margin requirement: approximately $44,000 per contract (subject to changes)
For traders seeking smaller capital exposure, CME also lists Micro Ether Futures (MET) — 1/500th the size of the standard contract. This smaller format offers precision for testing setups, scaling positions, or managing margin during high volatility periods. Importantly, both ETH and MET track the same underlying price behavior, allowing consistent technical interpretation across sizes.
Managing Risk — Beyond Price Targets
Regardless of contract size, effective futures trading is a balance between conviction and constraint. Every trade requires three coordinates before execution:
Entry — based on objective price structure or confirmation.
Exit — determined by invalidation, not emotion.
Size — calibrated to volatility and margin.
A well-structured plan incorporates all three. For instance, a trader eyeing ETH’s move toward 1883.0 should define exit conditions before entry — not after volatility spikes. The same logic applies if Ether were to reclaim 2853.5 and aim higher; stop placement must be systematic, not spontaneous.
Ether Futures in Market Context
Ether’s futures market has become one of the clearest barometers of institutional sentiment in crypto. It reflects not retail enthusiasm but structured positioning, hedging, and liquidity management. The current price behavior — a slow, calculated descent — signals strategic repositioning rather than panic liquidation.
This distinction matters. Markets driven by liquidation collapse violently and rebound sharply. Markets driven by reallocation, like the current Ether environment, tend to evolve gradually — a series of tests, pauses, and measured reactions. Recognizing this tempo helps traders align their strategies with the rhythm of institutional order flow.
Summary — The Market Still Walking the Edge
Ether’s structure can be summarized in three key technical zones:
1883.0: Demand magnet and potential exhaustion level.
2853.5–2769.0: The gap resistance band — critical reversal gate.
3376.5: Major resistance cluster and next test if reversal unfolds.
As long as Ether remains below the gap zone, momentum remains under bearish control. If it trades through and holds above, a structural shift may begin. Until then, the market keeps “walking the edge” — respecting volatility, testing support, and waiting for conviction.
When charting futures, the data provided could be delayed. Traders working with the ticker symbols discussed in this idea may prefer to use CME Group real-time data plan on TradingView: www.tradingview.com - This consideration is particularly important for shorter-term traders, whereas it may be less critical for those focused on longer-term trading strategies.
General Disclaimer:
The trade ideas presented herein are solely for illustrative purposes forming a part of a case study intended to demonstrate key principles in risk management within the context of the specific market scenarios discussed. These ideas are not to be interpreted as investment recommendations or financial advice. They do not endorse or promote any specific trading strategies, financial products, or services. The information provided is based on data believed to be reliable; however, its accuracy or completeness cannot be guaranteed. Trading in financial markets involves risks, including the potential loss of principal. Each individual should conduct their own research and consult with professional financial advisors before making any investment decisions. The author or publisher of this content bears no responsibility for any actions taken based on the information provided or for any resultant financial or other losses.
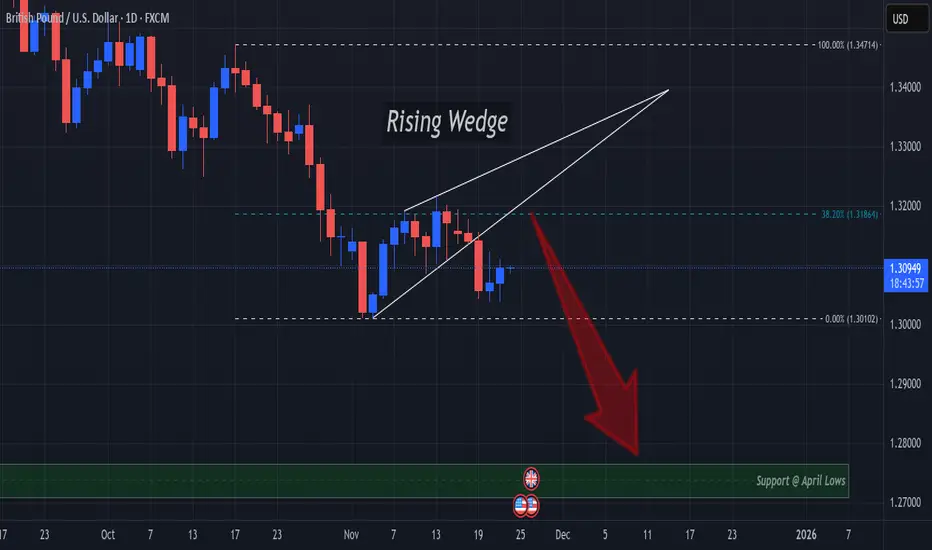
Rising Wedge Breakout Spells Decline Continuation For GUFX:GBPUSD delivered a Breakout of A Rising Wedge to end the week last week!
Next, we should suspect a Retest of this Breakout @ the 38.2% Retracement level around 1.31864.
This level proved to hold price below it through the formation of the pattern and would serve as a great area of opportunity to short the pair and ride Price down!
If the Retest of the Breakout is successful, Price would next find Support at the April Lows around the 1.28 - 1.27 area!
Fundamentally its a heavy week for USD with events for GBP littered throughout so keep a close eye on how the results end up affecting the markets!
Continue OF Silver longThis is the updated chart of SILVER long that i posted 3 days back.
Same conditions still intact. A breakout from this pattern can push silver to 156000 Levels.
Keep a check on the chart and the pattern on 4 hour Timeframe of MCX SILVER.
Disclaimer- This is just for educational purpose.
Jai Shree Ram.

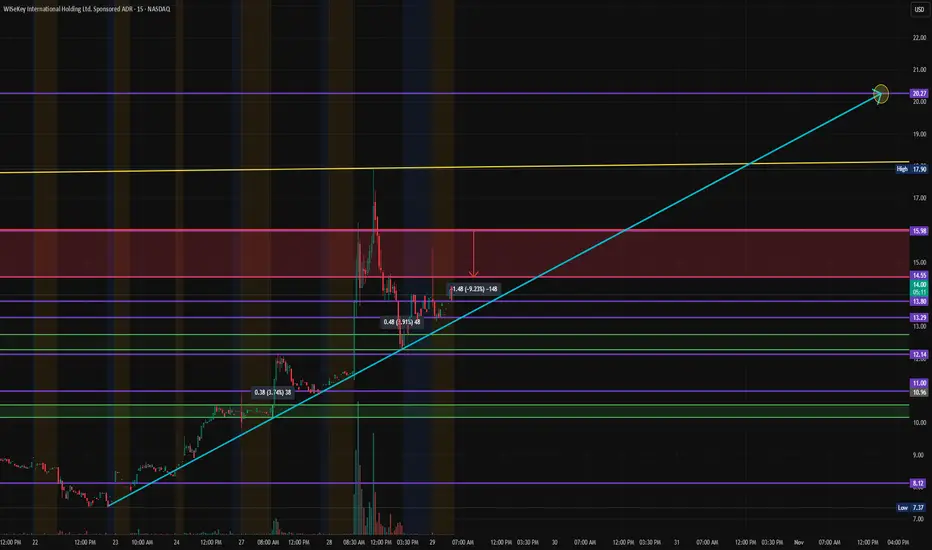
$WKEY – Testing Heavy Resistance Before the Next Quantum Leap?NASDAQ:WKEY is pressing back into the key $14.55–$15.98 resistance zone after a massive short-term run from the $7.37 base.
We saw significant sell volume hit that region during the last test — but price continues to grind higher along the trendline, showing notable strength despite prior supply.
A clean breakout above $15.98 could open the door to $17.90, with an extension target of $20.27 if momentum carries into November.
This aligns with the long-term projection channel shown on the chart.
🧩 Technical Outlook
Support: $13.29 → $12.14 → $11.00
Resistance: $15.98 → $17.90 → $20.27
Trend: Short-term bullish continuation pattern forming higher lows.
Volume: Noticeable absorption around $14.50–$15.50; sellers active but buyers defending the uptrend line.
Momentum Indicator: RSI currently in the upper 70s, showing overbought but persistent strength — typical of trending breakouts.
The next few sessions will be key — either NASDAQ:WKEY consolidates beneath $15.98 or rips through, confirming the start of a new expansion leg.
🛰️ Fundamental Catalyst
🗓️ 04:46 AM EDT, 10/29/2025 (MT Newswires) —
WISeKey International ( NASDAQ:WKEY ) and its subsidiaries SEALSQ (LAES) and WISeSat.Space announced a partnership memorandum with INNOSPACE, a South Korean satellite launch services provider.
The collaboration aims to expand post-quantum encryption technologies into orbit.
Earlier this month, WISeKey and SEALSQ confirmed they will demonstrate post-quantum encryption in orbit during a SpaceX launch from Vandenberg Space Force Base, marking a milestone in next-generation cybersecurity and space infrastructure integration.
These developments reinforce WISeKey’s growing footprint in secure IoT, quantum cryptography, and satellite communications — three rapidly converging markets.
📊 Finviz Snapshot
Metric Value Notes
Market Cap $28.14M Small-cap, low-float
P/S 2.33 Reasonable for tech microcap
Gross Margin 41.22% Healthy despite low revenue
Current Ratio 6.05 Strong liquidity
Debt/Equity 0.16 Very low leverage
YTD Performance +566% Strong momentum
52W Low → High $1.61 → $17.90 +970% range
Peers PXLW, SQNS, PRSO, CYBR, OKTA, PANW, FTNT Competes in cybersecurity & IoT tech
Despite dilution pressure from prior offerings, WKEY remains one of the few small-cap plays actively bridging quantum security + satellite communications — both sectors expected to grow exponentially through 2030.
💡 My Plan
Watching for continued strength above the $14.50 region.
Entry Zone: $13.80–$14.50
Breakout Confirmation: $15.98+ close
Targets: $17.90 → $20.27
Invalidation: Close below $12.50 (loss of short-term structure)
Post-quantum encryption meets satellite communication 🚀
Do you think NASDAQ:WKEY can push past $15.98 resistance and retest $20 — or will the volume wall hold it down short term?
Drop your outlook (bullish/bearish) and I’ll post a follow-up MyMI-style update with on-chart projections 📈
#WKEY #QuantumComputing #Cybersecurity #SpaceTech #Stocks #MyMIWallet #AIAnalysis #TradingView NASDAQ:WKEY NASDAQ:LAES AMEX:SPY NASDAQ:QQQ
$BULL - WeBull Corp - $12.54 RT - $15.38 PTNASDAQ:BULL has been consolidating since hitting a 3-month High at $18.35 and looks to be breaking out of that mid-level trend (Yellow) to retest the $12.54 previous support, where we expect some resistance. Looking for a continuation in that Price Level to make its way back to the $15.38's after a Double-bottomed off the $10.56.
RECENT NEWS:
Investors can now trade corporate bonds seamlessly on Webull's desktop and mobile platforms
NEW YORK, Oct. 16, 2025 /PRNewswire/ -- Webull (NASDAQ: BULL), an online investment platform, today announced the launch of corporate bond trading for U.S. customers. Investors are now able to buy and sell individual corporate bonds directly on Webull's desktop and mobile platforms.

$DFLI - #Dragonfly #Energy - $2.26 Retest - $2.61 PTNASDAQ:DFLI broke above it's $1.21 Resistance, and finding support the $1.27 it needs to continue it's push and retest of the $1.64. We expect it to blow past $1.64, at best to the $1.80s, with an overall price target of $2.26 based on the volume behind the push.
RECENT NEWS:
Dragonfly Energy Holdings Corp's (NYSE:DFLI) short interest as a percent of float has risen 182.72% since its last report. According to exchange reported data, there are now 12.75 million shares sold short, which is 15.38% of all regular shares that are available for trading. Based on its trading volume, it would take traders 1.0 days to cover their short positions on average.
Dragonfly Energy Regains Full Compliance with Nasdaq Continued Listing Requirements

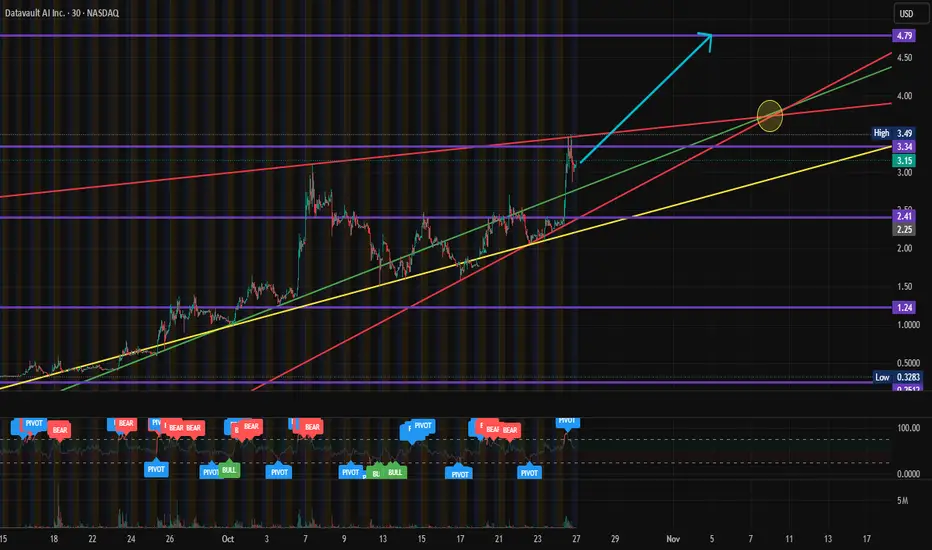
$DVLT - #DataValutAI - $3.34 Retest - $4.79 Price TargetNASDAQ:DVLT finally broke out of $2.41 and retested $3.34. We expect a continuation breakout to retest $3.34 once again, before marching to the $4.79 Levels next.
Datavault AI shares are trading higher after Wellgistics Health recently signed a non-binding letter of intent to integrate Datavault's blockchain-enabled PharmacyChain smart contract technology into its infrastructure.
Demand Zone in Focus: MSS Shift Signals Potential LongHello Traders,
Wishing everyone a productive week ahead! Today, price action is sitting at a clearly defined demand zone, and we’ve just seen a shift in market structure (MSS). Based on this, I’m looking to go long from the potential demand area.
However, keep in mind there’s still a strong external bearish trend. For added confirmation, consider waiting for a break of the last lower high (LH) before entering a long position.
Stay sharp and trade safe! 💪

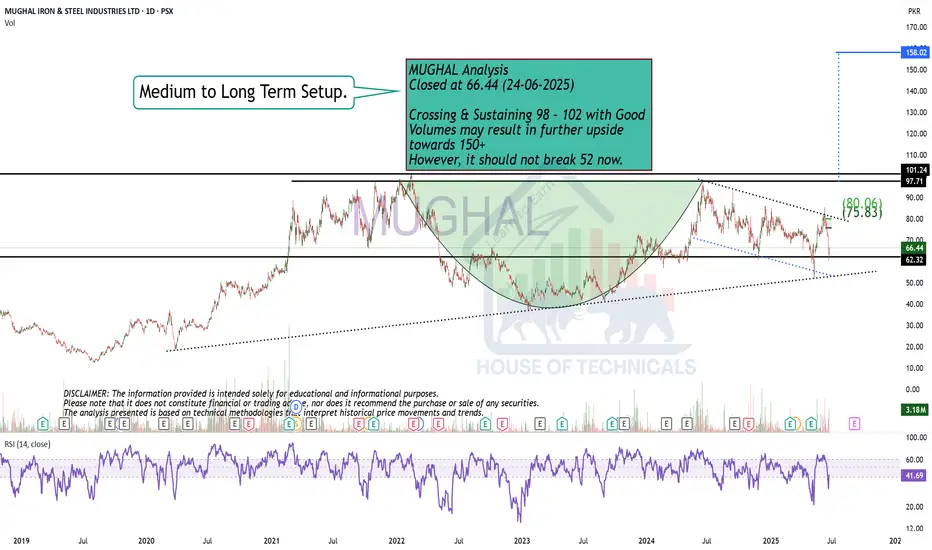
Cup & Handle FormationMUGHAL Analysis
Closed at 66.44 (24-06-2025)
Crossing & Sustaining 98 - 102 with Good
Volumes may result in further upside
towards 150+
However, it should not break 52 now.
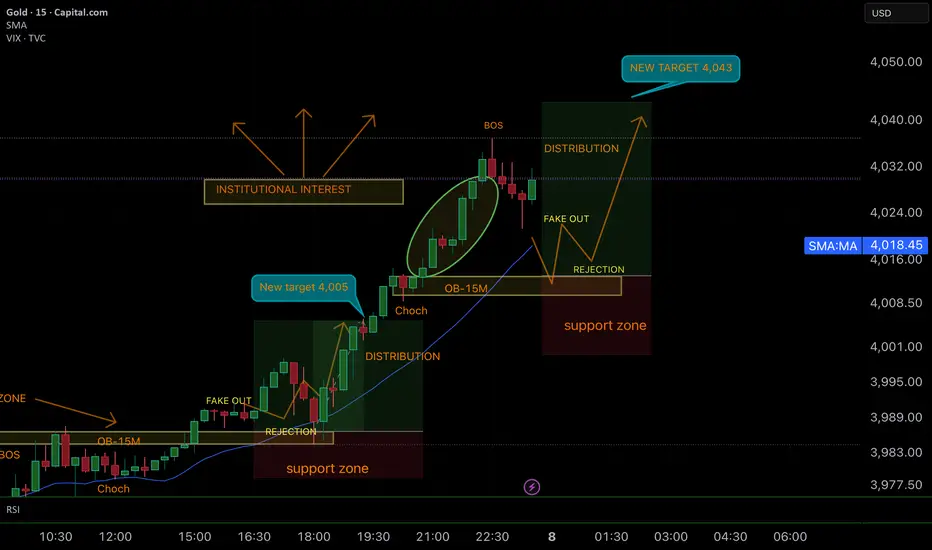
SMART MONEY CONCEPT (SMC) 📊 SMC Analysis – GOLD 15M
• After the previous distribution and push to 4,005, price made a reset with a clean rejection at the support zone.
• A new Change of Character (ChoCH) and Break of Structure (BOS) confirmed continued institutional interest.
• Current projection: we may see a fake out and rejection before the next bullish leg.
• The market structure suggests continuation to the upside, targeting the 4,043 zone.
• Setup remains valid as long as price respects the support zone.
GOOD LUCK TRADERS…. ;)
AUDJPY — Buy the Retest?AUDJPY remains overall bullish inside a rising channel. Price is hovering above a 96.0–96.5 support zone, which previously acted as resistance and now aligns with the channel’s lower boundary, a solid confluence area.
🔑 Key levels
Support: 96.0–96.5 (zone to watch for bullish rejection)
Resistance: 98.5 then 100.0 (round number / channel upper band)
📊 Scenarios
Bullish 📈 If price retests 96.0–96.5 and prints confirmation (higher low / bullish candle), I’ll look for longs toward 98.5 → 100.0.
Bearish 📉 A daily close below 96.0 would invalidate the setup and open room toward the next liquidity pocket near the channel low.
What’s your plan here => wait for the retest into 96s, or trade the continuation if momentum kicks in first? 🤔
⚠️ Disclaimer: This is not financial advice. Always do your own research and manage risk properly.
📚 Stick to your trading plan regarding entries, risk, and management.
Good luck! 🍀
All Strategies Are Good; If Managed Properly!
~Richard Nasr

USDJPY - Range Floor + Trend Support = ConfluenceUSDJPY remains overall bullish within a rising channel, while price has been ranging between a lower demand band and the upper supply.
We’re now dipping into the 146.0–146.7 support area, which aligns with the channel’s lower boundary — a classic confluence zone to hunt for longs.
🔑 Key levels
Support: 146.0–146.7 (range floor + channel support)
Resistance: 149.8–151.0 (range top / supply)
📊 Scenarios
Bullish 📈 Look for a higher-low / bullish candle from 146s → path toward 149.8–151.0.
Bearish 📉 Daily close below 146.0 would invalidate the setup and open a deeper pullback before buyers try again.
Do you buy the retest into the 146s, or wait for momentum to kick in first? 🤔
⚠️ Disclaimer: This is not financial advice. Always do your own research and manage risk properly.
📚 Stick to your trading plan regarding entries, risk, and management.
Good luck! 🍀
All Strategies Are Good; If Managed Properly!
~Richard Nasr

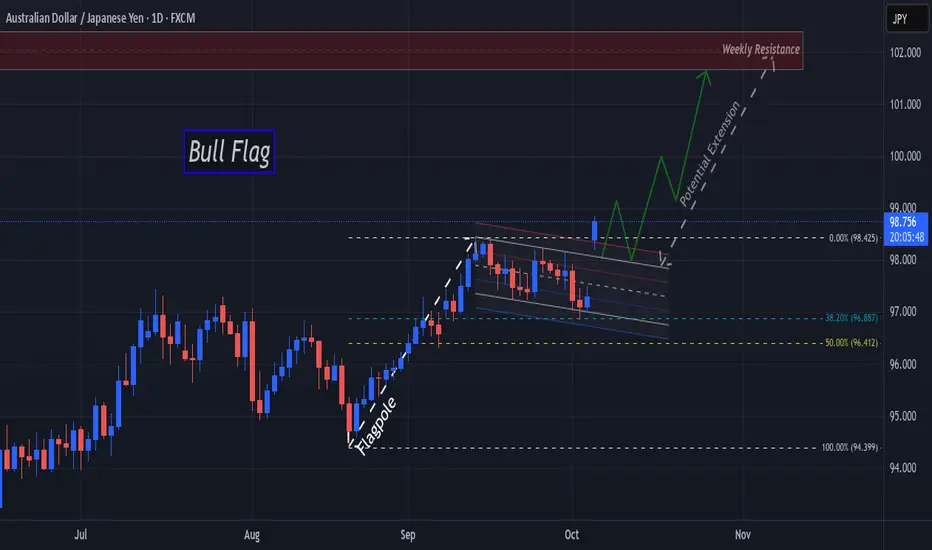
AJ Bulls Raise A Flag As They Gap Up To Start The Week!Price on OANDA:AUDJPY has been consolidating down a Descending Channel for the past 3 weeks and after making a 38.2% Retracement of the 98.425 High, to open this week, Bulls created a huge gap up, breaking out of the Descending Channel!
This Breakout confirms the Continuation Pattern, the Bull Flag!
If Bulls are able to secure a close higher than 98.425 during this Breakout and are successful in a Retest in the 98 - 97.8 range, this could deliver potential Long opportunities as a Bull Flag Breakout and Retest Set-Up!
Once we have a Valid Breakout and Successful Retest, the Price Target for the move will be into the Weekly Resistance that can be found in the 102 range from November Highs of 2024!
BTC - Weekly Breakout!📈 BTC has already broken out of its correction phase and is holding strong above $118k.
As long as $118k holds, the next targets sit between $126k–$140k.
Only a drop below $114k would delay the bullish outlook.
Trend remains strongly bullish after the breakout.
⚠️ Disclaimer: Not financial advice. Manage risk properly.
All Strategies Are Good; If Managed Properly!
~Richard Nasr.

Xau/Usd - Bullish Breakout Setup Towards 4000Price is currently showing bullish momentum after rejecting the support zone. We have a clear break in structure, and the market is approaching a key resistance/imbalance zone.
Plan:
• Wait for a candle close above the marked zone to confirm bullish strength.
• Once confirmed, look for a retest of the breakout level to enter long positions.
• First target: previous strong high around 3870 – 3900.
• Continuation possible towards 4000 psychological level if momentum sustains.
Invalidation:
• If price fails to close above the zone and rejects back downward, bullish bias is invalidated and we may revisit the support area.
Always manage risk with proper stop-loss and position sizing.

EURUSD – Bears Still in Control!EURUSD has been overall bearish, trading within a clear descending channel. After rejecting the 1.1950s, price broke structure and shifted momentum to the downside.
At the moment, price is retesting a strong structure zone that aligns with the upper red trendline of the channel. This area acts as a confluence resistance.
As long as EURUSD trades below this zone, the bears remain in control. I’ll be looking for short opportunities from here with the next bearish impulse in mind.
If this structure is broken upward, only then would the short-term bias start to shift. Until then, the path of least resistance remains down.
Do you think EURUSD will respect this resistance, or could we see a breakout to reverse the trend? 🤔
⚠️ Disclaimer: This is not financial advice. Always do your own research and manage risk properly.
📚 Stick to your trading plan regarding entries, risk, and management.
Good luck! 🍀
All Strategies Are Good; If Managed Properly!
~Richard Nasr.

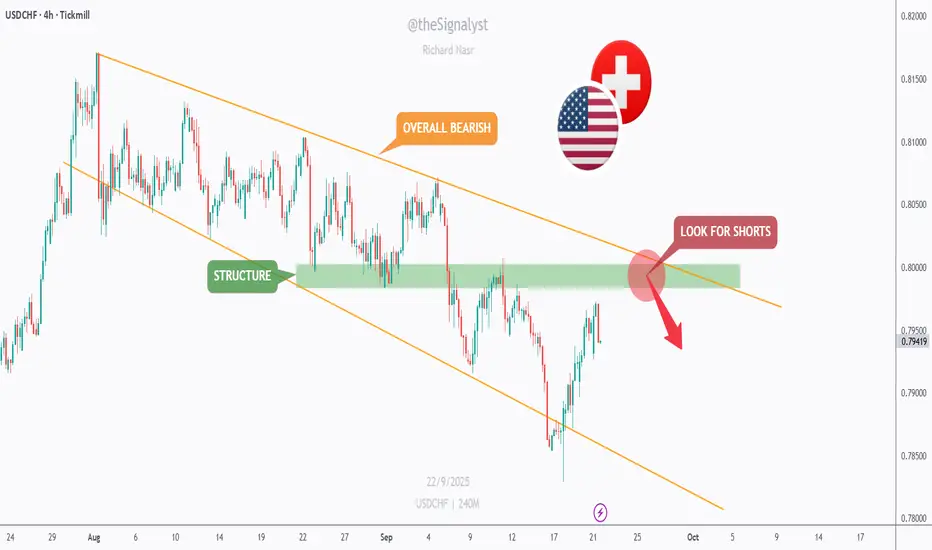
USDCHF — Rally Into Structure, Short the Retest?USDCHF has been overall bearish on the 4H, sliding inside a falling channel. After a bounce, price is rotating back into the 0.798–0.802 structure zone, right at the channel’s upper bound.
This confluence is key 🔑. If sellers react here, I’ll look for rejection shorts toward 0.790 first, then 0.785–0.780 near the channel floor. A clean 4H close and hold above 0.802 would invalidate the idea and expose 0.806–0.810 next ⏳.
What’s your plan => fade the rally at supply, or wait for confirmation before jumping in? 🤔
⚠️ Disclaimer: This is not financial advice. Always do your own research and manage risk properly.
📚 Stick to your trading plan regarding entries, risk, and management.
Good luck! 🍀
All Strategies Are Good; If Managed Properly!
~Richard Nasr
#BTCEUR #1D (Binance) Bull-flag breakout and retestBitcoin looks very good for bullish continuation after regaining 50MA support on daily, against the Euro.
⚡️⚡️ #BTC/EUR ⚡️⚡️
Exchanges: Binance
Signal Type: Regular (Long)
Amount: 12.0%
Entry Targets:
1) 93017.86
Take-Profit Targets:
1) 108422.28
Stop Targets:
1) 85296.36
Published By: @Zblaba
CRYPTOCAP:BTC BINANCE:BTCEUR #Bitcoin #PoW bitcoin.org
Risk/Reward= 1:2.0
Expected Profit= +16.6%
Possible Loss= -8.3%
Estimated Gaintime= 1-2 months
