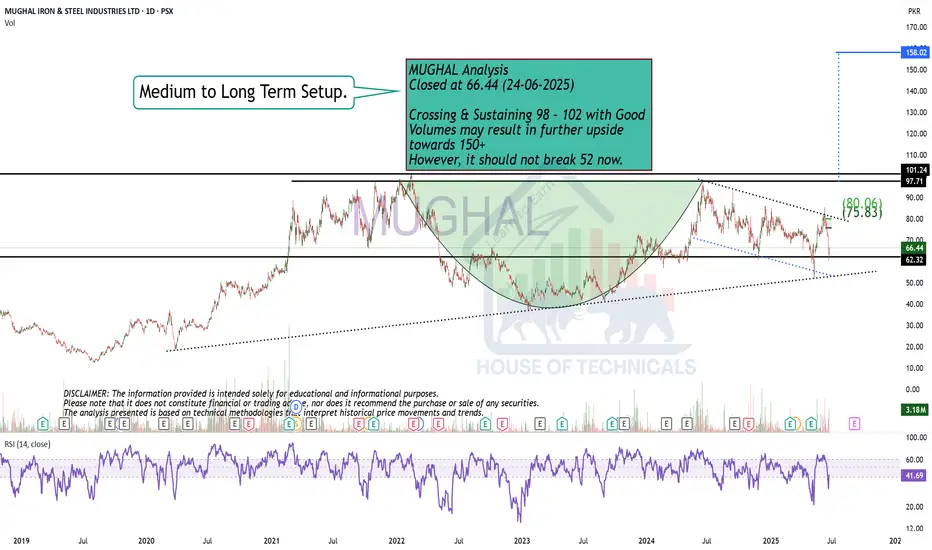
Cup & Handle FormationMUGHAL Analysis
Closed at 66.44 (24-06-2025)
Crossing & Sustaining 98 - 102 with Good
Volumes may result in further upside
towards 150+
However, it should not break 52 now.
Continuationpatterns
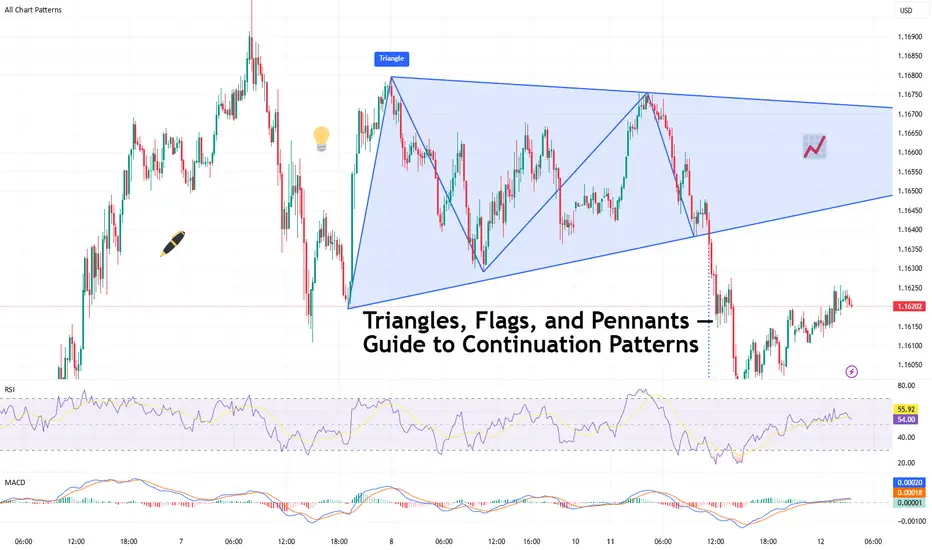
Triangles, Flags, and Pennants — Guide to Continuation PatternsChart patterns can be mysterious — until they’re not. Let’s break down the technical trio that tells you when a trend’s just taking a breather before it flexes again.
So your chart’s been pumping higher for weeks, and then… nothing. Price starts scribbling sideways. Cue panic? Maybe. But more likely, you’re staring at a continuation pattern.
Triangles, flags, and pennants are the subtle “hold my beer before I try to pull a move” signals of technical analysis. They show up when markets pause — not reverse. That pause could mean your trend is catching its breath, not dying in a ditch.
In other words: don’t close your longs just because things go quiet. Sometimes the market is just stretching before it sprints again.
⚠️ Symmetrical, Ascending, Descending
Let’s talk triangles, the Swiss Army knife of consolidation. These shapes come in three stylish varieties:
● Symmetrical triangle: Higher lows, lower highs. Traders call this the indecision pattern, but don’t get it twisted — it may just be winding up for a breakout. Wanna see how these look in practice? Dive into our community’s symmetrical triangle ideas .
● Ascending triangle: Flat top, rising bottom. Buyers are aggressive, their patience is running out. Resistance looks like it’s begging to be broken. Check the ascending triangle ideas for your viewing consideration.
● Descending triangle: Flat bottom, falling top. This one’s more bearish than your boomer uncle who knows zero about Bitcoin BITSTAMP:BTCUSD , and yes — it’s often a precursor to a breakdown. Follow the descending triangle ideas and make sure you DYOR.
Key tip : Wait for the breakout. Don’t front-run triangles unless you like volatility surprises and emotional damage.
🚩 Flags: Fast Moves, Tight Consolidations
Flags form after a sharp price move — the “flagpole” — followed by a tight, slightly sloping channel that moves against the prevailing trend. They’re short-term patterns that act like pit stops during a race.
● In a bull flag, price rallies sharply, then consolidates lower in a downward-sloping rectangle. If price breaks above the upper boundary, the uptrend is likely to resume. Jump straight into the bullish flag ideas .
● In a bear flag, price crashes, then drifts higher or sideways, forming an upward-sloping consolidation. A breakdown below the lower support hints at a continuation lower. What goes up must go down — bearish flag ideas for thought.
Flags are prized for their reliability and tight risk-to-reward setups. The breakout is typically swift, and traders often use the length of the flagpole as a projected target.
🎏 Meet the Pennant: The Flag’s Cousin
Pennants are like mini-triangles that form after a strong price move, usually in high-volume conditions. Unlike regular triangles, they’re smaller and more compressed — a tight consolidation in the shape of a tiny symmetrical triangle.
What makes a pennant different from a flag? The structure. While flags are rectangular, pennants are more pointed — a converging pattern rather than parallel lines.
Pennants are often seen in high-momentum environments, and when price breaks out of the consolidation zone, it often does so with force. Get some pennant ideas straight from our community.
🧐 How to Actually Trade These Patterns
Spotting a continuation pattern is one thing. Trading it with discipline is another.
Here’s a basic checklist:
● Identify the trend. Continuation patterns only work when there’s a clear preceding move. If the chart is a sideways mess, maybe skip it.
● Draw your levels. Use trendlines or horizontal support/resistance to outline the pattern. Keep it clean — if you’re forcing a pattern, it probably isn’t there.
● Wait for the breakout. Don’t jump in too early. Let the price confirm your bias. Breakouts are more credible with a volume spike.
● Set your stop wisely. Most traders place stops just outside the opposite side of the pattern — below the lower trendline in an uptrend, or above the upper trendline in a downtrend.
● Target projection. Many use the height of the pattern or the flagpole to estimate a target price, though market conditions should influence your approach.
🤔 So, What Could Go Wrong?
Glad you asked. Plenty.
● Fakeouts: Just because it looks like a breakout doesn’t mean it’s real. Wait for confirmation — volume, a close outside the pattern, or your favorite indicator giving the green light.
● Shaky patterns: Not every triangle-looking pattern is a triangle. Sometimes it’s just noise. Don’t make up patterns. The market doesn’t care about your geometry.
● Overleveraging: Continuation patterns look reliable, but no pattern is bulletproof. Position sizing still matters. Don’t bet the farm because a pennant gave you butterflies.
💡 Pro Tips from the Chart Trenches
● Set alerts on trendline breaks so you’re not glued to the screen like a caffeinated hawk.
● Use pattern recognition tools if you’re a newer trader — but verify manually. No software is a crystal ball.
● Trade continuation patterns in the direction of the trend. Countertrend flags are usually bear traps in disguise.
📌 One Last Thing: Pattern ≠ Prediction
Chart patterns don’t tell the future. They tell a story about buyer and seller behavior. Continuation patterns? They’re just the market saying, “Yeah, we’re still into this trend. Just grabbing some break first.”
Use them as one part of a system. Combine them with momentum indicators, volume, or good ol’ fashioned risk management.
Because in the end, it’s not about how many triangles you find — it’s about how many fakeouts you avoid.
Off to you : Spotted any textbook triangles or sneaky flags this week? Or caught a pennant fakeout that wrecked your stop loss?
Drop your best (or worst) continuation pattern story below. You never know who might learn something from your chart scars.
Cup & handleCup & Handle Formation Expected.
Crossing & Sustaining the Resistance level may lead it towards new highs.

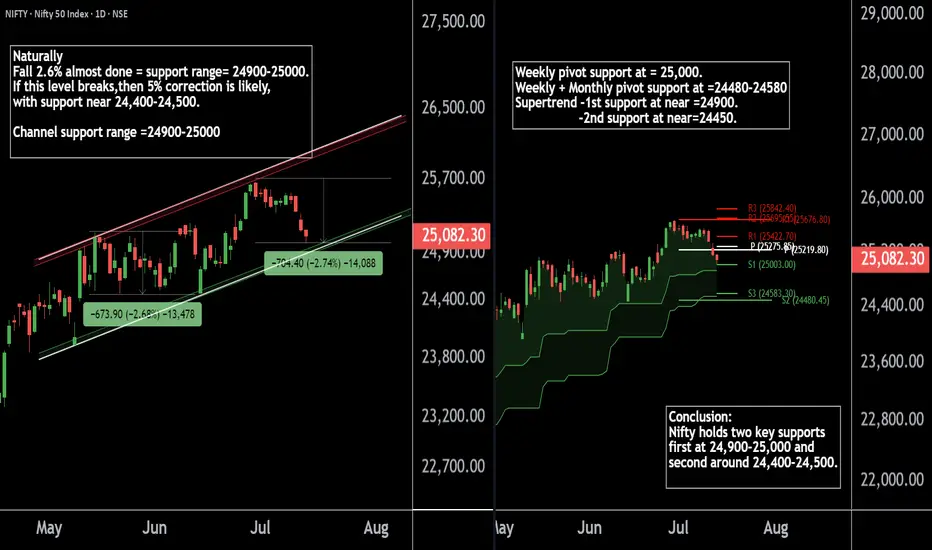
Nifty50's Key Level !! Keep an eye on these levels.Here are two Nifty charts, both on the daily timeframe.
Current Correction:
Nifty has naturally corrected by 2.7%, currently trading in the 24,900-25,000 range.
Weekly Pivot:
The weekly pivot support is positioned at 25,000, providing immediate support.
Support Levels:
First Support: 24,900-25,000 zone.
Second Support: If this level breaks, Nifty may see a 5% correction, with the next support around 24,400-24,500.
If this level sustain we may see higher prices in Nifty 50.
Thank You !!
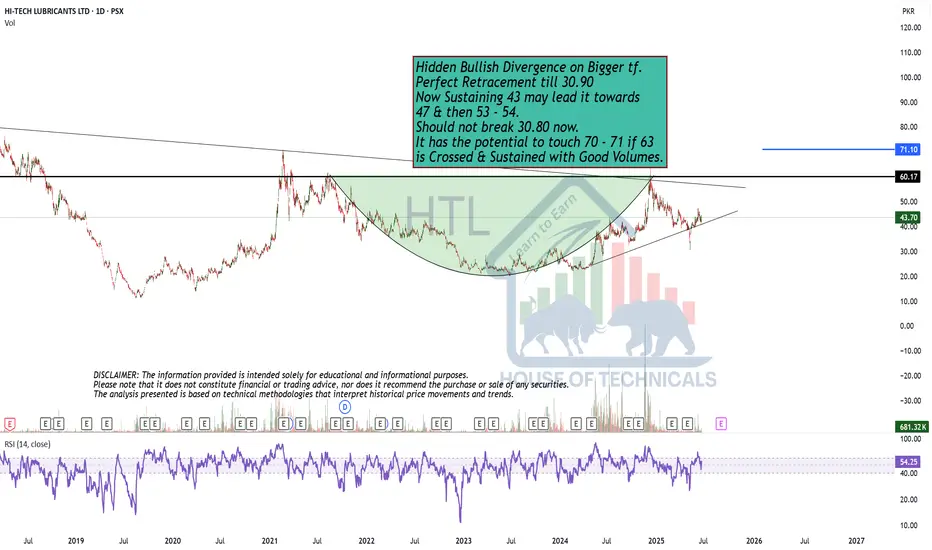
Perfect Retracement till 30.90Hidden Bullish Divergence on Bigger tf.
Perfect Retracement till 30.90
Now Sustaining 43 may lead it towards
47 & then 53 - 54.
Should not break 30.80 now.
It has the potential to touch 70 - 71 if 63
is Crossed & Sustained with Good Volumes.
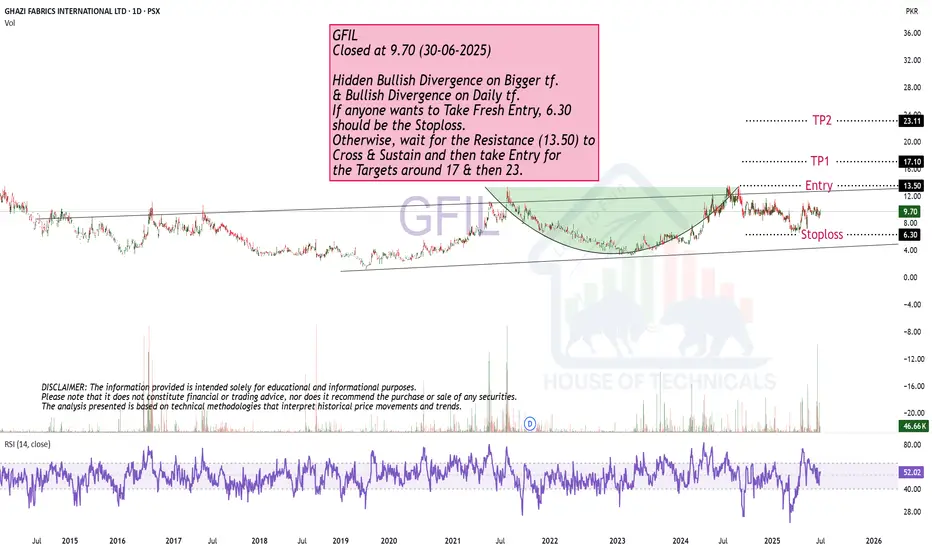
Cup & Handle Formation.GFIL
Closed at 9.70 (30-06-2025)
Hidden Bullish Divergence on Bigger tf.
& Bullish Divergence on Daily tf.
If anyone wants to Take Fresh Entry, 6.30
should be the Stoploss.
Otherwise, wait for the Resistance (13.50) to
Cross & Sustain and then take Entry for
the Targets around 17 & then 23.
Though stock is Bullish, but
Though stock is Bullish, but a Very Strong Resistance
is around 11.50 - 12.
Crossing & Sustaining this level may
lead it towards 14 initally.
8 should be the Stoploss as of now. Breaking this level
will drag the price towards 6.50 - 7.40

Bearish Divergence appeared.Bearish divergence appeared on Daily as well as
Weekly TF.
Strong resistance is there around 127 - 129.
Once this level is Crossed, we have open ways
towards 145 - 147
On the flip side, we have a good support around
120-122. However, breaking 116 this time will bring
more selling pressure towards 113 initially.

Breakout re-tested.Breakout re-tested.
Morning Star formation.
The only concerning thing is Bearish
Divergence appearing on Weekly TF.
Crossing & Sustaining 140 may lead it
towards 160.
However, breaking 120 may bring further
selling pressure.

Defined Resistance Zone465 - 502 is a Resistance Zone.
Those who are already holding it, should keep
the Stoploss of 339.
Fresh Entrants may wait for 502 to Cross & Sustain
targeting 545 - 550 & then 600 - 650.

Cup & Handle Formation.Cup & Handle Formation.
170 - 174 is the Resistance Zone.
Targets can be around 200 - 205.
On the flip side, If 145 is broken,
we may witness further Selling Pressure.

Bitcoin long awaited correctionIf you look at previous years, January has always been bearish. January 2025 is no different. After a long bull run since the latest halving Bitcoin required a correction to gain more liquidity and shake out margin longs. After that it should follow somewhat similar continuation pattern.
Long term prediction stays the same

30 RR EURUSD Pre-MarketHeavy Rejection off VWAP
-6E High of day Sweep
-Hook liquidity grab at end of Asia
-Large volume profile imbalance
-Bearish market structure
The SL is literally tight enough to be spread - best for ECN. If not use around 6PIP SL

USOIL 71.85 - 0.35% MULTI-TF SET UP INTRADAY TRADEHELLO TRADERS
Hope everyone is doing great
📌 A look at The US0IL At the close of ASIA INTO THE LONDON, TO NY PM SESSION
- As we draw to the close of the week, looking for USOIL to close bullish.
* on the 4H looking for a bearish open with the close of ASIAN SESSION.
* PO3
* Push LOWER before going for HIGHER structures LQ pull.
1 HOUR TF
* Looking for the mitigation of the bullish OB+.
* FVG below has already been mitigated.
* if this structure holds, looking for long entries to close the week.
* USOIL 30M
- Waiting to trade in discounted price.
- If this happens looking for a push higher into premium.
- Most PDARRAYS are filled below so looking for a bullish close this friday.
* BASED on the price action served next session...
* We will see what does the market dish.
🤷♂️😉🐻📉🐮📈
HOPE YOU ENJOYED THIS OUT LOOK, SHARE YOUR PLAN BELOW,🚀 & LETS TAKE SOME WINS THIS WEEK.
SEE YOU ON THE CHARTS.
IF THIS IDEA ASSISTS IN ANY WAY OR IF YOU ENJOYED THIS ONE
SMASH THAT 🚀 & LEAVE A COMMENT.
ALWAYS APPRECIATED
____________________________________________________________________________________________________________________
Kindly follow your entry rules on entries & stops. |* Some of The idea's may be predictive yet are not financial advice or signals. | *Trading plans can change at anytime reactive to the market. | * Many stars must align with the plan before executing the trade, kindly follow your rules & RISK MANAGEMENT.
_____________________________________________________________________________________________________________________
|
* ENTRY & SL -KINDLY FOLLOW YOUR RULES | * RISK-MANAGEMENT | *PERIOD - I TAKE MY TRADES ON A INTRA DAY SESSIONS BASIS THIS IS NOT FINACIAL ADVICE TO EXCECUTE ❤
LOVELY TRADING WEEK TO YOU!

USDJPY 151.950 -0.64% LONG IDEA INTRADAY SET-UPHELLO TRADERS
Hope everyone is doing great
📌 A look at USDJPY from MULTI TIME-FRAME ANALYSIS
USDJPY 4H TF
* Mon. opens strongly bullish with the 7am SAT pushing up but wicking out.
* Trading out of a sweep on an long term high.
* 4H vi above looking good for targets.
* looking for long entries in correlation with the DXY
* looking for PO3 rules towards the Downside to continue HIGHER.
* The weekly & daily TF show we are still showing signs of a BULLISH move still.
* Looking for continuation of this move.
* We saw a rally with the bears, strong momentum to the downside.
* Looking at the 1H FVG, this is where I would look for long entries this week.
* Should this PD ARRAY hold will be LONG for the GJ intraday.
* BASED on the price action served.
HOPE YOU ENJOYED THIS OUT LOOK, SHARE YOUR PLAN BELOW,🚀 & LETS TAKE SOME WINS THIS WEEK.
SEE YOU ON THE CHARTS.
IF THIS IDEA ASSISTS IN ANY WAY OR IF YOU ENJOYED THIS ONE
SMASH THAT 🚀 & LEAVE A COMMENT.
ALWAYS APPRECIATED
____________________________________________________________________________________________________________________
*
Kindly follow your entry rules on entries & stops. |* Some of The idea's may be predictive yet are not financial advice or signals. | *Trading plans can change at anytime reactive to the market. | * Many stars must align with the plan before executing the trade, kindly follow your rules & RISK MANAGEMENT.
_____________________________________________________________________________________________________________________
| * ENTRY & SL -KINDLY FOLLOW YOUR RULES | * RISK-MANAGEMENT | *PERIOD - I TAKE MY TRADES ON A INTRA DAY SESSIONS BASIS THIS IS NOT FINACIAL ADVICE TO EXCECUTE ❤
LOVELY TRADING WEEK TO YOU!

EURUSD 1.09085 +0.71% short idea INTRA-DAY SET UP...HELLO TRADERS
Hope everyone is doing great
📌 A look at The EURUSD NY FROM AM - PM SESSION
* With a bullish run into Monday CLOSE (PO3) today will be looking for some retracement.
* looking at the daily HIGH taken which is a sign of weakness on EU.
* Looking at the VI below as targets as well.
* on the 4H looking for a bullish open to take ASIA high LQ✔.
* PO3
* Push higher before going for lower structures✔.
* looking for an aggressive move above out of the range to sweep.
* and aggressive in.
* this where I would look for entries short.
* Looking for the take of that ERL WHICH we saw friday.
* with two possible OTE ( ASIA HIGHS, AND LONG TERM HIGH) , EXECUTION IS BASED ON RR & RISK MANAGEMENT.
* DXY 15M
- Will wait for the DXY to take ASIA lows and trade back in the range as a confirmation as well...
* BASED on the price action served next session...
* We will see what does the market dish.
🤷♂️😉🐻📉🐮📈
HOPE YOU ENJOYED THIS OUT LOOK, SHARE YOUR PLAN BELOW,🚀 & LETS TAKE SOME WINS THIS WEEK.
SEE YOU ON THE CHARTS.
IF THIS IDEA ASSISTS IN ANY WAY OR IF YOU ENJOYED THIS ONE
SMASH THAT 🚀 & LEAVE A COMMENT.
ALWAYS APPRECIATED
____________________________________________________________________________________________________________________
Kindly follow your entry rules on entries & stops. |* Some of The idea's may be predictive yet are not financial advice or signals. | *Trading plans can change at anytime reactive to the market. | * Many stars must align with the plan before executing the trade, kindly follow your rules & RISK MANAGEMENT.
_____________________________________________________________________________________________________________________
|
* ENTRY & SL -KINDLY FOLLOW YOUR RULES | * RISK-MANAGEMENT | *PERIOD - I TAKE MY TRADES ON A INTRA DAY SESSIONS BASIS THIS IS NOT FINACIAL ADVICE TO EXCECUTE ❤
LOVELY TRADING WEEK TO YOU!

The Low Hanging Fruit Stacey Burke setup, with Silver R4,5 shortIn this video, I walk you through my entire thought process during today's trading session. You'll learn how I selected the pairs and executed three key trades:
Silver 3 Sessions of Rise Reversal short
DJ30 Low Hanging Fruit Continuation short
I'll also provide a detailed explanation of the Low Hanging Fruit setup, helping you understand how to apply this strategy in your own trading. Low Hanging Fruit is a key best trade setup of Stacey Burke. Don't miss out on these valuable insights and tips!
For details on the Stacey Burke style trading approach see his site and playbook: https://stacey-burke-trading.thinkifi...

NASDAQ 100 Index - Technical Analysis [Long Setup] 🔹 NASDAQ Analysis on 1H chart
- The current Trend is BULLISH
- There is no divergences
- Continuation pattern is present which is bullish flag
🔹 Trade Plan For 1HR
- Entry Level = 20386.3
- Stop Loss = 20312.7
- TP1 = 20458.6
🔹 Risk Management
- First TP is 1:1
🔹 How to Take Trade?
- Only risk 2% of your portfolio
- Take 1% risk entry with 1:1 RR
- Take 1% risk entry with 1:2 RR
Like and subscribe to never miss a new idea! ✌🏼

Alikze »» ENS | Corner pattern formation - 4H🔍 Technical analysis: Corner pattern formation - 4H
- It is moving in a corner pattern in the 4-hour time frame.
- Due to the formation of the Double Bottom pattern, higher floors and higher ceilings have been formed in the range of 15.80.
- Therefore, it can continue its growth with pullback to the range of 17.50 to the dynamic trigger and form a newer ceiling.
- In addition, with the failure of the dynamic trigger, it can continue to grow until the supply area.
💎 Alternative scenario:
If the green box is broken sharply, it can continue its dynamic correction (origin of movement) until the bottom of the trigger.
»»»«««»»»«««»»»«««
Please support this idea with a LIKE and COMMENT if you find it useful and Click "Follow" on our profile if you'd like these trade ideas delivered straight to your email in the future.
Thanks for your continued support.
Best Regards,❤️
Alikze.
»»»«««»»»«««»»»«««
BINANCE:ENSUSDT

US100 19.220.6 +2.21% + S&P 500 MULTI TF ANALYSISHELLO TRADERS
Hope everyone is doing great
📌 A look at MULTI TIME-FRAME ANALYSIS on NAS 100 & S&P500.
NAS100 WEEKLY TF
* 2 WEEKS bearish run delivering from the -FVG On the NAS100 & S&P500 from the weekly might have just ran its course.
* With the week opening on a bullish run, looking for that monthly FVG TO HOLD.
* Looking for a bullish week close and continuation with the bulls.
* with a -FVG & -OB looking for a small reversal possibly short term but overall bullish.
* Because The weekly & daily TF show we are still trading in BULLISH conditions on the NAS100 & S&P500.
ON THE S&P500 M & W
* The setup is clearer or price action is somewhat cleaner.
MONTHLY
WEEKLY
DAILY TF
* Looking for violation of the daily FVG.
* To confirm bullish continuation
*S&P500
4H
* still bullish on NAS100 Trend cont. favored until otherwise price shows some significant bearish moves.
* otherwise choch + for bullish moves
* looking for a bounce of + OB
SENTIMENTS THE SAME ON THE S&P500
1H TF
* Sentiment remains, remain bullish unless otherwise.
* Probably be looking for LONG OPPORTUNITIES otherwise, We will see what does the market dish.
🤷♂️😉🐻📉🐮📈
HOPE YOU ENJOYED THIS OUT LOOK, SHARE YOUR PLAN BELOW,🚀 & LETS TAKE SOME WINS THIS WEEK.
SEE YOU ON THE CHARTS.
IF THIS IDEA ASSISTS IN ANY WAY OR IF YOU ENJOYED THIS ONE
SMASH THAT 🚀 & LEAVE A COMMENT.
ALWAYS APPRECIATED
____________________________________________________________________________________________________________________
* Kindly follow your entry rules on entries & stops. |* Some of The idea's may be predictive yet are not financial advice or signals. | *Trading plans can change at anytime reactive to the market. | * Many stars must align with the plan before executing the trade, kindly follow your rules & RISK MANAGEMENT.
_____________________________________________________________________________________________________________________
| * ENTRY & SL -KINDLY FOLLOW YOUR RULES | * RISK-MANAGEMENT | *PERIOD - I TAKE MY TRADES ON A INTRA DAY SESSIONS BASIS THIS IS NOT FINACIAL ADVICE TO EXCECUTE ❤
LOVELY TRADING WEEK TO YOU!

GBPUSD 1.30424 0% MULTI TIME-FRAME ANALYSISHELLO TRADERS
Hope everyone is doing great
📌 A look at The CABLE from HTF - MULTI TIME-FRAME ANALYSIS
GBPUSD DAILY TF
* We've had 3 weeks of bearish close on GU.
* ERL TAKEN looking for IRL on the weekly.
* The weekly & daily TF show we are still showing signs of a bearish move.
* But seems we may see continuation with the bears On the D.
* GBPUSD took External range LQ , looking for that internal range LQ to be taken(W FVG).
* We are trading in discount of the move,This is where I would be looking for long entries.
* With PO3 looking to open bullish to confirm a move lower into premium PD ARRAYS.
GBPUSD 4H TF
* looking for Thursday to head bullish into the -OB for a bearish week close.
*open I will probably be looking for shot positions OPPORTUNITIES.
* We will see what does the market dish.
* 4H lookin for a push into the -OB (po3) to sell intraday
.
GBPUSD 1H TF
* We saw a rally with the bears, strong momentum to the downside ON the 1H.
* Looking at the 1H -OB + -FVG, this is where I would look for LONG entries this week.
* Should this PD ARRAY hold will be Short for the GBPUSD.
* BASED on the price action served this week.
HOPE YOU ENJOYED THIS OUT LOOK, SHARE YOUR PLAN BELOW,🚀 & LETS TAKE SOME WINS THIS WEEK.
SEE YOU ON THE CHARTS.
IF THIS IDEA ASSISTS IN ANY WAY OR IF YOU ENJOYED THIS ONE
SMASH THAT 🚀 & LEAVE A COMMENT.
ALWAYS APPRECIATED
____________________________________________________________________________________________________________________
Kindly follow your entry rules on entries & stops. |* Some of The idea's may be predictive yet are not financial advice or signals. | *Trading plans can change at anytime reactive to the market. | * Many stars must align with the plan before executing the trade, kindly follow your rules & RISK MANAGEMENT.
_____________________________________________________________________________________________________________________
| * ENTRY & SL -KINDLY FOLLOW YOUR RULES | * RISK-MANAGEMENT | *PERIOD - I TAKE MY TRADES ON A INTRA DAY SESSIONS BASIS THIS IS NOT FINACIAL ADVICE TO EXCECUTE ❤
LOVELY TRADING WEEK TO YOU!

USDJPY 145.835 145.834 MULTI-TIMEFRAME ANALYSIS + intraday setupHELLO TRADERS
Hope everyone is doing great
📌 A look at USDJPY from MULTI TIME-FRAME ANALYSIS
USDJPY 4H TF
* Tue. opens strongly bearish with the 7am SAT possibly forming a CHOCH on the 4H
* Trading out of a sweep on an long term high.
* 4H iFVG formed
* This is where I would to short the USDJPY should this structure be respected.
* looking for PO3 rules towards the upside to continue lower.
* The weekly & daily TF show we are still showing signs of a BEARISH move still.
* But seems we may see a push up before continuation with the bears with resting LQ above.
* USDJPY took External range LQ, looking for that internal range LQ to be taken.
* We are trading in DISCOUNT of the move,This is where I would be looking for short entries.
* We saw a rally with the bears, strong momentum to the downside.
* Looking at the 1H FVG, this is where I would look for SHORT entries this week.
* Should this PD ARRAY hold will be SHORT for the GJ intraday.
* BASED on the price action served.
HOPE YOU ENJOYED THIS OUT LOOK, SHARE YOUR PLAN BELOW,🚀 & LETS TAKE SOME WINS THIS WEEK.
SEE YOU ON THE CHARTS.
IF THIS IDEA ASSISTS IN ANY WAY OR IF YOU ENJOYED THIS ONE
SMASH THAT 🚀 & LEAVE A COMMENT.
ALWAYS APPRECIATED
____________________________________________________________________________________________________________________
*
Kindly follow your entry rules on entries & stops. |* Some of The idea's may be predictive yet are not financial advice or signals. | *Trading plans can change at anytime reactive to the market. | * Many stars must align with the plan before executing the trade, kindly follow your rules & RISK MANAGEMENT.
_____________________________________________________________________________________________________________________
| * ENTRY & SL -KINDLY FOLLOW YOUR RULES | * RISK-MANAGEMENT | *PERIOD - I TAKE MY TRADES ON A INTRA DAY SESSIONS BASIS THIS IS NOT FINACIAL ADVICE TO EXCECUTE ❤
LOVELY TRADING WEEK TO YOU!
